Working HoursWorking Hours Visualization
Description:
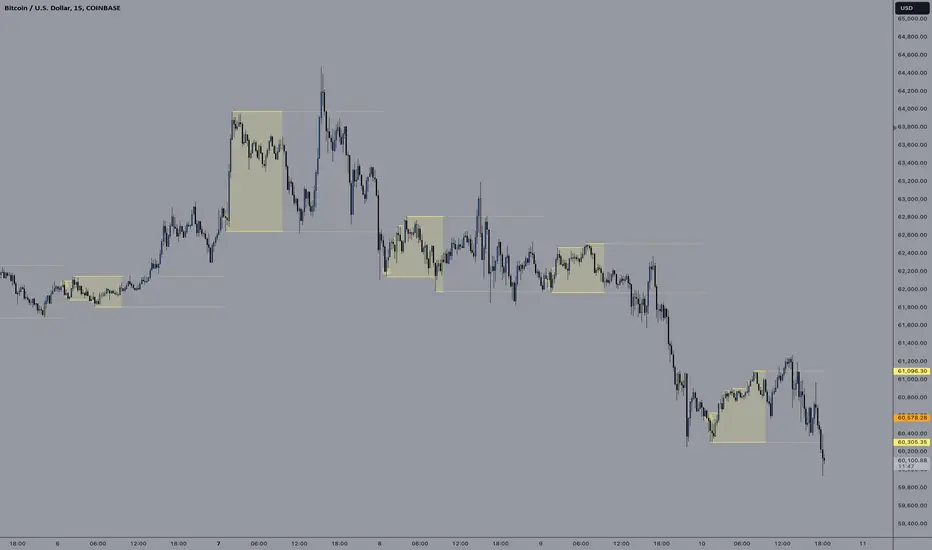
This script is designed to visually highlight specific "Working Hours" sessions on the chart using background colors. It is tailored and optimized for the 15-minute timeframe, ensuring accurate session representation and proper functionality. If you choose to use this script on other timeframes, adjustments may be necessary to maintain its effectiveness.
Key Features:
Working Hours Highlighting: Displays background colors to mark predefined working hours, helping you focus on specific trading sessions.
Future Session Projection: Highlights working hours for future candles, providing a clear visual guide for planning trades.
Customizable Appearance: Offers adjustable colors, transparency, and session timings to suit individual preferences.
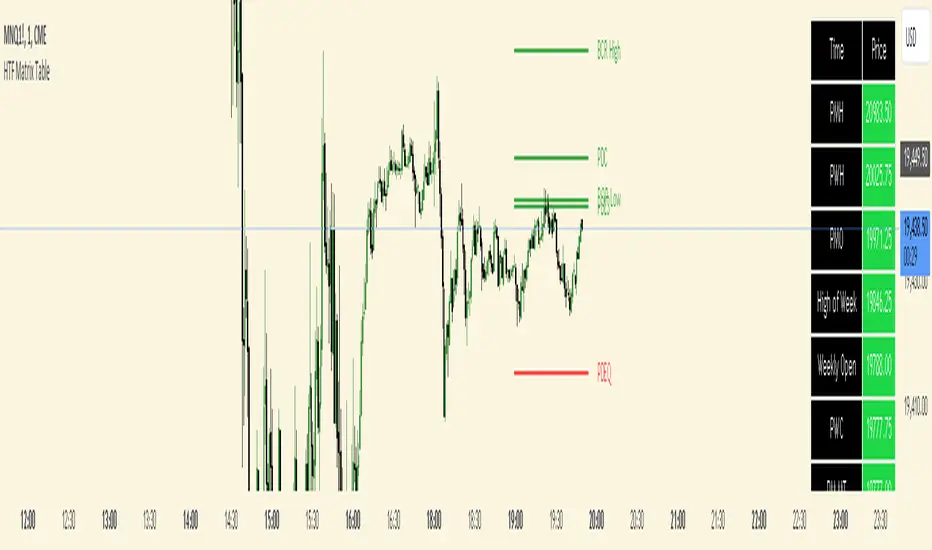
Weekly Separators: Includes optional weekly separators to visually distinguish trading weeks.
Important Notes:
Timeframe Compatibility:
This script is optimized for the 15-minute timeframe.
Using it on other timeframes may require optimization of session inputs and related logic.
Please feel free to reach out if you need assistance with adjustments for different timeframes.
Customization:
You can customize session timings, colors, and transparency levels through the input settings.
Support:
If you encounter any issues or need help optimizing the script for your specific needs, don't hesitate to contact me.
อินดิเคเตอร์ Pine Script®