Scalp Precision Matrix [BullByte]SCALP PRECISION MATRIX (SPM)
OVERVIEW
Scalp Precision Matrix (SPM) is a comprehensive decision-support framework designed specifically for scalpers and short-term traders. This indicator synthesizes five distinct analytical layers into a unified system that helps identify high-quality setups while avoiding common pitfalls that trap traders.
━━━━━━━━━━━━━━━━━━━━━━━━━━━━━━━━━━━━━━━━━━━
THE CORE PROBLEM THIS INDICATOR ADDRESSES
Scalping demands rapid decision-making while simultaneously processing multiple data points. Traders constantly ask themselves: Is momentum still alive? Am I entering near a potential reversal zone? Is this the right session to trade? What is my actual risk-to-reward? Most traders either overwhelm themselves with too many separate indicators (creating analysis paralysis) or use too few (missing crucial context).
SPM was developed to consolidate these essential checks into one cohesive framework. Rather than overlaying disconnected indicators, each component in SPM directly informs and adjusts the others, creating an integrated analytical system.
━━━━━━━━━━━━━━━━━━━━━━━━━━━━━━━━━━━━━━━━━━━
WHY THESE SPECIFIC COMPONENTS AND HOW THEY WORK TOGETHER
The five analytical layers in SPM are not arbitrarily combined. Each addresses a specific question in the scalping decision process, and together they form a logical workflow:
LAYER 1: MOMENTUM FUEL GAUGE
This answers the question: "Does the current move still have energy?"
After any impulse move (a significant directional price movement), momentum naturally decays over time. The Fuel Gauge estimates remaining momentum by analyzing four factors:
Body Strength (30% weight): Compares recent candle body sizes against the historical average. Strong momentum produces candles with large bodies relative to their wicks. The calculation takes the 3-bar average body size divided by the 20-bar average body size, then scales it to a 0-100 range.
Wick Rejection (25% weight): Measures the wick-to-body ratio. When wicks are large relative to bodies, it suggests rejection and weakening momentum. A ratio of 2.0 or higher (wicks twice the body size) scores low; smaller ratios score higher.
Volume Consistency (20% weight): Compares recent 3-bar average volume against the lookback period average. Sustained moves require consistent volume support. Volume dropping off suggests the move may be losing participation.
Time Decay (25% weight): Tracks how many bars have passed since the last detected impulse. Momentum naturally fades over time. The typical impulse duration is adjusted based on the current volatility regime.
These components are weighted and combined, then smoothed with a 3-period EMA to reduce noise. The result is a 0-100% gauge where:
- Above 70% = Strong momentum (green)
- 40-70% = Moderate momentum (amber)
- Below 40% = Weak momentum (red)
- Below 20% = Exhausted (triggers EXIT warning)
The Fuel Gauge also estimates how many bars of momentum remain based on the current burn rate.
IMPORTANT DISCLAIMER : The Fuel Gauge is NOT order flow, volume profile, or depth of market data. It is a technical proxy calculated entirely from standard OHLCV (Open, High, Low, Close, Volume) data. The term "Fuel" is used metaphorically to represent estimated remaining momentum energy.
LAYER 2: TRAP ZONE DETECTION
This answers the question: "Am I walking into a potential reversal area?"
Price tends to reverse at levels where it has reversed before. SPM identifies these zones by detecting clusters of historical swing points:
How it works:
1. The indicator detects swing highs and swing lows using the Swing Detection Length setting (default 5 bars on each side required to confirm a pivot).
2. Recent swing points are stored (up to 10 of each type).
3. For each potential zone, the algorithm counts how many swing points cluster within a tolerance of 0.5 ATR.
4. Zones with 2 or more clustered swing points, positioned between 0.3 and 4.0 ATR from current price, are marked as Trap Zones.
5. A Confluence Score is calculated based on cluster density and proximity to current price.
The percentage displayed (e.g., "TRAP 85%") is a CONFLUENCE SCORE, not a probability. Higher percentages mean more swing points cluster at that level and price is closer to it. This indicates stronger historical significance, not a prediction of future reversal.
CRITICAL DISCLAIMER : Trap Zones are NOT institutional order flow, liquidity pools, smart money footprints, or any proprietary data feed. They are calculated purely from historical swing point clustering using standard technical analysis. The term "trap" describes how price action has historically reversed at these levels, potentially trapping traders who enter prematurely. This is pattern recognition, not market structure data.
LAYER 3: VELOCITY ANALYSIS
This answers the question: "Is price moving favorably right now?"
Velocity measures how fast price is currently moving compared to its recent average:
Calculation:
- Current velocity = Absolute price change from previous bar divided by ATR
- Average velocity = Simple moving average of velocity over the lookback period
- Velocity ratio = Current velocity divided by average velocity
Classification:
- FAST (ratio above 1.5 ): Price is moving significantly faster than normal. Good for momentum continuation plays.
- NORMAL (ratio 0.5 to 1.5) : Typical price movement speed.
- SLOW (ratio below 0.5 ): Price is moving sluggishly. Often indicates ranging or choppy conditions where scalping becomes difficult.
The velocity score contributes 18% to the overall quality score calculation.
LAYER 4: SESSION AWARENESS
This answers the question: "Is this a good time to trade?"
Different trading sessions have different characteristics. SPM automatically detects which major session is active and adjusts its quality assessment:
Session Times (all in UTC):
- A sia Session : 00:00 - 08:00 UTC
- London Session : 08:00 - 16:00 UTC
- New York Session : 13:00 - 21:00 UTC
- London/NY Overlap : 13:00 - 16:00 UTC
- Off-Peak : Outside major sessions
Session Quality Weighting:
- Overlap : 100 points (highest liquidity, best movement)
- London : 85 points
- New York : 80 points
- Asia : 50 points (tends to range more)
- Off-Peak : 30 points (lower liquidity, more false signals)
The session score contributes 17% to the overall quality calculation. Signals are also filtered to prevent firing during off-peak hours.
Note : These are fixed UTC times and may not perfectly match your broker's session boundaries. Use them as general guidance rather than precise timing.
LAYER 5: VOLATILITY REGIME ADAPTATION
This answers the question: "How should I adjust for current market conditions?"
SPM compares current volatility (14-period ATR) against historical volatility (50-period ATR) to categorize the market:
HIGH Volatility (ratio above 1.3): Current ATR is 30%+ above normal. SPM widens thresholds to filter noise and extends target projections.
NORMAL Volatility (ratio 0.7 to 1.3): Typical conditions. Standard parameters apply.
LOW Volatility (ratio below 0.7): Current ATR is 30%+ below normal. SPM tightens thresholds for sensitivity and reduces target expectations. The market state may show AVOID during prolonged low volatility.
This adaptation prevents false signals during erratic markets and missed signals during quiet markets.
━━━━━━━━━━━━━━━━━━━━━━━━━━━━━━━━━━━━━━━━━━━
THE SYNERGY: WHY THIS COMBINATION MATTERS
These five layers are not independent indicators placed on one chart. They form an interconnected system:
- A signal only fires when momentum exists (Fuel above 40%), price is away from danger zones (Trap Zones factored into quality score), movement is favorable (Velocity contributes to score), timing is appropriate (Session is not off-peak), and volatility is accounted for (thresholds adapt to regime).
- The Trap Zones directly influence Entry Zone placement. Entry zones are positioned beyond trap zones to avoid getting caught in reversals.
- Target projections automatically adjust to avoid placing take-profit levels inside detected trap zones.
- The Fuel Gauge affects which signal tier fires. Insufficient fuel prevents all signals.
- Session quality is weighted into the overall score, reducing signal quality during less favorable trading hours.
This integration is the core originality of SPM. Each component makes the others more useful than they would be in isolation.
━━━━━━━━━━━━━━━━━━━━━━━━━━━━━━━━━━━━━━━━━━━
HOW THE QUALITY SCORE IS CALCULATED
The Quality Score (0-100) synthesizes all layers into a single number for each direction (long and short):
For Long Quality Score:
- Fuel Component (28% weight) : Full fuel value if impulse direction is bullish; 60% of fuel value otherwise
- Trap Avoidance (22% weight) : 75 points if no trap zone below; otherwise 100 minus the trap confluence score (minimum 20)
- Velocity Component (18% weight) : Direct velocity score
- Session Component (17% weight) : Current session quality score
- Trend Alignment (15% bonus) : Adds 12 points if price is above the 20-period SMA
For Short Quality Score:
- Same structure but reversed (bearish impulse direction, trap zone above, price below SMA)
The direction with the higher score becomes the current Bias. A 12-point difference is required to switch bias, preventing flip-flopping in neutral conditions.
━━━━━━━━━━━━━━━━━━━━━━━━━━━━━━━━━━━━━━━━━━━
SIGNAL TYPES AND WHAT THEY MEAN
SPM generates four types of signals, each with specific visual representation:
PRIME SIGNALS (Cyan Diamond)
These represent the highest quality confluence. Requirements:
- Quality score crosses above the Prime threshold (default 80)
- Bias aligns with signal direction
- Fuel is sufficient (above 40%)
- Session is active (not off-peak)
- Cooldown period has passed
Prime signals appear as cyan-colored diamond shapes. Long signals appear below the bar; short signals appear above.
STANDARD SIGNALS (Green Triangle Up / Red Triangle Down)
These represent good quality setups. Requirements:
- Quality score crosses above the Standard threshold (default 75) but below Prime
- Same bias, fuel, and cooldown requirements as Prime
Standard signals appear as small triangles in green (long) or red (short).
CAUTION SIGNALS (Small Faded Circle)
These represent minimum threshold setups. Requirements:
- Quality score crosses above the Caution threshold (default 65) but below Standard
- Same additional requirements
Caution signals appear as small, faded circles. These suggest the setup exists but with weaker confluence. Consider these only when broader market context supports them, or skip them entirely during uncertain conditions.
EXHAUSTION SIGNAL (Purple X with "EXIT" text)
This warning appears when the Fuel Gauge drops below 20% from above, indicating momentum has depleted. This is not a trade signal but a warning to:
- Consider exiting existing positions
- Avoid entering new trades in the current direction
- Wait for new momentum to develop
All signals use CONFIRMED bar data only (referencing the previous closed bar) to prevent repainting. Once a signal appears, it will never disappear or change position on historical bars.
━━━━━━━━━━━━━━━━━━━━━━━━━━━━━━━━━━━━━━━━━━━
READING THE CHART ELEMENTS
TRAP ZONES (Red Dashed Box with "TRAP XX%" Label)
These mark price levels where multiple historical swing points cluster. The red dashed box shows the zone boundaries. The percentage is the confluence score indicating cluster strength and proximity.
How to use: When price approaches a trap zone, be cautious about entering in that direction. If your bias is LONG and there's a strong trap zone above, consider taking partial profits before price reaches it or adjusting your target below it.
ENTRY ZONES (Green Solid Box with "ENTRY" Label)
These show suggested entry areas based on the current bias direction. For LONG bias, the entry zone appears below the trap zone (buying the dip beyond support). For SHORT bias, it appears above the trap zone (selling the rally beyond resistance).
How to use: Rather than entering at current price, consider placing limit orders within the entry zone. This positions you beyond where typical trap reversals occur.
TARGET ZONES (Blue Dotted Box with "TARGET" Label)
These project potential take-profit areas based on ATR multiples, adjusted for:
- Current volatility regime (wider in high volatility, tighter in low)
- Impulse direction (larger targets when aligned with impulse)
- Nearby trap zones (targets adjust to avoid placing TP inside trap zones)
How to use: These are suggestions, not guarantees. Consider taking partial profits before the target or using trailing stops once price moves favorably.
STOP LEVEL (Orange Dashed Line with "STOP" Label)
This shows suggested stop-loss placement, calculated as 0.8 ATR beyond the trap zone (or 2.0 ATR from current price if no trap zone exists).
How to use: This provides a reference for risk calculation. The dashboard R:R ratio is calculated using this stop level.
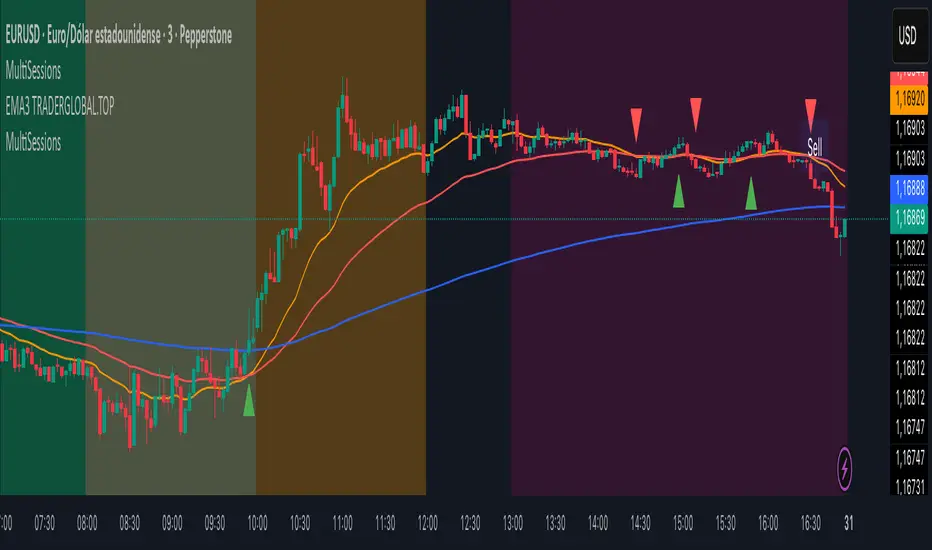
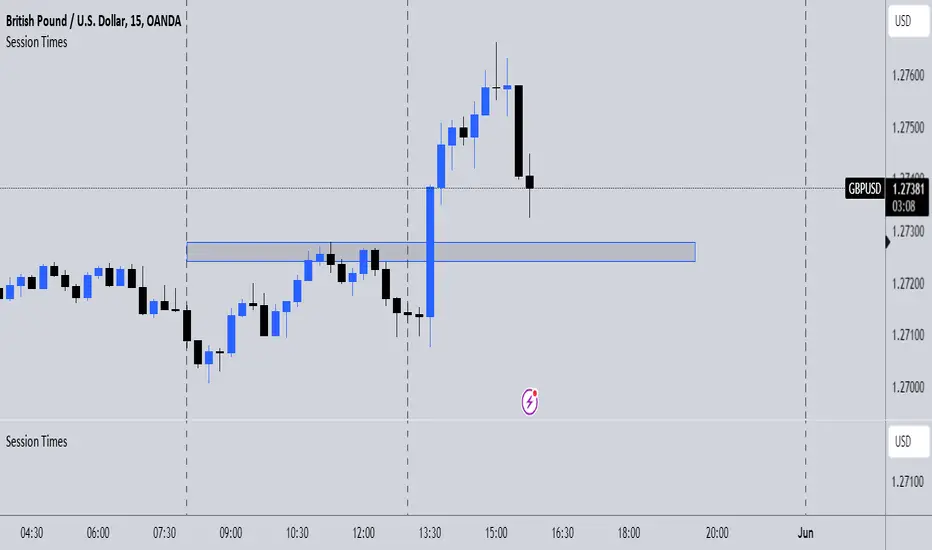
Chart Example: Scalp Precision Matrix displays real-time market analysis through dynamic zones and quality scores. ENTRY/TARGET/STOP zones show potential price levels based on current market structure - they appear continuously as reference points, NOT as trade instructions. Actual trade signals (diamonds, triangles, circles) fire only when multiple conditions align: quality score thresholds are crossed, fuel gauge is sufficient, session is active, and cooldown period has passed. The zones help you understand market context; the signals tell you when to act.
━━━━━━━━━━━━━━━━━━━━━━━━━━━━━━━━━━━━━━━━━━━
UNDERSTANDING THE DASHBOARD (Top Right Panel)
The main dashboard provides comprehensive market context:
Row 1 - Header:
- "SPM " : Indicator name
- Market State : Current overall condition
Market States Explained:
- PRIME : Excellent conditions. Quality score meets prime threshold, session is active. Best opportunities.
- READY : Good conditions. Quality score meets standard threshold. Solid setups available.
- WAIT : Mixed conditions. Some factors favorable, others not. Patience recommended.
- AVOID : Poor conditions. Off-peak session or very low volatility. High risk of false signals.
- EXIT : Fuel exhausted. Momentum depleted. Consider closing positions or waiting.
Row 2-3 - Quality Bars:
- " UP ########## " : Visual meter for long quality (each # = 10 points, . = empty)
- " DN ########## " : Visual meter for short quality
- The number on the right shows the exact quality score
Row 4 - Bias:
- Shows current directional lean: LONG, SHORT, or NEUTRAL
- Color-coded: Green for long, red for short, gray for neutral
Rows 5-7 (Full Mode Only) - Trade Levels:
- Entry : Suggested entry price for current bias direction
- Stop : Suggested stop-loss price
- Target : Projected take-profit price
Row 8 - Risk:Reward Ratio:
- Format : "1:X.X" where X.X is the reward multiple
- Color-coded : Green if 2:1 or better, amber if 1.5:1 to 2:1, red if below 1.5:1
Row 9 - Fuel:
- Shows percentage and estimated bars remaining in parentheses
- Example : "72% (8)" means 72% fuel with approximately 8 bars remaining
- Color-coded : Green above 70%, amber 40-70%, red below 40%
Row 10-11 (Full Mode Only) - Market Conditions:
- Vol : Current volatility regime (HIGH/NORMAL/LOW)
- Speed : Current velocity zone (FAST/NORMAL/SLOW)
Row 12 - Session:
- Shows active trading session
- Color-coded by session type
Row 13 (Full Mode Only) - Remaining:
- Time remaining in current session (hours and minutes)
Row 14 (Conditional) - Trap Warning:
- Appears when a significant trap zone exists in your bias direction
- Shows direction (ABOVE/BELOW) and confluence percentage
━━━━━━━━━━━━━━━━━━━━━━━━━━━━━━━━━━━━━━━━━━━
UNDERSTANDING THE QUICK PANEL (Bottom Left)
The Quick Panel provides essential information at a glance without looking away from price action:
Row 1: Current Bias and Quality Score (large text for quick reading)
Row 2: Market State
Row 3: Fuel Percentage
Row 4: Estimated Bars Remaining
Row 5: Risk:Reward Ratio
Row 6: Current Session
Both panels can be repositioned using the settings, and each can be toggled on/off independently.
━━━━━━━━━━━━━━━━━━━━━━━━━━━━━━━━━━━━━━━━━━━
SETTINGS EXPLAINED
CORE SETTINGS:
Analysis Lookback (Default: 20)
Number of bars used for statistical calculations including average volume and average body size. Higher values create smoother but slower-reacting analysis. Lower values are more responsive but may include more noise.
Swing Detection Length (Default: 5)
Bars required on each side to confirm a swing high or low. A setting of 5 means a swing high must have 5 lower highs on each side. Lower values detect more swings (more trap zones, more sensitivity). Higher values find only major pivots (fewer but more significant zones).
Impulse Sensitivity (Default: 1.5)
Multiplier for ATR when detecting impulse moves. Lower values (like 1.0) detect smaller price movements as impulses, refreshing the fuel gauge more frequently. Higher values (like 2.5) require larger moves, making impulse detection less frequent but more significant.
SIGNAL SETTINGS:
Prime/Standard/Caution Thresholds (Defaults: 80/75/65)
These control the quality score required for each signal tier. You can adjust these based on your preference:
- More conservative : Raise thresholds (e.g., 85/80/70) for fewer but higher-quality signals
- More aggressive : Lower thresholds (e.g., 75/70/60) for more signals with slightly lower quality
Signal Cooldown (Default: 8 bars)
Minimum bars between signals to prevent signal spam. After any signal fires, no new signals can appear until this many bars pass. Increase for fewer signals in choppy markets; decrease if you want faster signal refresh.
Show Prime/Standard/Caution/Exhaustion Signals
Toggle each signal type on or off based on your preference.
ZONE DISPLAY:
Show Trap Zones / Entry Zones / Target Zones / Stop Levels
Toggle each zone type on or off. Turning off zones you don't use reduces chart clutter.
Zone Transparency (Default: 88)
Controls how transparent zone boxes appear. Higher values (closer to 95) make zones barely visible; lower values (closer to 75) make them more prominent.
Zone History (Default: 25 bars)
How far back zone boxes extend on the chart. Purely visual preference.
BACKGROUND:
Background Mode (Options: Off, Subtle, Normal)
Controls whether and how intensely the chart background is colored. Subtle is barely noticeable; Normal is more visible; Off disables background coloring entirely.
Background Type (Options: Bias, Fuel)
- Bias : Colors background based on current directional lean (green for long, red for short)
- Fuel : Colors background based on momentum level (green for high fuel, amber for moderate, red for low)
DASHBOARD / QUICK PANEL:
Show Dashboard / Show Quick Panel
Toggle each panel on or off.
Compact Mode
When enabled, the main dashboard shows only essential rows (quality bars, bias, R:R, fuel, session) without entry/stop/target levels, volatility, velocity, or time remaining.
Position Settings
Choose where each panel appears on your chart from six options: Top Right, Top Left, Bottom Right, Bottom Left, Middle Right, Middle Left.
ALERTS:
Alert Prime Signals / Standard Signals / Fuel Exhaustion
Enable or disable TradingView alerts for each condition. When enabled, you can set up alerts in TradingView that will notify you when these conditions occur.
━━━━━━━━━━━━━━━━━━━━━━━━━━━━━━━━━━━━━━━━━━━
RECOMMENDED TIMEFRAMES AND USAGE
OPTIMAL TIMEFRAMES:
- 1-minute to 5-minute : Best for active scalping with quick entries and exits
- 5-minute to 15-minute : Balanced scalping with slightly more confirmation
- 15-minute to 1-hour : Short-term swing entries, fewer but more significant signals
Zone visualizations only appear on intraday timeframes to prevent chart clutter on higher timeframes.
BEST PRACTICES:
1. Trade primarily during LONDON, NEW YORK, or OVERLAP sessions. The indicator weights these sessions higher for good reason - liquidity and movement are typically better.
2. Prioritize PRIME signals. These represent the highest confluence and have proven most reliable. Use STANDARD signals as secondary opportunities. Treat CAUTION signals with extra scrutiny.
3. Respect the Fuel Gauge. Avoid entering new positions when fuel is below 40%. When the EXIT signal appears, seriously consider closing or reducing positions.
4. Pay attention to TRAP warnings. When the dashboard shows a trap zone in your bias direction, be cautious about holding through that level.
5. Verify R:R before entry. The dashboard shows the risk-to-reward ratio. Ensure it meets your minimum requirements (many traders require at least 1.5:1 or 2:1).
6. When state shows AVOID or EXIT, step back. These conditions typically produce poor results.
7. Combine with your own analysis. SPM is a decision-support tool, not a standalone system. Use it alongside your understanding of market structure, news events, and overall context.
━━━━━━━━━━━━━━━━━━━━━━━━━━━━━━━━━━━━━━━━━━━
PRACTICAL EXAMPLE
Scenario : You're watching a 5-minute chart during London session. A cyan diamond (Prime Long signal) appears below the bar.
Before entering, you check the dashboard:
- State shows "PRIME" - conditions are favorable
- Fuel shows "72% (8)" - plenty of momentum remaining (approximately 8 bars)
- R:R shows "1:2.3" - acceptable risk-to-reward ratio
- Session shows "LONDON" - active session with good liquidity
- No TRAP warning in dashboard - no immediate resistance cluster in your way
- Entry zone visible on chart at a lower price level
- Stop and Target zones clearly marked
With this confluence of factors, you have context for a more informed decision. The signal indicates quality, the fuel suggests momentum remains, the R:R is favorable, and no immediate trap threatens your trade.
However, you also notice the target zone sits just below where a trap zone would be if there were one. This is by design - SPM adjusts targets to avoid placing them inside reversal zones.
This multi-factor confirmation delivered in a single glance is what SPM provides.
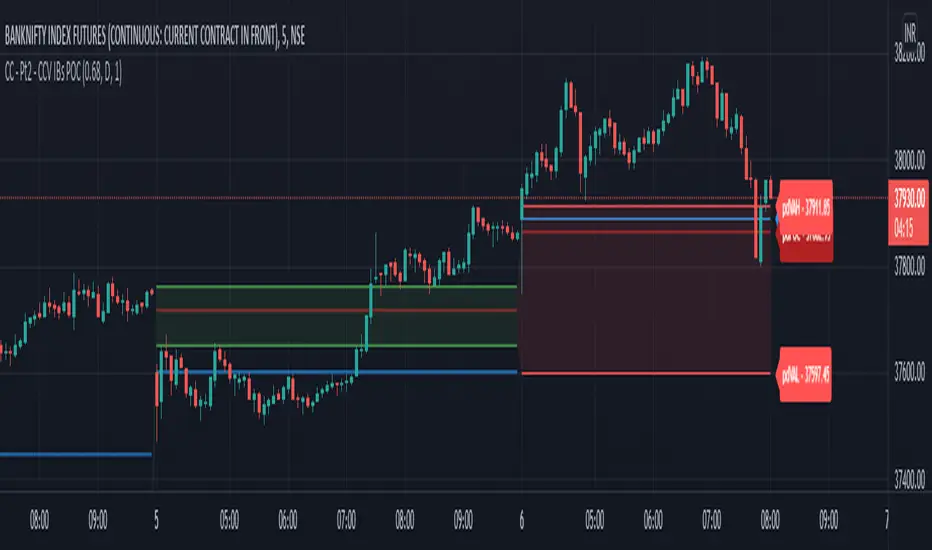
Chart Example :This chart demonstrates how the Scalp Precision Matrix identifies key market transitions. After a strong bullish impulse (cyan PRIME signal at ~08:30), price reached a historical reversal cluster (TRAP ZONE at 92,300). The indicator detected momentum exhaustion (purple EXIT signal) as fuel dropped below 20%, warning traders to exit longs. Now showing a SHORT bias with entry/stop/target zones clearly marked. The 92% trap zone confluence indicates a strong cluster of previous swing highs where price historically reversed.
━━━━━━━━━━━━━━━━━━━━━━━━━━━━━━━━━━━━━━━━━━━
DATA WINDOW VALUES
For detailed analysis and strategy development, SPM exports the following values to TradingView's Data Window (visible when you hover over the chart with the indicator selected):
- Long Quality Score (0-100)
- Short Quality Score (0-100)
- Fuel Gauge (0-100%)
- Risk:Reward Ratio
These values can be useful for understanding how the indicator behaves over time and for developing your own insights about when it works best for your trading style.
━━━━━━━━━━━━━━━━━━━━━━━━━━━━━━━━━━━━━━━━━━━
NON-REPAINTING CONFIRMATION
All signals in SPM are generated using CONFIRMED bar data only. The signal logic references the previous closed bar's values ( and in Pine Script terms). This means:
- Signals appear at the OPEN of the new bar (after the previous bar closes)
- Signals will NEVER disappear once they appear
- Signals will NEVER change position on historical bars
- What you see in backtesting is what you would have seen in real-time
The dashboard and zones update in real-time to provide current market context, but the trading signals themselves are non-repainting.
━━━━━━━━━━━━━━━━━━━━━━━━━━━━━━━━━━━━━━━━━━━
IMPORTANT DISCLAIMERS
TERMINOLOGY CLARIFICATION:
This indicator uses terms that might imply access to data it does not have. To be completely transparent:
- "Trap Zones" are calculated from historical swing point clustering. They are NOT institutional liquidity pools, order blocks, smart money footprints, or any form of order flow data. The term "trap" is metaphorical, describing how price has historically reversed at these levels.
- "Fuel Gauge" is a technical momentum proxy. It is NOT order flow, volume profile, depth of market, or bid/ask data. It estimates momentum remaining based entirely on standard OHLCV price and volume data.
- "Quality Scores" are weighted combinations of the technical factors described above. A high score indicates multiple conditions align favorably according to the indicator's logic. It does NOT predict or guarantee trade success.
- The percentages shown on trap zones are CONFLUENCE SCORES measuring cluster density and proximity. They are NOT probability predictions of reversal.
TRADING RISK WARNING:
Trading involves substantial risk of loss and is not suitable for all investors. This indicator is a technical analysis tool designed to assist with decision-making. It does not constitute financial advice, trading advice, or any other sort of advice. Past performance of any signal or pattern does not guarantee future results. Markets are inherently unpredictable.
Always use proper risk management. Define your risk before entering any trade. Never risk more than you can afford to lose. Consider consulting with a licensed financial advisor before making trading decisions.
━━━━━━━━━━━━━━━━━━━━━━━━━━━━━━━━━━━━━━━━━━━
ORIGINALITY STATEMENT - NOT A MASHUP
Scalp Precision Matrix is an original work that combines several analytical concepts into a purpose-built scalping framework. While individual components like ATR calculations, pivot detection, session timing, and trend alignment exist in various forms elsewhere, the specific implementation here represents original synthesis:
- The Fuel Gauge decay model with its four-component weighted calculation
- The Trap Zone cluster detection with confluence scoring
- The multi-factor quality scoring system that integrates all layers
- The trap-aware entry and target zone placement logic
- The volatility regime adaptation across all components
- The session weighting is integrated into the quality assessment
The indicator does not simply overlay separate indicators on one chart. It creates interconnected layers where each component informs and adjusts the others. This integration is the core originality of SPM.
━━━━━━━━━━━━━━━━━━━━━━━━━━━━━━━━━━━━━━━━━━━
For best results, combine SPM with your own market understanding and always practice proper risk management.
-BullByte
อินดิเคเตอร์ Pine Script®