Session Standard Deviations [IbnHindi]Session Standard Deviation⁺
Introduction
Session Standard Deviation⁺ is a comprehensive technical analysis tool designed to map key session-based price levels through Fibonacci deviation zones while simultaneously tracking real-time market regime conditions. Built for precision intraday analysis, this indicator combines structured session reference points with volatility-based regime filtering to provide traders with both tactical price zones and macro bias context across any liquid instrument.
This indicator does not predict direction or generate trade signals. It operates on confirmed time-based session structures and produces logic-bound visuals designed for traders who understand ICT-based price delivery models and seek consistent visual frameworks for tracking displacement, deviation targeting, and regime-aware decision making.
Key Terms and Definitions
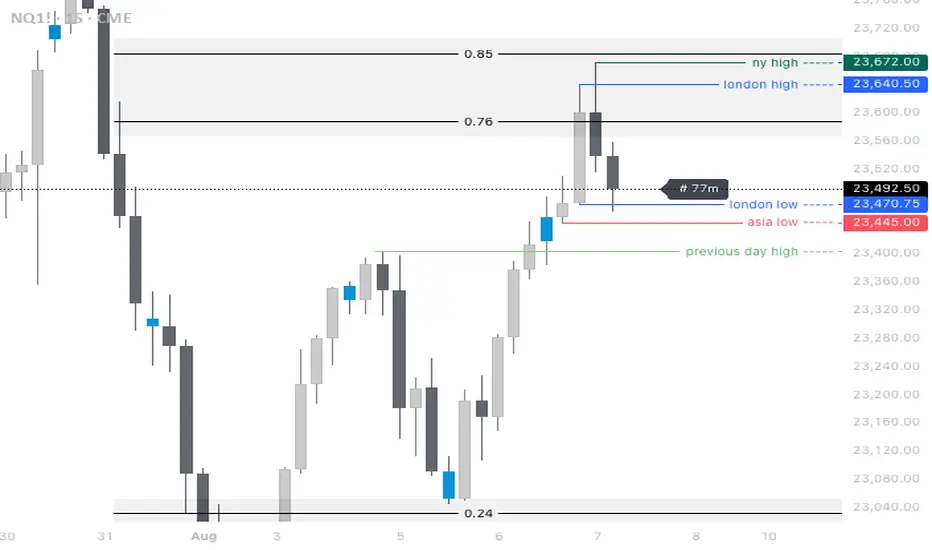
Session Reference Candle : A specific time-stamped candle that serves as the structural anchor for Fibonacci projections. The tool recognizes four distinct session markers: London Open (4:00 AM), Asia Range (8:00 PM–12:00 AM), New York 8:30 AM, and New York 9:30 AM. Each session's high and low become the baseline for calculating all subsequent deviation levels.
Fibonacci Deviations : Price levels calculated as multiples of the session range, extending both above and beyond the reference high and low. Unlike traditional Fibonacci retracements, these deviations project targets at standard levels (0, 0.5, 0.618, 1, 1.618) as well as extended levels (2, 2.25, 2.5, 3, 3.25, 3.5, 4, 4.25, 4.5, 4.618), and their negative equivalents. These zones represent potential areas where institutional orders may cluster during expansion or retracement.
Regime Analysis : A multi-factor assessment of current market conditions based on volatility (ATR), directional bias (EMA), and trend strength (ADX). The regime framework categorizes the market into three states: trending bullish, trending bearish, or consolidating. This classification helps traders contextualize whether session-based deviations are likely to act as continuation targets or reversal zones.
ATR (Average True Range) : A volatility measurement comparing fast and slow periods to determine whether the market is expanding (regime-high volatility) or contracting (regime-low volatility). When fast ATR exceeds slow ATR, the market is considered to be in an elevated volatility state, which often accompanies displacement moves that respect deviation levels.
Trend EMA : A directional filter using an exponential moving average to determine whether price is trading above or below a defined trend anchor. This binary condition helps classify whether the regime is structurally bullish or bearish.
ADX (Average Directional Index) : A momentum oscillator measuring trend strength. When ADX is above 25, the market is considered to have sufficient momentum to support regime classification as trending. Below 25 suggests choppy or non-directional conditions (consolidation).
Session Box (Asia Only) : A visual range overlay drawn for the Asia session (8:00 PM–12:00 AM), highlighting the consolidation zone that often precedes major market expansion. This box is rendered with customizable opacity and provides a structural reference for overnight price action.
Fib Extension Mode : Determines how deviation lines project forward in time. Options include extending right indefinitely, extending a fixed number of bars, or stopping at the session reference point. This allows traders to declutter charts or maintain persistent levels based on their analytical preference.
Description
At its core, Session Standard Deviation⁺ operates on a two-layer framework: structural deviation mapping and dynamic regime classification. Each qualifying session creates a full matrix of Fibonacci-based price levels, calculated from the session's confirmed high and low. These levels remain active and extend forward until the next session triggers, providing persistent reference zones for intraday price delivery.
The tool does not account for partial moves or wick-based touches. Deviation levels are drawn as horizontal lines and remain static once plotted. Labels are positioned to the left of each line by default, displaying the session prefix (LON, ASIA, PRE, NYAM) alongside the deviation multiplier. All labels use a minimal style with no background fill, ensuring clean visual hierarchy.
The regime analysis operates independently and updates in real-time on each new bar. A table positioned in the top-right corner displays the current regime classification, live ATR value, and optional ADX strength. The table's background color shifts dynamically—green for bullish regimes, red for bearish regimes, and gray for consolidation—allowing traders to immediately assess whether session deviation zones should be interpreted as continuation targets or reversal areas.
The model remains active until the next session reference candle is detected, at which point a new set of deviation levels is generated. Older session levels are automatically cleaned up after 300 objects to prevent performance degradation on lower-timeframe charts.
Key Features
Multi-Session Structure : Track up to four distinct session types simultaneously—London (4:00 AM 1H candle), Asia (8:00 PM–12:00 AM range), New York 8:30 AM (5m candle), and New York 9:30 AM (5m candle). Each session generates its own color-coded deviation matrix, allowing traders to differentiate between overnight, pre-market, and intraday structural levels.
Extended Fibonacci Levels : The tool plots 26 unique deviation levels, including both standard and extended targets. Positive deviations (0 through 4.618) project above the session high, while negative deviations project below the session low. Each level can be toggled individually, enabling traders to focus only on the zones relevant to their strategy.
Real-Time Regime Classification : A live regime panel evaluates market conditions using ATR comparison (fast vs. slow), trend EMA positioning, and ADX strength. The regime updates on every bar and displays one of three states: "Reversal to Bullish" (trending up with high volatility), "Bias: Bearish (Hi-Vol)" (trending down with high volatility), or "Consolidating" (low directional conviction). This dynamic classification allows traders to interpret session fibs contextually rather than mechanically.
Customizable Color Coding : Each session type is assigned a unique color—purple for London, blue for Asia, and orange for New York pre-market candles. These colors carry through to both the deviation lines and their labels, maintaining visual consistency across timeframes and chart layouts.
Flexible Extension Controls : Choose how deviation lines project into the future. "Right N Bars" extends lines a fixed number of bars forward (default 50), "Right" extends indefinitely, and "None" stops extension at the session reference point. This flexibility allows traders to maintain clean charts on busy intraday timeframes while preserving structural context.
Minimal Label Design : Labels display session prefix and deviation multiplier (e.g., "LON 2.5" or "NYAM -0.618") with no background fill. Label placement can be toggled between left and right alignment, and padding is customizable to prevent overlap with price action.
Session-Specific Box Overlay : The Asia session (8:00 PM–12:00 AM) is rendered as a semi-transparent box spanning its high and low range. This visual aid helps traders identify the overnight consolidation zone and anticipate expansion moves during London or New York open.
Timezone Awareness : All session detections are timezone-aware and default to America/New_York. Traders can customize the timezone input to align with their broker's server time or preferred regional standard.
Regime Panel Display : The top-right table shows the indicator name, current regime state, live ATR value, and optional ADX reading. The panel's background color shifts with regime changes, providing instant visual feedback without requiring interpretation of numeric values.
Memory Management : The tool automatically deletes lines and labels after 300 objects are created, preventing performance issues on lower timeframes while maintaining enough historical context for multi-session analysis.
How Traders Can Use the Indicator Effectively
Session Standard Deviation⁺ is not a signal generator or automated trading system. It is best used as a visual reference framework for understanding where price may seek liquidity based on session expansion logic and how current volatility conditions contextualize those projections. The tool excels as a companion for:
- Mapping session-based expansion targets and retracement zones for ICT-style price delivery analysis
- Differentiating between low-probability and high-probability deviation zones based on regime classification
- Journaling and reviewing which session structures produce the cleanest reactions across different market conditions
- Identifying when price is respecting session fibs as continuation levels (trending regime) versus when deviation zones may act as exhaustion points (consolidation regime)
Traders using the tool should be familiar with session-based analysis, Fibonacci extension logic, and the role of volatility in price delivery. The indicator is most effective when combined with narrative, higher-timeframe structure, and discretionary interpretation of regime shifts.
Usage Guidance
1. Add Session Standard Deviation⁺ to any TradingView chart. This is a fractal tool and can be applied across any timeframe or liquid instrument.
2. Configure which sessions you want to track using the input toggles. Disable sessions that are not relevant to your trading hours or strategy.
3. Use the regime panel to assess whether the current market environment supports continuation into higher deviation levels (trending regime) or whether deviation zones are more likely to act as reversal points (consolidation regime).
4. Reference session deviation lines as structural zones for limit orders, stop placement, or target setting. Combine these levels with your own narrative and higher-timeframe bias to determine which zones carry the highest probability of reaction.
5. Adjust label placement, line width, and extension mode to match your visual preferences and chart timeframe. Lower timeframes (1m–5m) often benefit from shorter extension lengths, while higher timeframes (15m–1H) may prefer persistent lines.
6. Review how price interacts with session fibs across different regime classifications. Over time, you'll develop discretion for which deviation levels are most respected during specific market conditions.
Session Standard Deviation⁺ provides the structural scaffolding and environmental context for informed intraday decision-making. Use it as a lens—not a crutch—for navigating session-based price delivery.
ค้นหาในสคริปต์สำหรับ "session"

Sessions by nolimitCustom Trading Sessions Indicator (6 Sessions)
This indicator allows you to display up to 6 customizable trading sessions on your chart with full control over timing, colors, and timezone settings.
Features:
- 6 independent trading sessions that can be enabled/disabled individually
- Flexible time range settings for each session
- Individual color selection for each session background
- Timezone selection (UTC-12 to UTC+12) that applies to all sessions
- Clean, organized settings grouped by session

Session Color Blocks🧠 Purpose:
To visually highlight different market sessions — Asia, London, Premarket (US), and New York — using colored background blocks on the chart for better timing, context, and trade planning.
🕓 Session Times Used (Eastern Time / New York Time):
Session Time (ET) Color
Asia 8:00 PM – 3:00 AM 🟨 Yellow
London 3:00 AM – 8:30 AM 🟥 Red
Premarket 8:30 AM – 9:30 AM 🟦 Blue
New York 9:30 AM – 4:00 PM 🟩 Green
(DST is automatically handled via "America/New_York" timezone)
✅ Features:
Session colors appear only when that session is active.
Sessions are mutually exclusive, so no overlapping blocks.
Works on any symbol, especially useful for US stock/futures traders.
Auto-adjusts for daylight savings (using TradingView's IANA timezones).
🔧 Future Enhancements (Optional):
Toggle each session on/off
Add vertical lines or labels for session opens
Extend to weekends or custom sessions

Sessions + Daily Quarters by (Pecurtoo)Killzones Background (UTC+1):
Highlights the main Forex and global market sessions with configurable background colors.
Sessions included:
Asian Session
London Session
New York AM Session
New York PM Session
Each session can be individually enabled or disabled.
Background colors are customizable.
Daily Quarters (Vertical Lines):
Divides the day into four quarters with vertical lines at configurable hours.
Each quarter’s line color, style (solid, dashed, dotted), and width can be customized.
Hour offsets can be applied for timezone adjustments.
Perfect for visualizing intraday market structure and timing.
Master Switches:
Enable or disable Killzones background and Daily Quarters lines globally.
Fully Compatible:
Written in Pine Script v6, fully compatible with TradingView.
Works on all timeframes.

Session Dominator — Asia • London • New York Precision ZonesRule the global market sessions.
Session Dominator is a precision-engineered indicator built for traders who want total clarity across Asia, London, and New York sessions.
It automatically plots:
🔷 Dynamic Session Boxes — visually map institutional killzones in real time
⚙️ Session Mean Line — track equilibrium and liquidity shifts
📊 EMA-50 Confluence — align directional bias and intraday trend
🎯 BSL / SSL Levels — reveal active liquidity sweeps and reversals
💡 Bias Engine — evaluates structure and locks the session bias automatically
Toggle between Asia / London / New York / Overlap / Custom modes to dominate any timezone.
Designed with minimalist visuals, high precision, and ICT-based logic — this tool helps you anticipate where liquidity will be taken before it happens.
✳️ For XAUUSD traders, scalpers, and ICT-style analysts seeking sniper-level clarity.

Session Range Breakouts With Targets [AlgoAlpha]⛓️💥Session Range Breakouts With Targets 🚀
Introducing the "Session Range Breakouts With Targets" indicator by AlgoAlpha, a powerful tool for traders to capitalize on session-based range breakouts and identify precise target zones using ATR-based calculations! Whether you trade the Asian, American, European, or Oceanic sessions, this script highlights key breakout levels and targets that adapt to market volatility, ensuring you're always prepared for those crucial price movements. 🕒📊
Session-based Trading : The indicator highlights session-specific ranges, offering clear breakouts for Asian, American, European, Oceanic, and even custom sessions 🌍.
Adaptive Volatility Zones : Uses ATR to determine dynamic zone widths, filtering out fakeouts and adjusting to market conditions ⚡.
Precise Take-Profit Targets : Set multiple levels of take-profits based on ATR multipliers, ensuring you can manage both aggressive and conservative trades 🎯.
Customizable Appearance : Tailor the look with customizable colors for session highlights and breakout zones to fit your chart style 🎨.
Alerts on Key Events : Built-in alert conditions for breakouts and take-profit hits, so you never miss a trading opportunity 🔔.
🚀 Quick Guide to Using the Indicator
🛠 Add the Indicator : Add the indicator to favorites by pressing the star icon. Choose your session (Asia, America, Europe, Oceana, or Custom) and adjust the ATR length, zone width multiplier, and target multipliers to suit your strategy.
📊 Analyze Breakouts : Watch for the indicator to plot upper and lower range boxes based on session highs and lows. Price breaking through these boxes will signal a potential entry.
📈 Monitor Targets : Track bullish and bearish targets as price moves, with up to three take-profit levels based on ATR multipliers.
🔔 Set Alerts : Enable alerts for session breakouts or when price hits your designated take-profit targets.
🔍 How It Works
This script operates by identifying session-specific ranges based on highs and lows from the beginning of the selected session (Asia, America, Europe, or others). After a user-defined wait period (default: 120 bars), it calculates the highest and lowest points and creates upper and lower zones using the Average True Range (ATR) to adapt to market volatility. If the price breaks above or below these zones, it is identified as a breakout, and the script dynamically calculates up to three take-profit targets for both bullish and bearish scenarios using an ATR multiplier. The indicator also includes alerts for breakouts and take-profit hits, providing real-time trading signals.

Session/Day VWAP & Std Dev Bands/VWAP and Standard Deviation Bands for intra-day & Day sessions
/Intra-day sessions be default are set to crypto
- Asia session
- London Session
- New York Session
- Close Session
Day broken up into sessions as a 24 hour period consists of different market participants and therefore different behaviour.

Session Volume Profile [KTY] Session Volume Profile
Hi, I'm Kim Thank You 👋
KTY = Kim Thank You (김땡큐)
Analyzes volume by price level for selected periods (Daily/Weekly/Monthly/Quarterly/Yearly) and displays the volume profile.
━━━━━━━━━━━━━━━━━━━━━━━━━━━━━━━
📊 FEATURES
- Volume Profile Analysis
- Breaks down volume by price zones
- Separates bullish (green) and bearish (red) volume
- POC (Point of Control)
- Red line showing highest volume price level
- Key support/resistance zone
- HVN (High Volume Node)
- Top 20% volume zones displayed darker
- Areas where price may consolidate
- Session Box
- Displays price range for each session
- Session label shows period type
━━━━━━━━━━━━━━━━━━━━━━━━━━━━━━━
✅ HOW TO USE
- Watch for strong S/R reactions near POC
- High volume zones → possible consolidation
- Low volume zones → rapid price movement likely
- Confluence with other levels increases reliability
━━━━━━━━━━━━━━━━━━━━━━━━━━━━━━━
💡 TIPS
- Choose session type based on your trading timeframe
- Lower timeframes work better with shorter sessions
- Higher timeframes work better with longer sessions
- Combine with other S/R tools for confirmation
━━━━━━━━━━━━━━━━━━━━━━━━━━━━━━━
⚠️ DISCLAIMER
This indicator is for educational purposes only.
Not financial advice. Always do your own research.

Session Sniper Bands — Pro Overlay (Bollinger, Sessions, Engulf)The Session Sniper Bands — Pro Overlay combines three powerful tools into one clean, professional script designed to help traders spot high-probability setups across any market.
📌 What’s included:
Dual Bollinger Bands → track volatility squeezes, expansions, and mean reversion zones.
Customizable Trading Sessions (Tokyo / London / New York) → shaded regions with editable names, open/close lines, range, and average price markers.
Engulfing Candlestick Signals → automatic bullish and bearish engulfing arrows for precision entry timing.
✨ Features:
Session names and times are fully customizable (rename “Tokyo” to “Asia Open,” etc.).
Clear OB/OS volatility cues via Bollinger stack.
Lightweight visuals that won’t clutter your chart.
Works across Forex, Crypto, Indices, and Binary Options.
⚡ Why use it?
This overlay is built for traders who want to snipe entries with session context. Spot when volatility contracts, align with session flows, and confirm with engulfing momentum candles — all in one view.
⚠️ Disclaimer: This script is for educational purposes only and is not financial advice. Always test on demo before trading live.
Sessions & Key LevelsAn indicator made to show:
- Session Open & Close Breaks
- Session Ranges/Outline (Lower transparency % in settings to show)
Session times are editable in settings.
- Session High's & Low's
- H1 High's & Low's
These are aligned with the Session Open & Close times. (Takes the H/L between the input times)
Lines will fade once price touches & will be deleted once the current session ends.
User can edit H1 pivot strength in settings.
- Session Activity Dashboard
Used to show which sessions are currently active. (Toggled off by default)
Session High/Low Sweeps ICT — Asian/London/NY (Big Sal Trades)Description:
This tool automatically tracks session or timeframe highs and lows, plots them on your chart, and removes them instantly when price sweeps or touches them — so you never deal with stale levels again.
⸻
Core Features
• Dynamic High/Low Plotting – Color-coded lines for multiple sessions or timeframes.
• Touch-to-Delete – Levels are deleted automatically when price touches or breaks them.
• Lookback Pruning – Remove old levels after a set number of bars/days.
• Multi-Timeframe Support – Works on intraday and higher timeframes.
• Custom Sensitivity – Choose tick buffer, wick vs close confirmation, and session types.
• No Repainting – Updates in real time, keeps your chart accurate.
⸻
Settings Instructions
Session Selection
• Toggle Asia, London, NY or other sessions you want to track.
Delete on Touch Settings
• Confirm Type:
• Wick – Delete as soon as price wick touches/breaks the level.
• Close – Delete only if candle closes beyond the level.
• Confirm Ticks:
• 0 – Instant deletion on touch.
• 1–2+ – Require price to exceed by this many ticks before deletion.
Lookback Settings
• Max Days/Bars: Remove levels older than this period.
Line Style Settings
• Customize color, style, and width for each session/timeframe to keep charts organized.
⸻
Tip:
Use a small tick confirmation for fast-moving markets like NASDAQ, and larger confirmation for slower assets. Combine with liquidity zones, order blocks, or SMC concepts for powerful trade confluence.
Session Candles NY #ffsjr"The candle bodies tell the story, wicks do the damage" by ICT
Based on ICT words, I created the sessions indicator, to facilitate the visualization of each session in candle format, with the most important points being the confluence of session openings and closings.
Usually I use to create support and resistances lines using candle sessions bodies and to draw sessions liquidities.
Use on 15 minutes chart and hide default TradingView candles.
Enjoy
Session Averages: Open, High, LowThis indicator allows for the user to specify an intraday time based range and calculate the average open price, average high price, and average low price for that session. The indicator plots the 5 most recent sessions on the chart, which allows for the user to identify fair value, Power of 3 movements, trends, and consolidations.
If bullish the user can identify when price is below the average open or low price of a range, and if bearish can identify when price is above the open or high of a range.

Session Ranges by CeleSimple indicator that shows the various daily sessions and includes a pip counter for every different session.

Sessions and Market Structure Highs and LowsThis Indicator has the purpose that traders can see the opening of the different sessions on the chart in a clean and visually pleasing way .
By a dding the script to your chart , vertical lines will automatically appear at the specific opening hours of each session
What schedules are used by the Script?
The New York session starts at 07:30 GMT and its line will be represented by the color Orange
Then for the London session the start is plotted at 03:30 GMT with the Gray line
And finally the Asia/Tokyo session at 19:00 GMT with its Blue color line
Keep in mind that the style of the line can be modified from the indicator settings , by the way in case you do not want to see the main letter of each session on the chart, you can also deactivate it from the settings
Also, in a very entertaining way, you will be able to see the Highs and Lows of the corresponding temporalities.
Sessions RangesAn indicator that displays each trading session. Each box represents a single session (Asian, London and NY) and their respective overlaps.

Session Range Boxes(MTF)📦 Indicator Name
Session Range Boxes (MTF)
Multi-Timeframe Directional Session Range Visualization
📘 Description
Session Range Boxes (MTF) is a multi-timeframe market structure tool that visually highlights price range behavior across different time sessions using clean, directional range boxes.
Each box represents the High–Low range of a completed or live session, automatically colored based on directional bias:
🟢 Bullish → Session Close > Session Open
🔴 Bearish → Session Close < Session Open
⚪ Neutral → Session Close = Session Open
This allows traders to instantly identify trend strength, balance zones, volatility expansion, and key support/resistance areas across multiple timeframes — all on a single chart.
🔍 What This Indicator Shows
For every enabled timeframe, the indicator:
Draws a range box from session open to session close
Continuously updates live session High & Low
Locks the final color once the session completes
Keeps historical boxes for structure and context
Supported timeframes:
Quarterly
Half-Yearly
Yearly
Monthly
Weekly
Daily
Hourly
30-Minute
15-Minute
5-Minute
⚙️ Default Behavior
By default, the indicator enables:
Weekly
Daily
Hourly
This default setup is intentionally chosen to suit most traders and provides:
Higher-timeframe structure (Weekly)
Swing context (Daily)
Intraday execution levels (Hourly)
🧠 How to Use It Effectively
📈 Higher-Timeframe Analysis (Swing / Positional Trading)
Recommended combinations:
Weekly + Daily
Monthly + Weekly
Use cases:
Identify dominant market bias
Spot compression vs expansion
Define higher-timeframe support & resistance zones
⚡ Intraday Trading (Day Trading)
Recommended combinations:
Daily + Hourly
Hourly + 30-Minute
Use cases:
Track intraday range development
Identify directional day types
Trade breakouts, rejections, or mean-reversion within session ranges
🚀 Scalping & Precision Entries
Recommended combinations:
Hourly + 15-Minute
30-Minute + 5-Minute
Use cases:
Fine-tune entries within larger session ranges
Align lower-timeframe trades with higher-timeframe bias
Spot micro range expansion and contraction
🎨 Customization Options
Bullish / Bearish / Neutral colors
Box fill transparency
Border transparency & color
Maximum historical boxes per timeframe
This allows you to keep charts clean, lightweight, and performance-friendly.
💡 Best Practices
Avoid enabling too many timeframes at once — clarity beats clutter
Use higher-timeframe boxes for bias, lower-timeframe boxes for entries
Combine with:
Market structure
Volume
VWAP
Liquidity concepts
Price action confirmation
Session Range Boxes (MTF) is a clean, powerful visual tool designed to help traders:
Understand session-based price behavior
Align trades across timeframes
Improve structure awareness without clutter
Whether you are a scalper, day trader, or swing trader, this indicator adapts seamlessly to your workflow.

Sessions CET Asia, London, New YorkThis indicator displays the Asia, London, and New York trading sessions in CET time.
Each session is shown with a background highlight and optional labels, making it easy to visualize global market activity and session overlaps.
Useful for intraday traders, breakout strategies, liquidity analysis, and volume-based setups.
Features:
Correct session times adjusted to CET
Visual background zones for Asia, London, New York
Clean layout, minimal visual noise
Supports any timeframe
Helps identify volatility peaks, session opens, and market structure shifts

Sessions Indicator(clean))🔰 True Day Open + Asian / London / NY Session Levels
Intraday Market Structure & Session Liquidity Indicator
This indicator automatically plots the True Day Opening Price, Asian Session High & Low, London Session High & Low, and New York Session Open — helping you understand daily directional bias, session liquidity zones, and potential reversal levels.
📌 What It Does
✔ Plots True Day Open (not broker-based — captures real market direction)
✔ Marks Asia Session High & Low – accumulation zone
✔ Marks London Session High & Low – expansion zone
✔ Shows New York Session Open – reversal / continuation zone
✔ Works on any chart: Forex, Indices, Crypto, Commodities
✔ Ideal for ICT / SMC / Day Trading / Scalping
✔ Fully customizable colors & display options
🧠 Why It’s Useful
The market often moves in this sequence:
➡ Asia → consolidation
➡ London → expansion / breakout
➡ New York → reversal OR continuation
This indicator helps you see this structure clearly, allowing traders to:
Avoid fake breakouts
Understand the daily bias earlier
Trade liquidity grabs & session-to-session transitions
Time entries with precision
📌 Best Timeframes
M5 / M15 / M30 → Scalping & intraday setups
H1 / H4 → Market structure view
Daily → Session zone backtesting
⚙ Inputs & Customization
Enable/Disable each session
Change session time manually
Color settings
Line styles: solid / dashed / background zones
🧠 Suggested Trading Concepts
Works great with:
Smart Money Concepts (SMC)
ICT Models
Liquidity Sweep Strategy
Session Breakout Trading
Mean Reversion Trading
📈 How to Use
Wait for Asian Range
Trade break of Asian High/Low during London
At NY Open, check for reversal or continuation
Use True Day Open for directional bias
Look for liquidity sweeps near session levels
📢 Coming Soon (Next Update)
🔔 Session Break Alerts
📊 Liquidity Sweep Labels

Sessions with timeframe filter🕒 Smart Timeframe Filtering
This session indicator includes an automatic filter that disables all session boxes when the chart timeframe is greater than the user-defined input. This helps keep higher-timeframe charts clean and focused by hiding intraday sessions when they’re no longer relevant — especially helpful for multi-timeframe traders.
🔍 Features:
📦 Draws up to 3 customizable session boxes with dynamic high/low tracking.
⏱️ Auto-disables on higher timeframes (Smart Timeframe Filter).
🌍 Fully customizable session times, box colors, and time zone (GMT-based).
⚡ Optimized for performance using lightweight, non-overlapping box logic.
👨🍳 UI is organized like a chef’s kitchen: clean, intuitive, and easy to navigate. Settings are grouped and filtered to avoid clutter.
✅ Best Use:
This indicator is most useful for intraday traders on 1m–15m charts.
It’s designed to keep your workspace clean on 30m+ charts or whatever threshold you define.

Session ColorWith this indicator you can see :
The active zone in the market.
The dead zone in the market.
The purpose of this indicator is to trade the active zone.
