Sessions Forex - DDsessions by dadahgkgkjhghkgiygjhg luu g ig ig o ououuuuuuuuo yohugigouh oi ohgyfkjhou fyhfgomujgiyf lkhgb omilkhbihgbuighb oulkh bmigiug m ou kg oiugmougiyfgomlhgomugo
ค้นหาในสคริปต์สำหรับ "session"

Session Vertical Lines – WIB (Consistent)Session Line by farisradifana
Give the Session on Indonesian Time :
Asian Session : 6 A.M
London Session : 2 P.M
New York Session : 7 P.M

Session Time Milestones Highlight & AlertSession Time Milestones Highlight & Alert
This script allows you to track and highlight specific trading session milestones on your chart with customizable times, all set in GMT+7. It provides visual cues and alerts for key market events like Tokyo Open, Shanghai Open, Asia Lunch Time, London Open, London Lunch Time, and New York Open.
Features:
Customizable Time Milestones: Adjust the times for each session directly from the settings.
Candle Highlights: The script highlights the candles at your chosen session times for quick visual identification.
Alerts: Set alerts to be notified when each session starts.
Labels: Optionally display simple labels on the chart above the candles for each milestone, with easy toggles to turn them on or off.
Note: All times are in GMT+7.

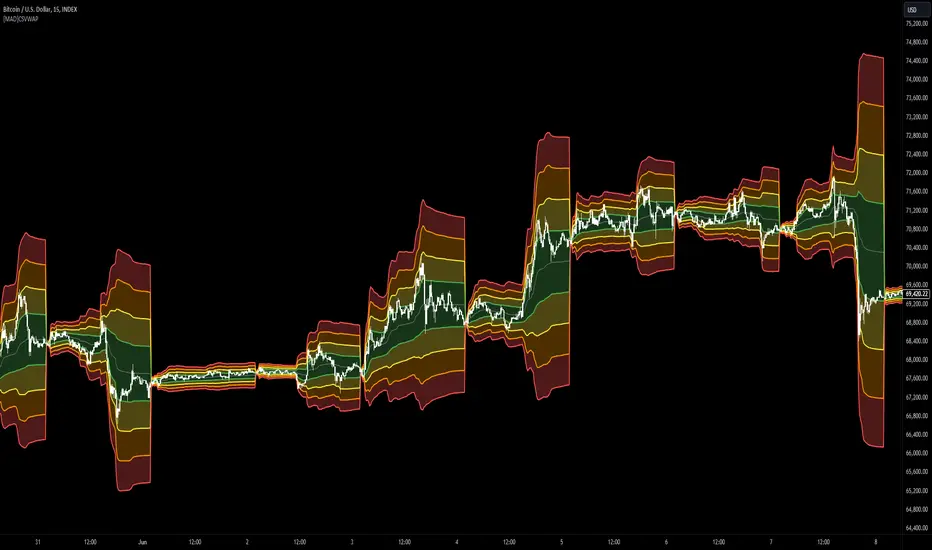
[MAD] Custom Session VWAP BandsOverview
This indicator helps visualize the Volume Weighted Average Price (VWAP) and its associated standard deviation bands over specified time periods, providing traders with a clear understanding of price trends, volatility, and potential support/resistance levels.
Inputs
Deviation
StDev mult 1: Multiplier for the first standard deviation band (Default: 1.0)
StDev mult 2: Multiplier for the second standard deviation band (Default: 2.0)
StDev mult 3: Multiplier for the third standard deviation band (Default: 3.0)
StDev mult 4: Multiplier for the fourth standard deviation band (Default: 4.0)
Line width: Width of the lines for the bands (Default: 2)
Custom Vwap session reset settings
Many different options are considered when a session is going to be reset.
Plot and Fill Options
Enable Fills: Enable/disable filling between bands.
Plot +4: Enable/disable plotting the +4 standard deviation band.
Plot +3: Enable/disable plotting the +3 standard deviation band.
Plot +2: Enable/disable plotting the +2 standard deviation band.
Plot +1: Enable/disable plotting the +1 standard deviation band.
Plot VWAP: Enable/disable plotting the VWAP line.
Plot -1: Enable/disable plotting the -1 standard deviation band.
Plot -2: Enable/disable plotting the -2 standard deviation band.
Plot -3: Enable/disable plotting the -3 standard deviation band.
Plot -4: Enable/disable plotting the -4 standard deviation band.
How to Use the Indicator
Adding the Indicator
Add the indicator to your chart through your trading platform's indicator menu.
Configuring the VWAP Reset
Specify reset intervals based on time, days of the week, or specific dates.
Adjust the time zone if necessary.
Customizing Standard Deviation Bands
Set the multipliers for the standard deviation bands.
Choose line width for better visualization.
Enabling Plots and Fills
Select which bands to display.
Enable or disable fills between the bands.
Practical Application of VWAP Bands
Understanding VWAP
VWAP is a trading benchmark that calculates the average price a security has traded at throughout the day based on volume and price. It is primarily used for intraday trading but can also offer insights during end-of-day reviews.
Using VWAP for Trading
Intraday Trading
Entry and Exit Points: VWAP can help identify optimal buy and sell points. Buy when the price is above VWAP and sell when it's below.
Support and Resistance: VWAP often acts as a dynamic support/resistance level. Prices tend to revert to VWAP, making it a crucial level for intraday traders.
Trend Confirmation
Uptrends and Downtrends: In an uptrend, the price will generally stay above VWAP. Conversely, in a downtrend, it will stay below. Use this to confirm market direction.
Combining with Other Indicators
Moving Averages and Bollinger Bands: Combining VWAP with these indicators can provide a more robust trading signal, confirming trends and potential reversals.
Setting Stop-Loss and Profit Targets
Conservative Stop Orders: Place stop orders at recent lows for pullback trades.
Profit Targets: Use daily highs or Fibonacci extension levels to set profit targets.
Strategies for Using VWAP
Pullback Strategy
Buy during pullbacks to VWAP in an uptrend, and sell during rallies to VWAP in a downtrend.
Breakout Strategy
Look for breakouts above/below VWAP after the market open to capitalize on new trends.
Momentum Trading
Use VWAP to confirm the strength of a trend. Buy when the price is consistently above VWAP and sell when it's consistently below.
Institutional Strategies
Institutional traders use VWAP to execute large orders without causing significant market impact, ensuring trades are made around the average price.
By incorporating these strategies, traders can better understand market dynamics, make informed trading decisions, and manage their risk effectively.
Some setup possibilities
Flexible timezone-aware session rangeAllows you to define session range with local time and its timezone, also can toggle session visibility any day of week.

MM Session Open AlgoThe MM Session Open Algo is a strategy to catch the opening breakout of a security
displays the current session with background color
Entry, Stop Loss Based on Atr, and two Take Profit levels
Kill zone entries for New york and London session
provides valid signal for entry once price crosses entry line
and set "opening session price" to determine what signal you are looking for. based on time frame
shows the Daily,Weekly,Monthly high and low
average daily range
and comes with trend filter.
Directions are Simple
when price crosses and closes above entry line. you get in with the set inputs of Tp and Sl
or you can set buy/sell stops with the price provided for you and ride the wave of the direction it goes with he Tp and Sl provided
Link below or PM us for access to this indicator Happy Trading


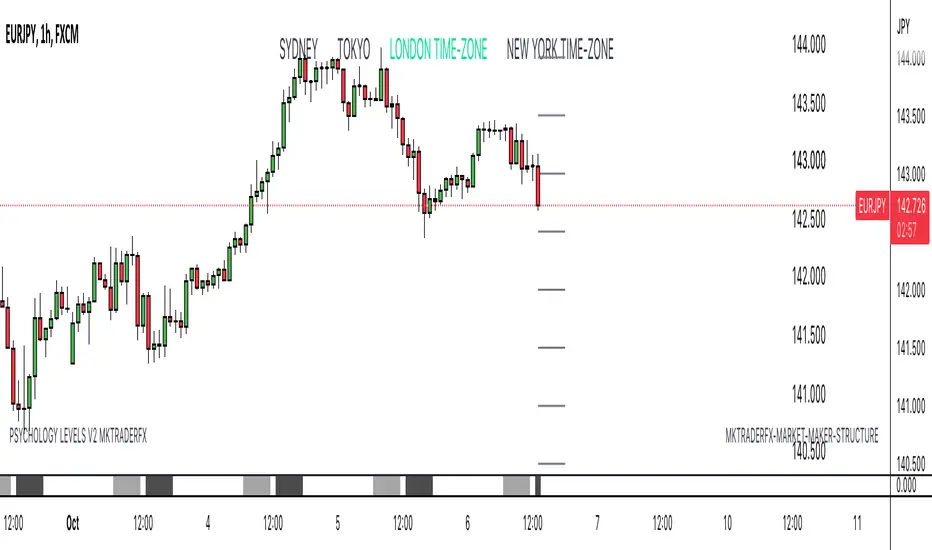
Trading Session IndicatorFollowing time zones showing:
Asia Session - Red
London Open - White
London Session - Blue
NY Open - White

FxNeel Session (Lite)Here is light version. You can all types of ICT session like Asia, london, new york, Aisa kill zone, CBDR .
Happy trading. Please drop your feedback.

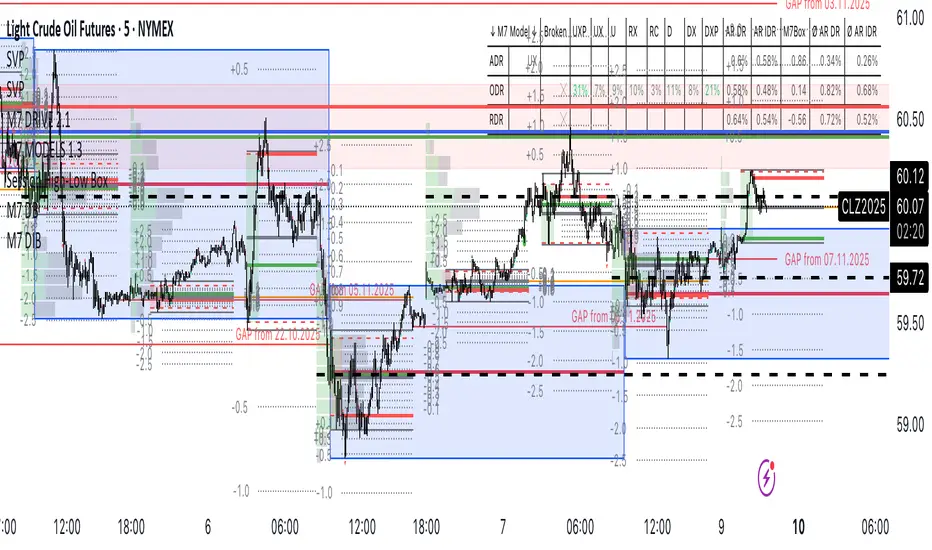
Session High-Low Box,
Session High-Low Box Session High-Low Box indicatorSession High-Low BoxSession High-Low BoxSession High-Low BoxSession High-Low BoxSession High-Low BoxSession High-Low BoxSession High-Low BoxSession High-Low BoxSession High-Low BoxSession High-Low BoxSession High-Low BoxSession High-Low BoxSession High-Low BoxSession High-Low BoxSession High-Low BoxSession High-Low BoxSession High-Low BoxSession High-Low BoxSession High-Low BoxSession High-Low BoxSession High-Low BoxSession High-Low Boxwrtvtrvwrtv4v2tr2Session High-Low Box24v2v2Session High-Low Box
Session AlertsSession Alerts; be notified every time a new customizable session opens up; never miss your start!

Session times for London (UTC 07:00–16:00 UTC)Session times for London (UTC 07:00–16:00 UTC). Shows the trading hours for the London Session Mon-Fri

Forex Session High/Low TrackerThis indicator maps out each Forex session along with their relative highs and lows.

Session Highlights with Toggle OptionsSession highlights that indicate movement activities during the day. Suitable for intraday timeframes. Cannot be use in Day and over. It comes with colorful highlights. You can edit your own color and opacity. The session .Enjoy your back test. Thank you
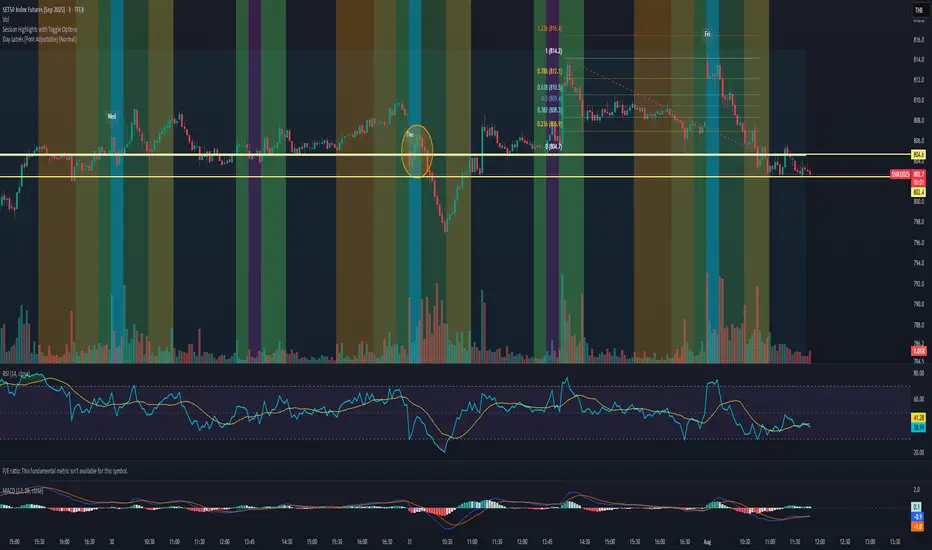
Session Highlights with Toggle OptionsSession highlights that indicate movement activities during the day. Suitable for intraday timeframes. Cannot be use in Day and over. It comes with colorful highlights. You can edit your own color and opacity. The session .Enjoy your back test. Thank you

ICT Index Futures Session LinesICT Index Futures Session Lines
Description:
The script is based on one of ICT's concepts on trading Index Futures. The script lays out the daily range from an intraday basis.
Range:
00:00 - New York Midnight
08:30 – New York Open (News events come out)
12:00/13:00 - New York Lunch (No trade time period)
13:30 - (Algorithm)
16:30 - Close
* The open, high and low lines are plotted from 00:00 to 08:30
How To Use:
You will need to check the daily bias. Prior to 8:30 you are to look for previous swing points where liquidity may exist. During the open you want to see if a high or low is taken out, and then wait for an energetic break/displacement for a potential FVG/imbalance retracement entry.
Strategy is for LTF (1 to 15m)
Default time zone is set to America/New_York (UTC New York), so lines will be plotted correctly regardless of user’s local UTC chart setting.


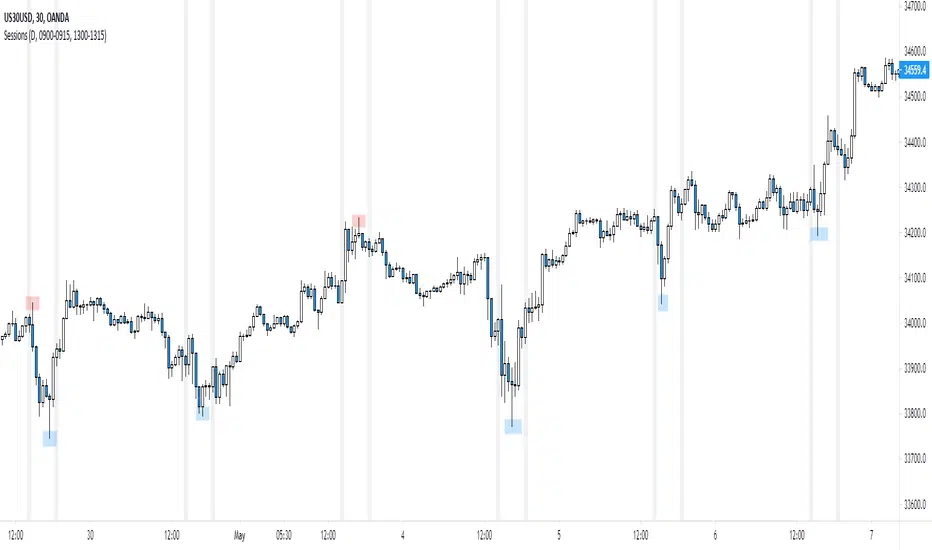
NY Session
Script to highlight the new york session trading hours
-The most volatile hours for us30 & the time in which it's most likely to make a significant high/low
Outcome Reach - Session Ranges - 1st**Must apply scale price on chart only by right clicking on price on the y-axis, otherwise this indicator won't work** This indicator shows price ranges in each forex session including the overlap between London and New York. This indicator is the first of a set of 3.
Do note this won't work with higher timeframes.

[FN] Session Range & Date Range For BacktestingThis has been done before in different ways, however, my goal is to publish a single, simplified copy/paste version of the idea so you can quickly and easily incorporate it into your strategy backtesting.
You can designate weekdays, weekdays + weekends for 24/7 markets, and also session range.
So, you trade bitcoin? It works. CME futures? It works. You are a discretionary trader so the only signals that matter are the ones that happen when you're awake? It works. Copy and paste.
The goal is that its that easy. You'll have to let me know if it is. glhf everyone.
If I'm not mistaken, you should be able to copy/paste this directly into your strategy script (Paste it in before your entry declarations). Just leave out the last 2 lines where the bgcolor() is declared... unless you want the background color lit up, that's up to you. It's just for demonstration purposes in this script.
After you've pasted it in, then in your strategy.entry() function you are adding: to the strategy.entry() function.
e.g:
strategy.entry("Long", strategy.long, qty=1, when = ENTRY_SIGNAL and signal_backtest())
Shoutouts to @zenandtheartoftrading and @allanster for providing the basis of this code that I put together here. We stand on the shoulders of giants.

Session Opens: 09:00 + 23:00 (Rolling Days, Stop at Now)Session Opening Times for 10 AM open and Midnight Open, but for central time.
