ค้นหาในสคริปต์สำหรับ "session"

ICT Precision Gaps & Sessions - IbrafxThis Indicator marks everything in 1 without the need to have several Indicators :
-Operational sessions with time configuration and by time location.
-NDOG
-NWOG
-New York Midnight
All of these allow us to change the size of their label and color. As with its delimiting lines, it allows us to change its shape and color and opacity.

Sessions and High/Low/andrewSessions and High/Low/andrew
this indictors covers all the session high and low including frankfurt

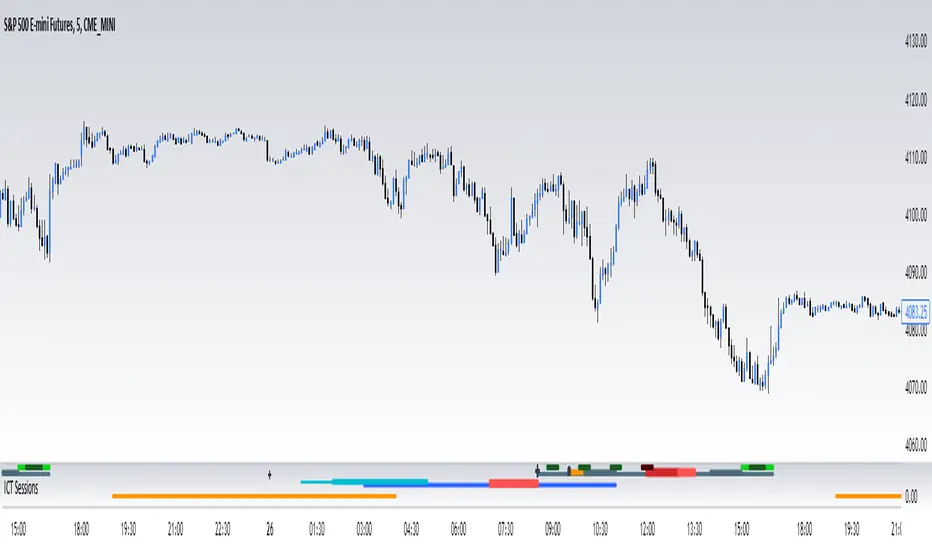
ICT SessionsThis script plots the timewindows of the ICT killzones (for forex) and trading session + makros below the chart. Individual components can be switched of to your liking
FX Sessions & Killzones ETJust another sessions indicator. Among all the many existing ones, I didn't find anything simple that would cover my needs and that would actually be correct.
New York time is forced here for plotting the stripes so you don't need to worry about the time zone currently set on your chart. The indicator will be accurate during Daylight Saving Time (which, in 2023 for example, started on Sunday, 12 March , 02:00:00 and will be in effect until Sunday, 5 November, 02:00:00).

All-In-One Sessions, Weekly, Monday, Previous Highs/LowsWe are forever drawing key levels on our charts with saved drawing templates, but finding the levels, adding the labels, is all tedious stuff. We have indicators, but we have multiple different ones at a time.
What if you could just tick a box on/off?
Well now you can.
This all in one 'levels' indicator is designed to show all the key highs and lows from previous weeks, Monday, the current week, as well as an option to highlight the market sessions and their highs and lows.
There are lots of options available for extending lines and choosing their colors, so once you have set it up how you want, don't forget to save YOUR defaults.
Oorah.

Volume by SessionVolume divided by the Sessions (Asia, Europe, Usa, none)
Only works on daily TF
Can be used as:
Stacked (best with style Columns and len = 0)
Cumulative (best with style Area and len = 30)
Overlayed (best with style Line and len = 7)

Fx220 Market Sessions IndicatorFx220 NATION! Welcome. Here's a script to add the Market Sessions without altering any settings! Enjoy - Brian

ARX Session Time Alerts (UK)This script provides time-based alerts for major market sessions and predefined time windows using UK time (Europe/London).
Alerts are purely time reminders and do not generate trade signals, predictions, or execution guidance.
Designed to support market awareness, preparation, and education.
Educational use only. Not financial advice.


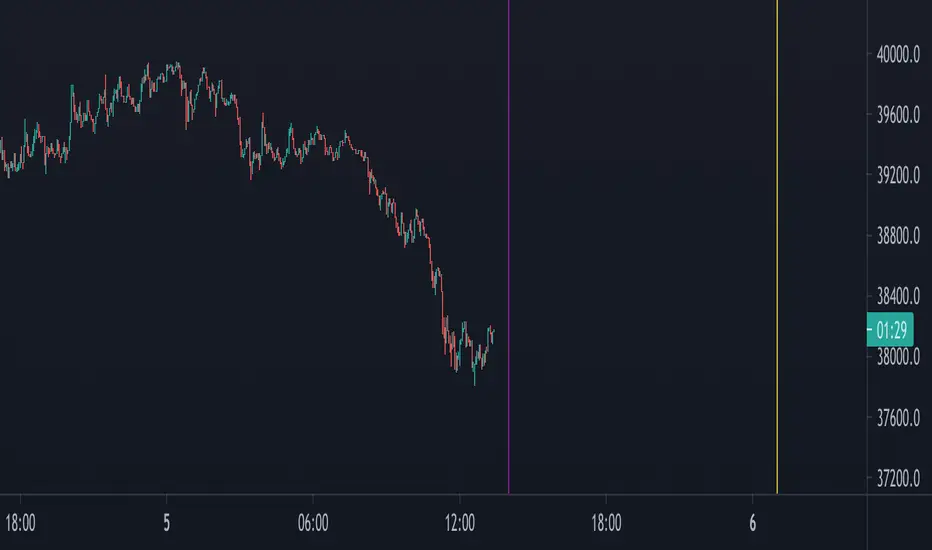
Next Session OpenThis script simply displays the next market open time with a vertical line.
Market open may be subject to special treatment as a trader (higher volatility, different move aspects, etc)
To make it possible to adjust to your trading style, this script allows you to configure:
Session open hours in UTC
Vertical line colors
Enable or disable lines
The line style
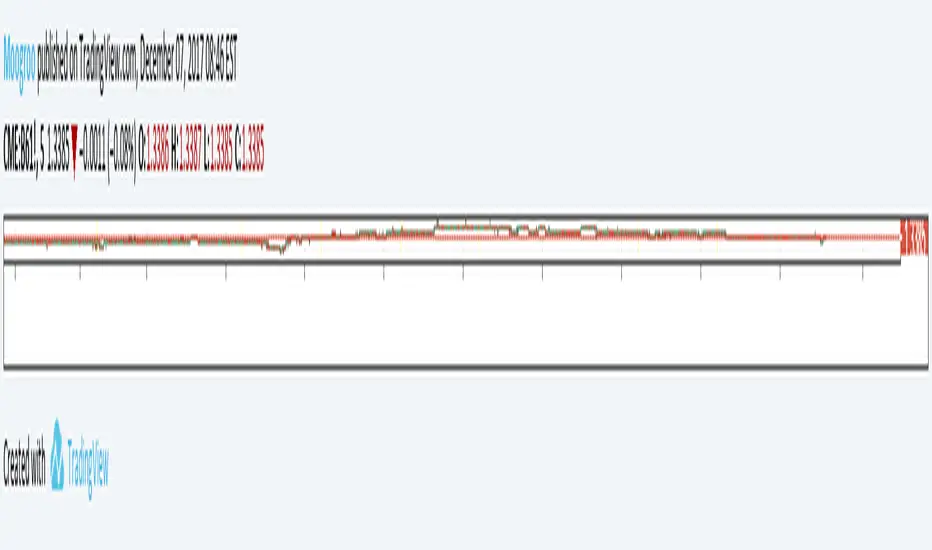
Moogroos session time linesthree session times plus 3 custom times where a line (or background) is cyclically plotted.
Sessions Major & Minor |Yvon-J|Session major and minor
Identify ICT Killzone
mark previous Day HIgh / Low
mark previous Week HIgh / Low
mark previous Month HIgh / Low

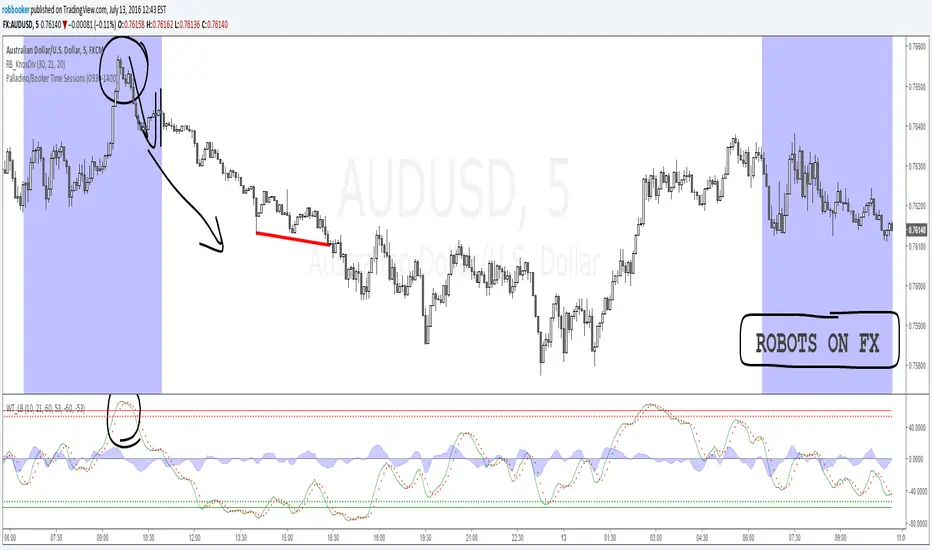
Palladino/Booker Time SessionsThe Palladino/Booker Time Sessions script will allow you to highlight certain periods of time during the day that are best suited to your trading. Add the script to your chart as many times as you like to highlight as many Time Sessions as you like.
One Trading Setup for Life ICT [TradingFinder] Sweep Session FVG🔵 Introduction
ICT One Trading Setup for Life is a trading strategy based on liquidity and market structure shifts, utilizing the PM Session Sweep to determine price direction. In this strategy, the market first forms a price range during the PM Session (from 13:30 to 16:00 EST), which includes the highest high (PM Session High) and lowest low (PM Session Low).
In the next session, the price first touches one of these levels to trigger a Liquidity Hunt before confirming its trend by breaking the Change in State of Delivery (CISD) Level. After this confirmation, the price retraces toward a Fair Value Gap (FVG) or Order Block (OB), which serve as the best entry points in alignment with liquidity.
In financial markets, liquidity is the primary driver of price movement, and major market participants such as institutional investors and banks are constantly seeking liquidity at key levels. This process, known as Liquidity Hunt or Liquidity Sweep, occurs when the price reaches an area with a high concentration of orders, absorbs liquidity, and then reverses direction.
In this setup, the PM Session range acts as a trading framework, where its highs and lows function as key liquidity zones that influence the next session’s price movement. After the New York market opens at 9:30 EST, the price initially breaks one of these levels to capture liquidity.
However, for a trend shift to be confirmed, the CISD Level must be broken.
Once the CISD Level is breached, the price retraces toward an FVG or OB, which serve as optimal trade entry points.
Bullish Setup :
Bearish Setup :
🔵 How to Use
In this strategy, the PM Session range is first identified, which includes the highest high (PM Session High) and lowest low (PM Session Low) between 13:30 and 16:00 EST. In the following session, the price touches one of these levels for a Liquidity Hunt, followed by a break of the Change in State of Delivery (CISD) Level. The price then retraces toward a Fair Value Gap (FVG) or Order Block (OB), creating a trading opportunity.
This process can occur in two scenarios : bearish and bullish setups.
🟣 Bullish Setup
In a bullish scenario, the PM Session High and PM Session Low are identified. In the following session, the price first breaks the PM Session Low, absorbing liquidity. This process results in a Fake Breakout to the downside, misleading retail traders into taking short positions.
After the Liquidity Hunt, the CISD Level is broken, confirming a trend reversal. The price then retraces toward an FVG or OB, offering an optimal long entry opportunity.
The initial take-profit target is the PM Session High, but if higher timeframe liquidity levels exist, extended targets can be set.
The stop-loss should be placed below the Fake Breakout low or the first candle of the FVG.
🟣 Bearish Setup
In a bearish scenario, the market first defines its PM Session High and PM Session Low. In the next session, the price initially breaks the PM Session High, triggering a Liquidity Hunt. This movement often causes a Fake Breakout, misleading retail traders into taking incorrect positions.
After absorbing liquidity, the CISD Level breaks, indicating a shift in market structure. The price then retraces toward an FVG or OB, offering the best short entry opportunity.
The initial take-profit target is the PM Session Low, but if additional liquidity exists on higher timeframes, lower targets can be considered.
The stop-loss should be placed above the Fake Breakout high or the first candle of the FVG.
🔵 Setting
CISD Bar Back Check : The Bar Back Check option enables traders to specify the number of past candles checked for identifying the CISD Level, enhancing CISD Level accuracy on the chart.
Order Block Validity : The number of candles that determine the validity of an Order Block.
FVG Validity : The duration for which a Fair Value Gap remains valid.
CISD Level Validity : The duration for which a CISD Level remains valid after being broken.
New York PM Session : Defines the PM Session range from 13:30 to 16:00 EST.
New York AM Session : Defines the AM Session range from 9:30 to 16:00 EST.
Refine Order Block : Enables finer adjustments to Order Block levels for more accurate price responses.
Mitigation Level OB : Allows users to set specific reaction points within an Order Block, including: Proximal: Closest level to the current price. 50% OB: Midpoint of the Order Block. Distal: Farthest level from the current price.
FVG Filter : The Judas Swing indicator includes a filter for Fair Value Gap (FVG), allowing different filtering based on FVG width: FVG Filter Type: Can be set to "Very Aggressive," "Aggressive," "Defensive," or "Very Defensive." Higher defensiveness narrows the FVG width, focusing on narrower gaps.
Mitigation Level FVG : Like the Order Block, you can set price reaction levels for FVG with options such as Proximal, 50% OB, and Distal.
Demand Order Block : Enables or disables bullish Order Block.
Supply Order Block : Enables or disables bearish Order Blocks.
Demand FVG : Enables or disables bullish FVG.
Supply FVG : Enables or disables bearish FVGs.
Show All CISD : Enables or disables the display of all CISD Levels.
Show High CISD : Enables or disables high CISD levels.
Show Low CISD : Enables or disables low CISD levels.
🔵 Conclusion
The ICT One Trading Setup for Life is a liquidity-based strategy that leverages market structure shifts and precise entry points to identify high-probability trade opportunities. By focusing on PM Session High and PM Session Low, this setup first captures liquidity at these levels and then confirms trend shifts with a break of the Change in State of Delivery (CISD) Level.
Entering a trade after a retracement to an FVG or OB allows traders to position themselves at optimal liquidity levels, ensuring high reward-to-risk trades. When used in conjunction with higher timeframe bias, order flow, and liquidity analysis, this strategy can become one of the most effective trading methods within the ICT Concept framework.
Successful execution of this setup requires risk management, patience, and a deep understanding of liquidity dynamics. Traders can enhance their confidence in this strategy by conducting extensive backtesting and analyzing past market data to optimize their approach for different assets.

PT Levels SessionsVersion 1.0 - PT Levels offers visual for Daily, Weekly, Monthly, Quarterly Yearly range.
Some sauces:
PT Range - Daily open, Monday High, Monday Low, Weekly Open
Weekend range, Wednesday range, CME Open, CME Close, NY Range, London Range & Asia Range
Strategy:
Price tends to gravitate between the Daily level when playing intraday scalps. If playing the weekly, you want to be above the weekly pivot to punt longs & under the weekly level to punt shorts. More likely than not, when the price hits a monthly or yearly level, we get a noticeable reaction off it.
These levels will give you an idea of where the price can react if reached. Consider them pivotal areas. We included a toggle that will help you go between the candle's High/Low to the candle's Open/Close. Both features are unique when scalping & swinging. The Level Sessions will paint a beautiful visual for your day-to-day trading & the Open/Close will help you determine where price maxed opened & closed for that specified timeframe.
If analyzing the crypto markets - Try to pay attention to price action on the weekend. We included a weekend range to offer a visual of the HIGH/LOW during the weekend when the volume is low & price is easier swayed.
Feel free to contact us for any suggestions. Check our indicator suite for the rest of our developed tools.

Sessions By SaintSessions indicator for traders wanting to look for breakouts early. This tool will help you differentiate between Tokyo, London, New York and Sydney sessions on a daily basis with the option of a daily high and low view.

Market Sessions Open/Close LevelsThis indicator displays the market open and close price levels for the main trading sessions (Sydney, Tokyo, Frankfurt, London and New York). The Daily Line changes color depending on if price is trading above or below the level. Feel free to add or replace levels depending on your trading style and trading times.


Sum and Subtract Hours and Minutes to Sessions SampleThis indicators it's a programming sample of how to sum and subtract hours and minutes to sessions on Tradingview
