Sentiment Estimator [AstrideUnicorn]Sentiment Estimator is an indicator that estimates market sentiment using only its pricing data. It counts bullish and bearish candles in a rolling window and calculates their relative values as percentages of the total amount of candles in the window. Market sentiment shows the direction in which the market is biased to move or the current trend direction. Extreme values of the market sentiment are contrarian signals. When the market sentiment is too bullish, it is time to sell and vice versa.
HOW TO USE
Sentiment Estimator plots a pair of green and red circles for each candle. They represent bullish and bearish sentiments, respectively.
The vertical positions of the circles show corresponding sentiment values in percentage units. For example, if a green circle's height is 60, the market is 60% bullish. In this case, the red circle's height will be 40, as bullish and bearish parts of the market sentiment sum to 100%.
The blue line plotted at the 50% level shows the neutral sentiment level. If a green circle is above the blue line, the prevailing market sentiment at that time is bullish, and the market is biased to move up. If a red one is above, the market has predominantly bearish sentiment and is prone to move down.
The red level shows extreme sentiment level. If a green or red circle is above this line, it means that the market is extremely bullish or bearish, respectively. It is a contrarian signal, and one can expect a reversal soon. In this case, a blue label with the text "reversal expected" is shown.
SETTINGS
Timeframe - allows choosing a timeframe other than the chart's one for the indicator calculation.
Look-Back Window - sets the historical window length used to perform the calculations. You can adjust the window to get the best results for a particular market or timeframe.
ค้นหาในสคริปต์สำหรับ "sentiment"

NAAIM SentimentSentiment Indicator for the National Association of Active Investment Managers
Follow me on twitter for market timing and verified returns posted to my feed
twitter.com
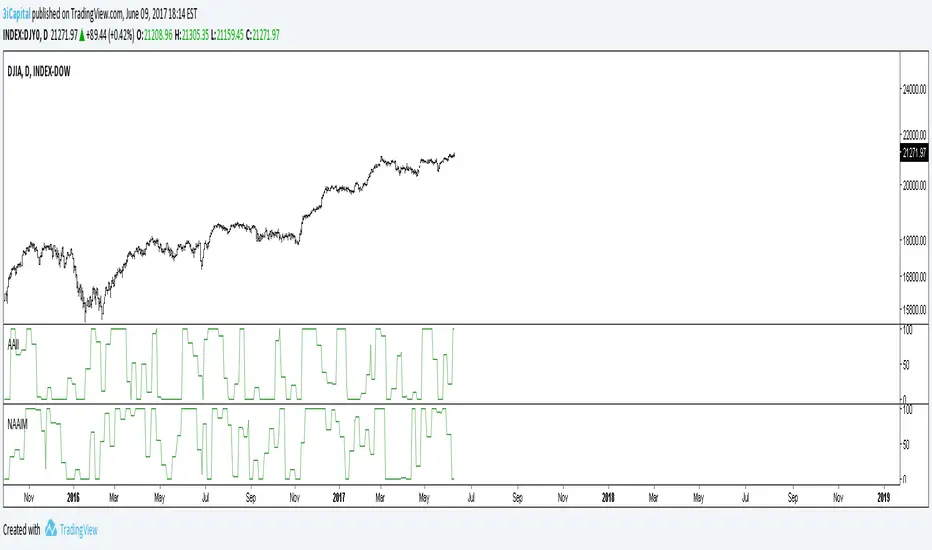
AAII SentimentSentiment Indicator for the American Association of Individual Investors
Follow me on twitter for market timing and verified returns posted to my feed
twitter.com


Volume-Trend Sentiment (VTS) [AlgoAlpha]Introducing the Volume-Trend Sentiment by AlgoAlpha, a unique tool designed for traders who seek a deeper understanding of market sentiment through volume analysis. This innovative indicator offers a comprehensive view of market dynamics, blending volume trends with price action to provide an insightful perspective on market sentiment. 🚀📊
Key Features:
1. 🌟 Dual Trend Analysis: This indicator combines the concepts of price movement and volume, offering a multi-dimensional view of market sentiment. By analyzing the relationship between the closing and opening prices relative to volume, it provides a nuanced understanding of market dynamics.
2. 🎨 Customizable Settings: Flexibility is at the core of this indicator. Users can adjust various parameters such as the length of the volume trend, standard deviation, and SMA length, ensuring a tailored experience to match individual trading strategies.
3. 🌈 Visual Appeal: With options to display noise, the main plot, and background colors, the indicator is not only informative but also visually engaging. Users can choose their preferred colors for up and down movements, making the analysis more intuitive.
4. ⚠️ Alerts for Key Movements: Stay ahead of market changes with built-in alert conditions. These alerts notify traders when the Volume-Trend Sentiment crosses above or below the midline, signaling potential shifts in market momentum.
How It Works:
The core of the indicator is the calculation of the Volume-Trend Sentiment (VTS). It is computed by subtracting a double-smoothed Exponential Moving Average (EMA) of the price-volume ratio from a single EMA of the same ratio. This method highlights the trend in volume relative to price changes.
volumeTrend = ta.ema((close - open) / volume, volumeTrendLength) - ta.ema(ta.ema((close - open) / volume, volumeTrendLength), volumeTrendLength)
To manage volatility and noise in the volume trend, the indicator employs a standard deviation calculation and a Simple Moving Average (SMA). This smoothing process helps in identifying the true underlying trend by filtering out extreme fluctuations.
standardDeviation = ta.stdev(volumeTrend, standardDeviationLength) * 1
smoothedVolumeTrend = ta.sma(volumeTrend / (standardDeviation + standardDeviation), smaLength)
A unique feature is the dynamic background color, which changes based on the sentiment level. This visual cue instantly communicates the market's bullish or bearish sentiment, enhancing the decision-making process.
getColor(volumeTrendValue) =>
sentimentLevel = math.abs(volumeTrendValue * 10)
baseTransparency = 60 // Base transparency level
colorTransparency = math.max(90 - sentimentLevel * 5, baseTransparency)
volumeTrendValue > 0 ? color.new(upColor, colorTransparency) : color.new(downColor, colorTransparency)
bgcolor(showBackgroundColor ? getColor(smoothedVolumeTrend) : na)
In summary, the Volume-Trend Sentiment by AlgoAlpha is a comprehensive tool that enhances market analysis through a unique blend of volume and price trends. Whether you're a seasoned trader or just starting out, this indicator offers valuable insights into market sentiment and helps in making informed trading decisions. 📈📉🔍🌐

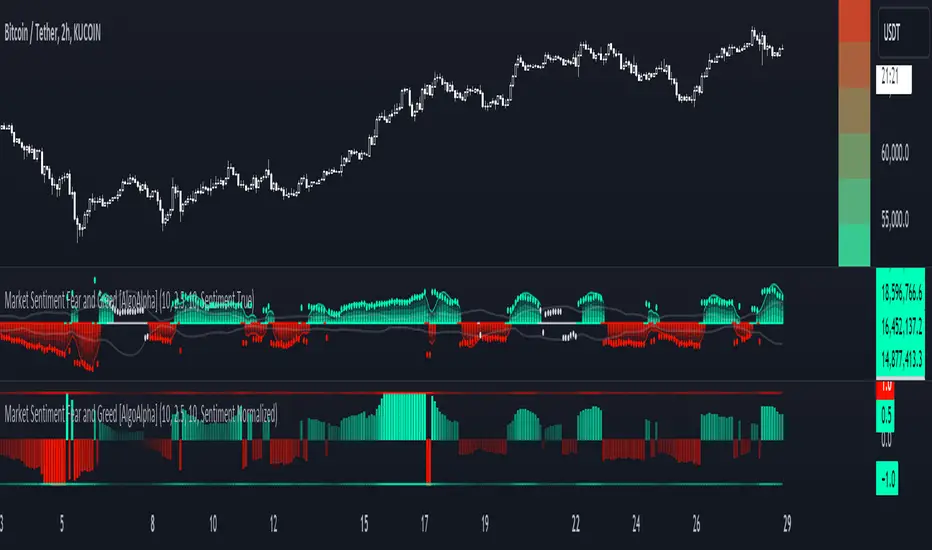
Market Sentiment Fear and Greed [AlgoAlpha]Unleash the power of sentiment analysis with the Market Sentiment Fear and Greed Indicator! 📈💡 This tool provides insights into market sentiment, helping you make informed trading decisions. Let's dive into its key features and how it works. 🚀✨
Key Features 🎯
🧠 Sentiment Analysis : Calculates market sentiment using volume and price data. 📊
📅 Customizable Lookback Window : Adjust the lookback period to fine-tune sensitivity. 🔧
🎨 Bullish and Bearish Colors : Visualize trends with customizable colors. 🟢🔴
🚀 Impulse Detection : Identifies bullish and bearish impulses for trend confirmation. 🔍
📉 Normalized Sentiment Index : Offers a normalized view of market sentiment. 📊
🔔 Alerts : Set alerts for key sentiment changes and trend impulses. 🚨
🟢🔴 Table Visualization : Displays sentiment strength using a gradient color table. 🗂️
How to Use 📖
Maximize your trading potential with this indicator by following these steps:
🔍 Add the Indicator : Search for "Market Sentiment Fear and Greed " in TradingView's Indicators & Strategies. Customize settings like the lookback window and trend breakout threshold to suit your trading strategy.
📊 Monitor Sentiment : Watch the sentiment gauge and plot changes to detect market sentiment shifts. Use the Normalized Sentiment Index for a more balanced view.
🚨 Set Alerts : Enable alerts for sentiment flips and trend impulses to stay ahead of market movements.
How It Works ⚙️
The indicator calculates market sentiment by averaging the volume and closing prices over a user-defined lookback period, creating a sentiment score. It differentiates between bullish and bearish sentiment by evaluating whether the closing price is higher or lower than the opening price, summing the respective volumes. The true sentiment is determined by comparing these summed values, with a positive score indicating bullish sentiment and a negative score indicating bearish sentiment. The indicator further normalizes this sentiment score by dividing it by the EMA of the highest high minus the lowest low over double the lookback period, ensuring values are constrained between -1 and 1. Bullish and bearish impulses are identified using Hull Moving Averages (HMA) of the positive and negative sentiments, respectively. When these impulses exceed a calculated threshold based on the standard deviation of the sentiment, it indicates a significant trend change. The script also includes a gradient color table to visually represent the strength of sentiment, and customizable alerts to notify users of key sentiment changes and trend impulses.
Unlock deeper insights into market sentiment and elevate your trading strategy with the Market Sentiment Fear and Greed Indicator! 📈✨
Sentiment Bias Gauge📌 Overview
The Sentiment Bias Gauge (SBG) is a unique overlay-style indicator that visually maps a sentiment value—such as market bullishness or bearishness—onto your price chart. It converts sentiment data (in this case, RSI-based) into a floating line that moves between defined price zones, allowing users to quickly understand the current market mood in the context of price.
⚙️ How It Works
• The indicator uses RSI (Relative Strength Index) as a proxy for market sentiment (0 to 100 scale).
• This sentiment value is then mapped to a vertical price range on your chart using a configurable zone (via top and bottom percent of chart range).
• The line floats up or down within the price chart, reflecting how bullish or bearish the sentiment is.
• It includes background shading to represent the sentiment level:
• 🔴 Red (Bearish): sentiment < 30
• 🟡 Yellow (Neutral): 30 ≤ sentiment ≤ 70
• 🟢 Green (Bullish): sentiment > 70
• A floating label shows the current sentiment score.
🌟 Key Features
• 📈 Overlay-Based Sentiment Line: Plots sentiment as a price-level line, giving intuitive spatial reference.
• 🔧 Configurable Range Placement: Adjust where the sentiment line appears within the chart’s high-low range.
• 🖌️ Color-Coded Background: Visually distinguish bullish, bearish, and neutral conditions.
• 🏷️ Real-Time Sentiment Label: Displays updated sentiment score on the most recent bar.
🧠 How to Use
• Use this indicator alongside your price action or technical strategy to gauge market mood.
• Combine with other sentiment indicators (e.g., fear/greed, delta volume, news sentiment).
• Especially helpful in sideways markets to identify potential shifts in bias before price reacts.
Why This Combination?
• RSI offers a reliable and intuitive proxy for market sentiment.
• Mapping the value directly onto the chart helps avoid constantly looking at a separate panel.
• The customizable chart range lets traders fit sentiment visuals within any market structure.
🎯 Why It’s Worth Using
• Makes sentiment visually accessible directly on the chart.
• Helps detect bullish/bearish bias shifts earlier than traditional indicators.
• A great tool for sentiment-aware discretionary trading or contextual overlays in algo strategies.

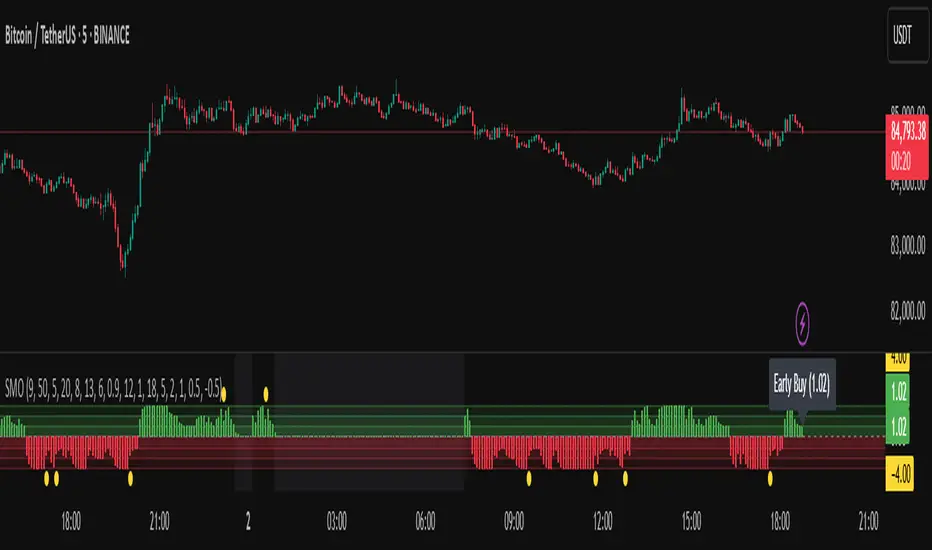
Sentiment Master Oscillator[BullByte]
The Sentiment Master Oscillator is a modern market sentiment indicator designed for traders seeking to identify early trend shifts and potential reversals with clarity. This oscillator combines multiple technical tools—RSI, MACD, EMAs, ADX, ATR, and volume filters—to deliver layered signals that help you assess market momentum in a clear and simplified manner.
Key Features:
- Multi-Indicator Approach :
Integrates RSI (with a smoothing function), MACD, and two EMAs to gauge momentum and trend direction. The oscillator also includes ADX and ATR filters to ensure that only markets with sufficient directional strength and volatility generate signals.
- Dynamic Signal Zones :
The oscillator produces a raw value ranging roughly from -3 to +3 (adjustable via a scaling factor). Positive readings suggest bullish conditions, while negative readings indicate bearish trends. Visual zones (Early, Confirmed, Strong) are clearly marked with color-coded horizontal lines to help you interpret the strength of the signal at a glance.
- Adaptive Smoothing :
For those who prefer quicker, more responsive signals (ideal for scalping), an adaptive smoothing option is available. When enabled, it applies a shorter smoothing period to the oscillator; otherwise, a more conservative base period is used.
- Reversal Alerts :
Yellow dots are plotted on the chart to highlight potential reversal points. These alerts are triggered when the oscillator crosses specific thresholds, coupled with volume and ATR conditions, signaling that a top or bottom may be forming.
- Customizable Filters :
- ATR Filter :Ensures that the market's volatility is above a set threshold before signaling.
- ADX Filter :Confirms sufficient trend strength.
- Volume Filter : Requires that trading volume surges above a multiple of its simple moving average, filtering out low-volume noise.
- Clear Signal Messaging :
Based on the combined signals from various indicators, the script categorizes market sentiment into actionable messages such as "Early Buy", "Confirmed Buy", "Strong Buy", "Early Sell", "Confirmed Sell", and "Strong Sell". A "Grey Zone" label is used when the oscillator is near neutral, indicating that no clear trend is present.
How to Use :
1. Entry and Exit Decisions : Use the different signal stages (Early, Confirmed, Strong) as guides for your entries and exits.
2. Trend Confirmation : Rely on the multi-indicator setup for added confirmation of prevailing market conditions before executing trades.
3. Reversal Cues : Pay attention to the reversal dots for potential turning points in the market, which can be used to adjust positions or initiate trades.
Disclaimer:
This indicator is intended for educational and informational purposes only. It should not be taken as financial advice. Always use appropriate risk management and combine it with your analysis before making any trading decisions. Past performance is not indicative of future results.
By adhering to TradingView's publishing guidelines, the BullByte Sentiment Master is designed to provide transparency, simplicity, and robust analysis tools to enhance your trading strategy. Enjoy a clearer view of market sentiment and make more informed trading decisions!
Sentiment OscillatorIn the complex world of trading, understanding market sentiment can be like reading the emotional pulse of financial markets. Our Sentiment Oscillator is designed to be your personal market mood translator, helping you navigate through the noise of price movements and market fluctuations.
Imagine having a sophisticated tool that goes beyond traditional price charts, diving deep into the underlying dynamics of market behavior. This indicator doesn't just show you numbers – it tells you a story about market sentiment, combining multiple financial signals to give you a comprehensive view of potential market directions.
The Sentiment Oscillator acts like a sophisticated emotional barometer for stocks, cryptocurrencies, or any tradable asset. It analyzes price changes, market volatility, trading volume, and long-term trends to generate a unique sentiment score. This score ranges from highly bullish to deeply bearish, providing traders with an intuitive visual representation of market mood.
Green zones indicate positive market sentiment, suggesting potential buying opportunities. Red zones signal caution, hinting at possible downward trends. The oscillator's gray neutral zone helps you identify periods of market uncertainty, allowing for more calculated trading decisions.
What sets this indicator apart is its ability to blend multiple market factors into a single, easy-to-understand indicator. It's not just about current price – it's about understanding the deeper currents moving beneath the surface of market prices.
Traders can use this oscillator to:
- Identify potential trend reversals
- Understand market sentiment beyond price movement
- Spot periods of market strength or weakness
- Complement other technical analysis tools
Whether you're a day trader, swing trader, or long-term investor, the Sentiment Oscillator provides an additional layer of insight to support your trading strategy. Remember, no indicator is a crystal ball, but this tool can help you make more informed decisions in the dynamic world of trading.

Bitcoin Leverage Sentiment - Strategy [presentTrading]█ Introduction and How it is Different
The "Bitcoin Leverage Sentiment - Strategy " represents a novel approach in the realm of cryptocurrency trading by focusing on sentiment analysis through leveraged positions in Bitcoin. Unlike traditional strategies that primarily rely on price action or technical indicators, this strategy leverages the power of Z-Score analysis to gauge market sentiment by examining the ratio of leveraged long to short positions. By assessing how far the current sentiment deviates from the historical norm, it provides a unique lens to spot potential reversals or continuation in market trends, making it an innovative tool for traders who wish to incorporate market psychology into their trading arsenal.
BTC 4h L/S Performance
local
█ Strategy, How It Works: Detailed Explanation
🔶 Data Collection and Ratio Calculation
Firstly, the strategy acquires data on leveraged long (**`priceLongs`**) and short positions (**`priceShorts`**) for Bitcoin. The primary metric of interest is the ratio of long positions relative to the total of both long and short positions:
BTC Ratio=priceLongs / (priceLongs+priceShorts)
This ratio reflects the prevailing market sentiment, where values closer to 1 indicate a bullish sentiment (dominance of long positions), and values closer to 0 suggest bearish sentiment (prevalence of short positions).
🔶 Z-Score Calculation
The Z-Score is then calculated to standardize the BTC Ratio, allowing for comparison across different time periods. The Z-Score formula is:
Z = (X - μ) / σ
Where:
- X is the current BTC Ratio.
- μ is the mean of the BTC Ratio over a specified period (**`zScoreCalculationPeriod`**).
- σ is the standard deviation of the BTC Ratio over the same period.
The Z-Score helps quantify how far the current sentiment deviates from the historical norm, with high positive values indicating extreme bullish sentiment and high negative values signaling extreme bearish sentiment.
🔶 Signal Generation: Trading signals are derived from the Z-Score as follows:
Long Entry Signal: Occurs when the BTC Ratio Z-Score crosses above the thresholdLongEntry, suggesting bullish sentiment.
- Condition for Long Entry = BTC Ratio Z-Score > thresholdLongEntry
Long Exit/Short Entry Signal: Triggered when the BTC Ratio Z-Score drops below thresholdLongExit for exiting longs or below thresholdShortEntry for entering shorts, indicating a shift to bearish sentiment.
- Condition for Long Exit/Short Entry = BTC Ratio Z-Score < thresholdLongExit or BTC Ratio Z-Score < thresholdShortEntry
Short Exit Signal: Happens when the BTC Ratio Z-Score exceeds the thresholdShortExit, hinting at reducing bearish sentiment and a potential switch to bullish conditions.
- Condition for Short Exit = BTC Ratio Z-Score > thresholdShortExit
🔶Implementation and Visualization: The strategy applies these conditions for trade management, aligning with the selected trade direction. It visualizes the BTC Ratio Z-Score with horizontal lines at entry and exit thresholds, illustrating the current sentiment against historical norms.
█ Trade Direction
The strategy offers flexibility in trade direction, allowing users to choose between long, short, or both, depending on their market outlook and risk tolerance. This adaptability ensures that traders can align the strategy with their individual trading style and market conditions.
█ Usage
To employ this strategy effectively:
1. Customization: Begin by setting the trade direction and adjusting the Z-Score calculation period and entry/exit thresholds to match your trading preferences.
2. Observation: Monitor the Z-Score and its moving average for potential trading signals. Look for crossover events relative to the predefined thresholds to identify entry and exit points.
3. Confirmation: Consider using additional analysis or indicators for signal confirmation, ensuring a comprehensive approach to decision-making.
█ Default Settings
- Trade Direction: Determines if the strategy engages in long, short, or both types of trades, impacting its adaptability to market conditions.
- Timeframe Input: Influences signal frequency and sensitivity, affecting the strategy's responsiveness to market dynamics.
- Z-Score Calculation Period: Affects the strategy’s sensitivity to market changes, with longer periods smoothing data and shorter periods increasing responsiveness.
- Entry and Exit Thresholds: Set the Z-Score levels for initiating or exiting trades, balancing between capturing opportunities and minimizing false signals.
- Impact of Default Settings: Provides a balanced approach to leverage sentiment trading, with adjustments needed to optimize performance across various market conditions.

Sentiment Zone OscillatorHere's a (forgotten but still useful) Sentiment Zone Oscillator. The Sentiment Zone Oscillator takes a sum of positive price candles over a user-specified window length. Normally, a triple exponential moving average of the sum is used, but we opted to just go with a double EMA for the sake of more responsiveness. When the histogram is green it is bullish and red/pink means bears.

Price Change Sentiment Index [tradeviZion]Price Change Sentiment Index
A technical indicator that measures price changes relative to the day's range.
Indicator Overview
Normalizes price changes on a 0-100 scale
Uses a smoothing period for signal clarity
Shows potential overbought/oversold conditions
Inputs
Smoothing Period (default: 3)
Show Background Colors (on/off)
Overbought Level (default: 75)
Oversold Level (default: 25)
Reading the Indicator
Values above 75: Price change showing strong upward movement
Values below 25: Price change showing strong downward movement
Around 50: Neutral price movement
Technical Details
// Core calculation
changePct = (currClose - prevClose) / (high - low)
normalized = 50 + (changePct * 50)
smoothedNormalized = ta.sma(normalizedClamped, smoothingPeriod)
Usage Notes
Best used with other technical analysis tools
Adjustable smoothing period affects signal sensitivity
Background colors highlight extreme readings
Works on any timeframe
Settings Guide
Smoothing Period:
- Lower values (1-3): More responsive
- Higher values (5-10): Smoother output
Visual Settings: Toggle background colors
Levels: Adjust overbought/oversold thresholds
This indicator is a technical analysis tool. Please conduct your own research and testing before use.

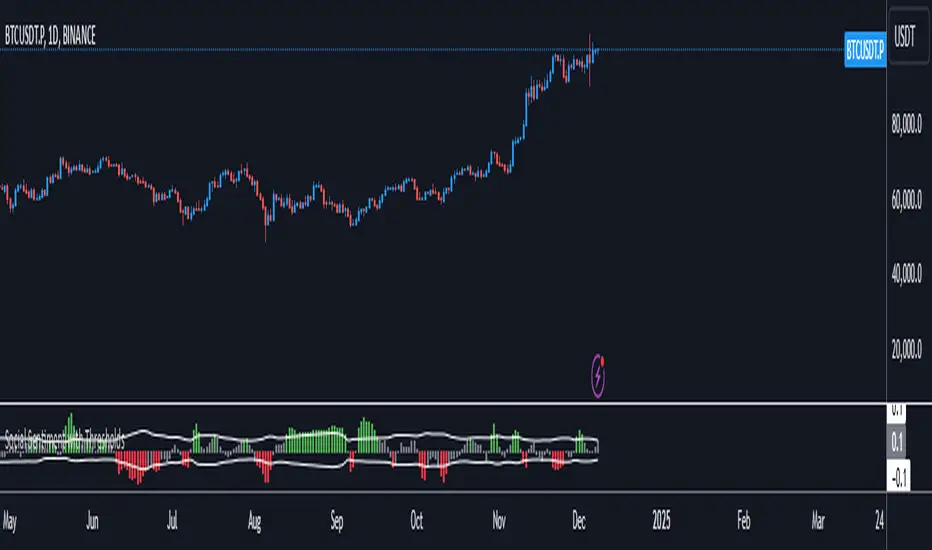
Social SentimentThe Social Sentiment Indicator aggregates social sentiment data from Telegram and LunarCrush , normalizing and smoothing the data to create an intuitive, adaptive sentiment signal. By comparing positive and negative sentiment from Telegram with LunarCrush's sentiment percentages, this indicator provides a visual representation of aggregated market sentiment.
This script provides context for market sentiment, helping traders understand crowd psychology and its potential impact on price action. It excels at identifying moments of extreme optimism or pessimism, which can act as confirmations or warnings in a broader trading strategy.
This tool provides context but lacks direct buy/sell signals. Works best in trending or volatile markets but should be combined with other indicators for a complete trading strategy.
Composite Sentiment Indicator (SPY/QQQ/SOXX + VixFix)# Multi-Index Composite Sentiment Indicator
A comprehensive sentiment indicator that works across SPY, QQQ, SOXX, and custom symbols. Combines volatility, options flow, macro factors, technicals, and seasonality into a single z-score composite.
## What It Does
Takes multiple market sentiment inputs (VIX, put/call ratios, breadth, yields, etc.) and smooshes them into one normalized line. When the composite is high = markets getting spooked. When it's low = markets getting complacent.
## Key Features
- **Multi-Index Support**: Automatically adapts for SPY (uses VIX), QQQ (uses VXN), SOXX (uses VixFix), or custom symbols
- **VixFix Integration**: Larry Williams' VixFix for indices without dedicated VIX measures
- **Signal MA**: Choose from SMA/EMA/WMA/HMA/TEMA/DEMA with color coding (red above MA = risk-on, green below = risk-off)
- **September Focus**: Built-in seasonality weighting for September weakness patterns
- **Comprehensive Components**: Volatility, options sentiment, macro factors, technicals, and sector-specific metrics
## How to Use
**Basic Setup:**
1. Pick your index (SPY/QQQ/SOXX)
2. Choose signal MA type and length (EMA 21 is a good start)
3. Watch for extreme readings and MA crossovers
**Color Signals:**
- Red composite = above signal MA = bearish sentiment
- Green composite = below signal MA = bullish sentiment
- Extreme high readings (red background) = potential tops
- Extreme low readings (green background) = potential bottoms
**For Different Indices:**
- **QQQ**: Uses NASDAQ VIX (VXN) when available, falls back to VixFix
- **SOXX**: Includes semiconductor cycle indicators, uses VixFix for volatility
- **Custom**: Adapts automatically, relies on VixFix and general market metrics
## Components Included
**Volatility**: VIX/VXN/VixFix, term structure, historical vol
**Options**: Put/call ratios, SKEW index
**Macro**: DXY, 10Y yields, yield curve, TIPS spreads
**Technical**: RSI deviation, momentum
**Seasonality**: September effects, quad witching, month-end patterns
**Breadth**: S&P 500 and NASDAQ breadth measures
## Pro Tips
- Works well on Daily Timeframe
- September gets extra weight automatically - watch for August setup signals
- Keltner envelope breaks often mark sentiment exhaustion points
- Use alerts for extreme readings and MA crossovers
Works best when you understand that sentiment extremes often mark turning points, not continuation signals. High readings don't mean "keep shorting" - they mean "start looking for reversal setups."
## Settings Worth Tweaking
- Signal MA type/length for your timeframe
- Component weights based on what matters for your index
- Envelope multipliers for your risk tolerance
- VixFix parameters if default doesn't fit your symbol's volatility
The table shows all current component readings so you can see what's driving the signal. Good for context and debugging weird readings.

VIX Statistical Sentiment Index [Nasan]** THIS IS ONLY FOR US STOCK MARKET**
The indicator analyzes market sentiment by computing the Rate of Change (ROC) for the VIX and S&P 500, visualizing the data as histograms with conditional coloring. It measures the correlation between the VIX, the specific stock, and the S&P 500, displaying the results on the chart. The reliability measure combines these correlations, offering an overall assessment of data robustness. One can use this information to gauge the inverse relationship between VIX and S&P 500, the alignment of the specific stock with the market, and the overall reliability of the correlations for informed decision-making based on the inverse relationship of VIX and price movement.
**WHEN THE VIX ROC IS ABOVE ZERO (RED COLOR) AND RASING ONE CAN EXPECT THE PRICE TO MOVE DOWNWARDS, WHEN THE VIX ROC IS BELOW ZERO (GREEN)AND DECREASING ONE CAN EXPECT THE PRICE TO MOVE UPWARDS"
Understanding the VIX Concept:
The VIX, or Volatility Index, is a widely used indicator in finance that measures the market's expectation of volatility over the next 30 days. Here are key points about the VIX:
Fear Gauge:
Often referred to as the "fear gauge," the VIX tends to rise during periods of market uncertainty or fear and fall during calmer market conditions.
Inverse Relationship with Market:
The VIX typically has an inverse relationship with the stock market. When the stock market experiences a sell-off, the VIX tends to rise, indicating increased expected volatility.
Implied Volatility:
The VIX is derived from the prices of options on the S&P 500. It represents the market's expectations for future volatility and is often referred to as "implied volatility."
Contrarian Indicator:
Extremely high VIX levels may indicate oversold conditions, suggesting a potential market rebound. Conversely, very low VIX levels may signal complacency and a potential reversal.
VIX vs. SPX Correlation:
This correlation measures the strength and direction of the relationship between the VIX (Volatility Index) and the S&P 500 (SPX).
A negative correlation indicates an inverse relationship. When the VIX goes up, the SPX tends to go down, and vice versa.
The correlation value closer to -1 suggests a stronger inverse relationship between VIX and SPX.
Stock vs. SPX Correlation:
This correlation measures the strength and direction of the relationship between the closing price of the stock (retrieved using src1) and the S&P 500 (SPX).
This correlation helps assess how closely the stock's price movements align with the broader market represented by the S&P 500.
A positive correlation suggests that the stock tends to move in the same direction as the S&P 500, while a negative correlation indicates an opposite movement.
Reliability Measure:
Combines the squared values of the VIX vs. SPX and Stock vs. SPX correlations and takes the square root to create a reliability measure.
This measure provides an overall assessment of how reliable the correlation information is in guiding decision-making.
Interpretation:
A higher reliability measure implies that the correlations between VIX and SPX, as well as between the stock and SPX, are more robust and consistent.
One can use this reliability measure to gauge the confidence they can place in the correlations when making decisions about the specific stock based on VIX data and its correlation with the broader market.

20 SMA based Bull/Bear sentiment indicatorThis script is only doing one thing, plots the 20 SMA and based on whether the asset's price is above or below of the SMA it changes the color of the SMA and the background's color.
Helping it to visualize whether from the 20 SMA's point of view we are in a Bull or a Bear trend.
I created this because I myself use this SMA with Bitcoin on the weekly time frame to identify the macro trend on the weekly.
IMO this is a good crypto market sentiment indicator.

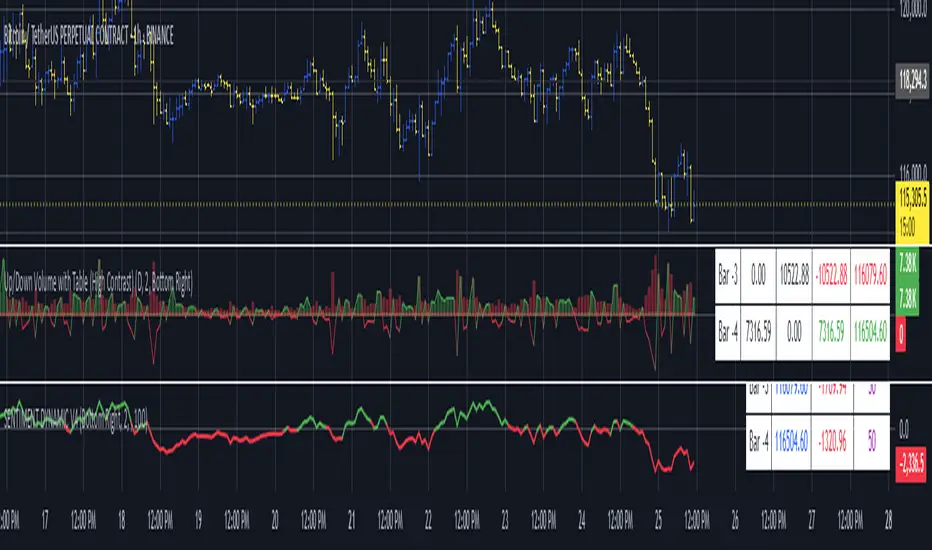
SENTIMENTSENTIMENT Indicator – User Guide
Summary
The SENTIMENT indicator provides a quick visual reference for current and recent market sentiment. It compares the closing price to a custom sentiment value, which is the average of the 100-period (default) simple moving averages (SMA) of the high and low prices. The indicator displays this information in a color-coded table and plots the difference between price and sentiment as a line on your chart.
How to Use
1. Table Overview
The table appears on your chart in your chosen position.
It displays four rows: the current bar (“Now”) and the previous three bars (“Bar -1”, “Bar -2”, “Bar -3”).
Each row shows:
The bar label (The current bar is live and active, constantly changing)
The closing price for that bar
The difference between the closing price and the sentiment value for that bar
The sentiment difference is color-coded:
Green: Price is above sentiment (bullish)
Red: Price is below sentiment (bearish)
2. Chart Plot
The indicator plots a line showing the difference between the current price and the sentiment value.
When the line is above zero: price is above sentiment (bullish).
When the line is below zero: price is below sentiment (bearish).
3. Settings
Number of Lookback Bars: Adjusts the SMA period for sentiment calculation (default is 100).
Table Position: Choose where to display the table on your chart (e.g., Top Left, Bottom Right).
How to Interpret
Green values in the table or a plot above zero suggest bullish sentiment.
Red values in the table or a plot below zero suggest bearish sentiment.
Use this indicator to quickly assess if the market is trading above or below its recent average sentiment level.
Tips
You can combine the SENTIMENT indicator with other tools or signals for more robust trading decisions.
Adjust the lookback period to suit your trading timeframe and style.
Retail Sentiment Indicator - Multi-Asset CFD & Fear/Greed IndexRetail Sentiment Indicator - Multi-Asset CFD & Fear/Greed Index
Overview
The Retail Sentiment Indicator provides real-time sentiment data for major financial instruments including stocks, forex, commodities, and cryptocurrencies. This indicator displays retail trader positioning and market sentiment using CFD data and fear/greed indices.
Methodology and Scale Calculation
This indicator operates on a **-50 to +50 scale** with zero representing perfect market equilibrium.
Scale Interpretation:
- **Zero (0)**: Market balance - exactly 50% of investors buying, 50% selling
- **Positive values**: Majority buying pressure
- Example: If 63% of investors are buying, the indicator shows +13 (63 - 50 = +13)
- **Negative values**: Majority selling pressure
- Example: If 92% of investors are selling, the indicator shows -42 (50 - 92 = -42)
BTC Fear & Greed Index Scaling:
The original `BTC FEAR&GREED` index is natively scaled from 0-100 by its creator. In our indicator, this data has been rescaled to also fit the -50 to +50 range for consistency with other sentiment data sources.
This unified scaling approach allows for direct comparison across all instruments and data sources within the indicator.
-Important Data Source Selection-
Bitcoin (BTC) Data Sources
When viewing Bitcoin charts, the indicator offers **two different data sources**:
1. **Default Auto-Mode**: `BTCUSD Retail CFD` - Retail CFD traders sentiment data (automatically loaded).
2. **Manual Selection**: `BTC FEAR&GREED` - Fear & Greed Index from website: alternative dot me
**To access BTC Fear & Greed Index**: Input settings -> disable checkbox "Auto-load Sentiment Data" -> manually select "BTC FEAR&GREED" from the dropdown menu.
US Stock Market Data Sources
For US stocks and indices (S&P 500, NASDAQ, Dow Jones), there are **two data source options**:
1. **Default Auto-Mode**: Individual retail CFD sentiment data for each instrument
2. **Manual Selection**: `SNN FEAR&GREED` - SNN's Fear & Greed Index covering the overall US market sentiment. SNN was used as the name to avoid any potential trademark infringement.
**To access SNN Fear & Greed Index**: When viewing US market charts, disable in input settings checkbox "Auto-load Sentiment Data" and manually select "SNN FEAR&GREED" from the dropdown menu.
This distinction allows traders to choose between **instrument-specific retail sentiment** (auto-mode) or **broader market sentiment indices** (manual selection).
Features
- **Auto-Detection**: Automatically loads sentiment data based on the current chart symbol
- **Manual Selection**: Choose from 40+ supported instruments when auto-detection is unavailable
- **Multiple Data Sources**: Combines retail CFD sentiment with Fear & Greed indices
- **Visual Zones**: Clear greed/fear zones with color-coded backgrounds
- **Real-time Updates**: Live sentiment data from merged data sources
Supported Instruments
Major Indices
- S&P 500, NASDAQ, Dow Jones 30, DAX
Forex Pairs
- Major pairs: EURUSD, GBPUSD, USDJPY, USDCHF, USDCAD
- Cross pairs: EURJPY, GBPJPY, AUDUSD, NZDUSD, and 20+ others
Commodities
- Precious metals: Gold (XAUUSD), Silver (XAGUSD)
- Energy: WTI Oil
- Agricultural: Wheat, Coffee
- Industrial: Copper
Cryptocurrencies
- Bitcoin (BTC) sentiment data
- BTC & SNN Fear & Greed indices
How to Use
1. **Auto Mode** (Default): Enable "Auto-load Sentiment Data" to automatically display sentiment for the current chart symbol
2. **Manual Mode**: Disable auto-load and select from the dropdown menu for specific instruments
3. **Interpretation**:
- Values above 0 (green) indicate retail greed/bullish sentiment
- Values below 0 (red) indicate retail fear/bearish sentiment
- Fear & Greed indices use 0-100 scale (50 is neutral)
Data Sources
This indicator uses curated sentiment data from retail CFD providers and established fear/greed indices. Data is updated regularly and sourced from reputable financial data providers.
Trading Strategy & Market Philosophy
Contrarian Trading Approach
The primary purpose of this indicator is based on the fundamental market principle that **the majority of retail investors are often wrong**, and markets typically move opposite to the positions held by the majority of market participants.
Key Strategy Guidelines:
- **Contrarian Signal**: When the majority of users are positioned on one side of the market, there is statistically greater market advantage in taking positions in the opposite direction
- **Trend Exhaustion Signal**: An interesting observed phenomenon occurs when, during a long-lasting trend where the majority of investors have consistently been on the wrong side, the Sentiment indicator suddenly shows that the majority has flipped and opened positions in the direction of that long-running trend. This is often a signal of fuel exhaustion for further movement in that direction
Interpretation Examples
- High greed readings (majority bullish) → Consider bearish opportunities
- High fear readings (majority bearish) → Consider bullish opportunities
- Sudden sentiment flip during established trends → Potential trend reversal signal
Technical Notes
- Built with PineScript v6
- Dynamic symbol detection with fallback options
- Optimized for performance with minimal resource usage
- Color-coded visualization with customizable zones
Data Sources & Expansion
Acknowledgments
We extend our gratitude to **TradingView** for enabling the use of custom data feeds based on GitHub repositories, making this comprehensive sentiment analysis possible.
Data Expansion Opportunities
As the operator of this indicator, I am **open to suggestions for new data sources** that could be integrated and published. If you have ideas for additional instruments or sentiment data:
How to Submit Suggestions:
1. Send a **private message** with your proposal
2. Include: **instrument/data type**, **source**, and **brief description**
3. If technically feasible, we will work to import and publish the data
Data Infrastructure Status
Current Data Upload Process:
Please note that sentiment data uploads may occasionally experience minor interruptions. However, this should not pose significant issues as sentiment data typically changes gradually rather than rapidly.
Infrastructure Development:
We are actively working on establishing permanent cloud-based infrastructure to ensure continuous, automated data collection and upload processes. This will provide more reliable and consistent data availability in the future.
Disclaimer
This indicator is for educational and informational purposes only. Sentiment data should be used as part of a comprehensive trading strategy and not as the sole basis for trading decisions. Past performance does not guarantee future results. The contrarian approach described is a market theory and may not always produce profitable results.

US Market SentimentThe "US Market Sentiment" indicator is designed to provide insights into the sentiment of the US market. It is based on the calculation of an oscillator using data from the High Yield Ratio. This indicator can be helpful in assessing the overall sentiment and potential market trends.
Key Features:
Trend Direction: The indicator helps identify the general trend direction of market sentiment. Positive values indicate a bullish sentiment, while negative values indicate a bearish sentiment. Traders and investors can use this information to understand the prevailing market sentiment.
Overbought and Oversold Levels: The indicator can highlight overbought and oversold conditions in the market. When the oscillator reaches high positive levels, it suggests excessive optimism and a potential downside correction. Conversely, high negative levels indicate excessive pessimism and the possibility of an upside rebound.
Divergence Analysis: The indicator can reveal divergences between the sentiment oscillator and price movements. Divergences occur when the price reaches new highs or lows, but the sentiment oscillator fails to confirm the move. This can signal a potential trend reversal or weakening of the current trend.
Confirmation of Trading Signals: The "US Market Sentiment" indicator can be used to confirm other trading signals or indicators. For instance, if a momentum indicator generates a bullish signal, a positive reversal in the sentiment oscillator can provide additional confirmation for the trade.
Usage and Interpretation:
Positive values of the "US Market Sentiment" indicate a bullish sentiment, suggesting potential buying opportunities.
Negative values suggest a bearish sentiment, indicating potential selling or shorting opportunities.
Extreme positive or negative values may signal overbought or oversold conditions, respectively, and could precede a market reversal.
Divergences between the sentiment oscillator and price trends may suggest a potential change in the current market direction.
Traders and investors can combine the "US Market Sentiment" indicator with other technical analysis tools to enhance their decision-making process and gain deeper insights into the US market sentiment.

Macro Risk On/Off SentimentOverview
As an Ichimoku trader, I've always found it crucial to understand the broader market sentiment before entering trades. That's why I developed this Macro Risk On/Off Sentiment Indicator. It's designed to provide a comprehensive view of global market risk sentiment by analysing multiple factors across different asset classes. By combining nine key market indicators, it produces an overall risk sentiment score, giving me a clearer picture of the market's mood before I apply my Ichimoku strategy.
Rationale
While Ichimoku is powerful for identifying trends and potential entry points, I realised it doesn't always capture the broader market context. Markets don't exist in isolation—they're influenced by a myriad of factors including volatility, economic indicators, and cross-asset relationships. By creating this indicator, I aimed to fill that gap, providing myself with a macro view that complements my Ichimoku analysis.
How It Works
The indicator analyses nine different market factors:
VIX (Volatility Index): Measures market expectations of near-term volatility.
S&P 500 Performance: Represents the overall US stock market performance.
US 10-Year Treasury Yield: Indicates bond market sentiment and economic outlook.
Gold Price Movement: Often seen as a safe-haven asset.
US Dollar Index: Measures the strength of the USD against a basket of currencies.
Emerging Markets Performance: Represents risk appetite for higher-risk markets.
High Yield Bond Spreads: Indicates credit market risk sentiment.
Copper/Gold Ratio: An economic growth indicator.
Put/Call Ratio: Measures overall market sentiment based on options trading.
Each factor is assigned a score based on its z-score relative to its recent history, then weighted according to its perceived importance. The overall risk score is a weighted average of these individual scores.
How I Use It
Before applying my Ichimoku strategy, I first check this indicator to gauge the overall market sentiment:
I look at the blue line plotted on the chart, which represents the overall risk score.
I note the background colour: green for risk-on (positive score) and red for risk-off (negative score).
I check the label in the lower-left corner, which provides specific FX pair recommendations and market expectations.
In a risk-on environment (positive score):
I focus on long positions in AUD/JPY, NZD/JPY, EUR/USD, etc.
I look for short opportunities in USD/CAD, USD/NOK, etc.
I expect commodities and yields to rise
In a risk-off environment (negative score):
I focus on long positions in USD/JPY, USD/CHF, USD/CAD
I look for short opportunities in AUD/USD, NZD/USD, EUR/USD
I expect increased volatility and falling yields
The strength of the sentiment is reflected in how close the score is to either 1 (strong risk-on) or -1 (strong risk-off). This helps me gauge how aggressive or conservative I should be with my Ichimoku trades.
Customisation
I've designed this indicator to be flexible. You can modify it to:
Adjust the lookback period and moving average length (both default to 30)
Change the weighting of different factors in the final score calculation
Include or exclude specific factors based on your analysis needs
By combining this Macro Risk On/Off Sentiment Indicator with my Ichimoku analysis, I've found I can make more informed trading decisions, taking into account both the technical setups I see on the chart and the broader market context.

BTC Twitter SentimentBTC Twitter Sentiment - shows the total numbers of all negative, neutral and positive Bitcoin related tweets.
On default settings, the tweets are plotted in red (negative) white (neutral) as well as green (positive). The three charts are stacked so the total number of tweets is easily discernible.
Furthermore, there's an optional smoothing setting in the options.
The Twitter Sentiment data is provided daily by IntoTheBlock; Since data is only updated once a day the graph might look chunky on lower timeframes, even with smoothing.

Cryptocurrency SentimentOverview
This script focuses on calculating and visualizing the sentiment difference between LONG positions and SHORT positions for a selected cryptocurrency pair on the Bitfinex exchange. It provides a clean and clear visual representation of the sentiment, helping traders analyze market behavior.
Key Features
Dynamic Symbol Selection:
The script automatically detects the cryptocurrency symbol from the chart (syminfo.basecurrency) and dynamically constructs the LONGS and SHORTS ticker symbols.
Works seamlessly for pairs like BTCUSD, ETHUSD, and others available on Bitfinex.
Sentiment Calculation:
The sentiment difference is calculated as:
Sentiment Difference=−1×(100− SHORTS/LONGS ×100)
LONGS : The total number of long positions.
SHORTS : The total number of short positions.
If SHORTS is 0, the value is safely skipped to avoid division errors.
Color Coding:
The script visually highlights the sentiment difference:
Green Line: Indicates that LONG positions are dominant (bullish sentiment).
Red Line: Indicates that SHORT positions are dominant (bearish sentiment).
Zero Reference Line:
A gray horizontal line at 0 helps users quickly identify the transition between bullish (above zero) and bearish (below zero) sentiment.
How It Works
Fetching Data:
The script uses request.security to fetch LONGS and SHORTS data at the current chart timeframe (timeframe.period) for the dynamically generated Bitfinex tickers.
Handling Data:
Missing or invalid data (NaN) is filtered out to prevent errors.
Extreme spikes or irregular values are safely avoided.
Visualization:
The sentiment difference is plotted with dynamic color coding:
Green when LONGS > SHORTS (bullish sentiment).
Red when SHORTS > LONGS (bearish sentiment).
Benefits
Market Sentiment Insight: Helps traders quickly identify if the market is leaning towards bullish or bearish sentiment based on actual LONG and SHORT position data.
Dynamic and Adaptive: Automatically adjusts to the selected cryptocurrency symbol on the chart.
Clean Visualization: Focuses solely on sentiment difference with color-coded signals, making it easy to interpret.
Best Use Cases
Trend Confirmation: Use the sentiment difference to confirm trends during bullish or bearish moves.
Market Reversals: Identify potential reversals when sentiment shifts from positive (green) to negative (red) or vice versa.
Sentiment Monitoring: Monitor the overall market bias for cryptocurrencies like BTC, ETH, XRP, etc., in real-time.
Sample Chart Output
Above Zero → Green Line: Bullish sentiment dominates.
Below Zero → Red Line: Bearish sentiment dominates.
Zero Line → Transition point for shifts in sentiment.

Dynamic Sentiment RSI [UAlgo]The Dynamic Sentiment RSI is a technical analysis tool that combines the classic RSI (Relative Strength Index) concept with dynamic sentiment analysis, offering traders enhanced insights into market conditions. Unlike the traditional RSI, this indicator integrates volume weighting, sentiment factors, and smoothing features to provide a more nuanced view of momentum and potential market reversals. It is designed to assist traders in detecting overbought/oversold conditions, momentum shifts, and to generate potential buy or sell signals using crossover and crossunder techniques. By dynamically adjusting based on sentiment and volume factors, this RSI offers better adaptability to varying market conditions, making it suitable for different trading styles and timeframes.
This tool is particularly helpful for traders who wish to explore not only price movement but also the underlying market sentiment, offering a more comprehensive approach to momentum analysis. The sentiment factor amplifies the RSI's sensitivity to price shifts, making it easier to detect early signals of market reversals or the continuation of a trend.
🔶 Key Features
Dynamic Sentiment Calculation: The indicator incorporates a "Sentiment Factor" that adjusts the RSI length dynamically based on a multiplier, helping traders better understand market sentiment at different time intervals.
Volume Weighting: When enabled, the RSI calculations are weighted by volume, allowing traders to give more importance to price movements with higher trading volume, which may provide more accurate signals.
Smoothing Feature: A customizable smoothing period is applied to the RSI to help filter out noise and make the signal smoother. This feature is particularly useful for traders who prefer to focus on long-term trends while minimizing false signals.
Step Size Customization: A "Step Size" input allows users to round the sentiment RSI to predefined intervals, making the results easier to interpret and act upon. This feature allows you to focus on significant sentiment changes and ignore minor fluctuations.
Crossover/Crossunder Alerts: The indicator includes crossover and crossunder signals on the zero-line, helping traders identify potential buy and sell opportunities as the smoothed RSI crosses these levels.
The indicator offers a clear visual display with multiple color-coded lines and areas:
Sentiment RSI: Plotted as an area chart, color-coded based on sentiment strength.
Raw RSI: A purple line representing the raw adjusted RSI.
Smoothed RSI: A dynamic line, color-coded aqua or orange based on its position relative to the zero line.
Buy/Sell Signals: Triangle shapes are plotted at crossovers and crossunders, providing clear entry and exit points.
🔶 Interpreting the Indicator
Sentiment RSI
-This line represents the sentiment-adjusted RSI, where the higher the value, the stronger the bullish sentiment, and the lower the value, the stronger the bearish sentiment. It is rounded to step intervals, making it easier to detect significant shifts in sentiment.
- A positive sentiment RSI (above 0) suggests bullish market conditions, while a negative sentiment RSI (below 0) suggests bearish conditions.
Smoothed RSI
The smoothed RSI helps reduce noise and shows the trend more clearly.
Crossovers of the zero line are significant:
- Crossover above zero: Indicates that bullish momentum is building, potentially signaling a buying opportunity.
- Crossunder below zero: Signals a shift towards bearish momentum, potentially indicating a sell signal.
Traders should look for these crossovers in conjunction with other signals for more accurate entry/exit points.
Raw RSI (Adjusted)
The raw adjusted RSI offers a less smoothed, more responsive version of the RSI. While it may be noisier, it provides early signals of market reversals and trends.
Crossover/Crossunder Signals
- When the smoothed RSI crosses above the zero line, a "Signal Up" triangle appears, indicating a potential buying opportunity.
- When the smoothed RSI crosses below the zero line, a "Signal Down" triangle appears, signaling a potential sell opportunity.
These signals help traders time their entries and exits by identifying momentum shifts.
Volume Weighting (Optional)
- If volume weighting is enabled, the RSI will give more weight to periods of higher trading volume, making the signals more reliable when the market is highly active.
Strong Up/Down Levels (40/-40)
- These dotted lines represent extreme sentiment levels. When the sentiment RSI reaches 40 or -40, the market may be nearing an overbought or oversold condition, respectively. This could be a signal for traders to prepare for potential reversals or shifts in momentum.
By combining the various components of this indicator, traders can gain a comprehensive view of market sentiment and price action, helping them make more informed trading decisions. The combination of sentiment factors, volume weighting, and smoothing makes this indicator highly flexible and suitable for a variety of trading strategies.
🔶 Disclaimer
Use with Caution: This indicator is provided for educational and informational purposes only and should not be considered as financial advice. Users should exercise caution and perform their own analysis before making trading decisions based on the indicator's signals.
Not Financial Advice: The information provided by this indicator does not constitute financial advice, and the creator (UAlgo) shall not be held responsible for any trading losses incurred as a result of using this indicator.
Backtesting Recommended: Traders are encouraged to backtest the indicator thoroughly on historical data before using it in live trading to assess its performance and suitability for their trading strategies.
Risk Management: Trading involves inherent risks, and users should implement proper risk management strategies, including but not limited to stop-loss orders and position sizing, to mitigate potential losses.
No Guarantees: The accuracy and reliability of the indicator's signals cannot be guaranteed, as they are based on historical price data and past performance may not be indicative of future results.
