13/48 EMA Trading Scalper (ATR TP/SL)13/48 EMA Trading Scalper (ATR TP/SL)
What it does:
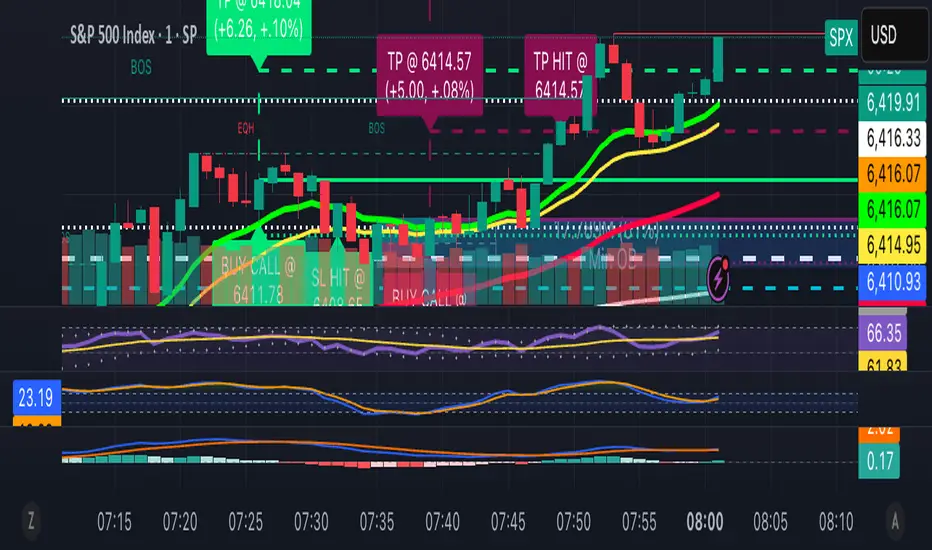
This tool looks for price “touches” of the 13-EMA, only takes CALL entries when the 13 is above the 48 (uptrend) and PUT entries when the 13 is below the 48 (downtrend), and confirms with a simple candle pattern (green > red with expansion for calls, inverse for puts). Touch sensitivity is ATR-scaled, so signals adapt to volatility. Each trade gets auto-drawn entry, TP, and SL lines, colored labels with $ / % distance from entry, plus optional TP/SL hit alerts. A rotating color palette and per-bar label staggering help keep the chart readable. Old objects are auto-pruned via maxTracked.
How it works
Trend filter: 13-EMA vs 48-EMA.
Entry: ATR-scaled touch of the 13-EMA + candle confirmation.
Risk: TP/SL = ATR multiples you control.
Visuals: Entry/TP/SL lines (extend right), vertical entry marker (optional), multi-line labels.
Hygiene: maxTracked keeps only the last N trades’ objects; labels are staggered to reduce overlap.
Alerts: Buy Call, Buy Put, Take Profit Reached, Stop Loss Hit.
Key Inputs
Fast EMA (13), Trend EMA (48), ATR Length (14)
Touch Threshold (x ATR) – how close price must come to the EMA
Take Profit (x ATR), Stop Loss (x ATR)
maxTracked – number of recent trades to keep on chart
Tips
Start with Touch = 0.10–0.20 × ATR; TP=2×ATR, SL=1×ATR, then tune per symbol/timeframe.
Works on intraday and higher TFs; fewer, cleaner signals on higher TFs.
This is an indicator, not a broker—always backtest and manage risk.
ค้นหาในสคริปต์สำหรับ "scalp"
Zero-Lag Scalper with Trend Line (BUY/SELL labels) BY RAHZero-Lag Scalper with Trend Line (BUY/SELL labels) BY RAH

Smart Scalper Indicator🎯 How the Smart Scalper Indicator Works
1. EMA (Exponential Moving Average)
EMA 10 (Blue Line):
Shows the short-term trend.
If the price is above this line, the trend is bullish; if below, bearish.
EMA 20 (Orange Line):
Displays the longer-term trend.
If EMA 10 is above EMA 20, it indicates a bullish trend (Buy signal).
2. SuperTrend
Green Line:
Represents support levels.
If the price is above the green line, the market is considered bullish.
Red Line:
Represents resistance levels.
If the price is below the red line, the market is considered bearish.
3. VWAP (Volume Weighted Average Price)
Purple Line:
Indicates the average price considering volume.
If the price is above the VWAP, the market is strong (Buy signal).
If the price is below the VWAP, the market is weak (Sell signal).
4. ATR (Average True Range)
Used to measure market volatility.
An increasing ATR indicates higher market activity, enhancing the reliability of signals.
ATR is not visually displayed but is factored into the signal conditions.
⚡ Entry Signals
Green Up Arrow (Buy):
EMA 10 is above EMA 20.
The price is above the SuperTrend green line.
The price is above the VWAP.
Volatility (ATR) is increasing.
Red Down Arrow (Sell):
EMA 10 is below EMA 20.
The price is below the SuperTrend red line.
The price is below the VWAP.
Volatility (ATR) is increasing.
🔔 Alerts
"Buy Alert" — Notifies when a Buy condition is met.
"Sell Alert" — Notifies when a Sell condition is met.
✅ How to Use the Indicator:
Add the indicator to your TradingView chart.
Enable alerts to stay updated on signal triggers.
Check the signal:
A green arrow suggests a potential Buy.
A red arrow suggests a potential Sell.
Set Stop-Loss:
Below the SuperTrend line or based on ATR levels.
Take Profit:
Target 1-2% for short-term trades.

QTE Scalper ModifiedA modified version of the QTE scalper indicator. Produces a buy/sell signal based on a 2 candle pattern. For long signals it produces a signal when the high and low of the second candle are below the high and low of the first candle and both candles close above the 10 period EMA. The reverse is true for short signals.
Added functionality so that signals will trigger an alert: Add the indicator to the chart on the instrument and timeframe you wish to use it on. Add an alert and in the 'condition' section choose the indicator and set the trigger as 'once per bar close'. You will have to set individual alerts for both long and short signals and if you change the time period on the chart.

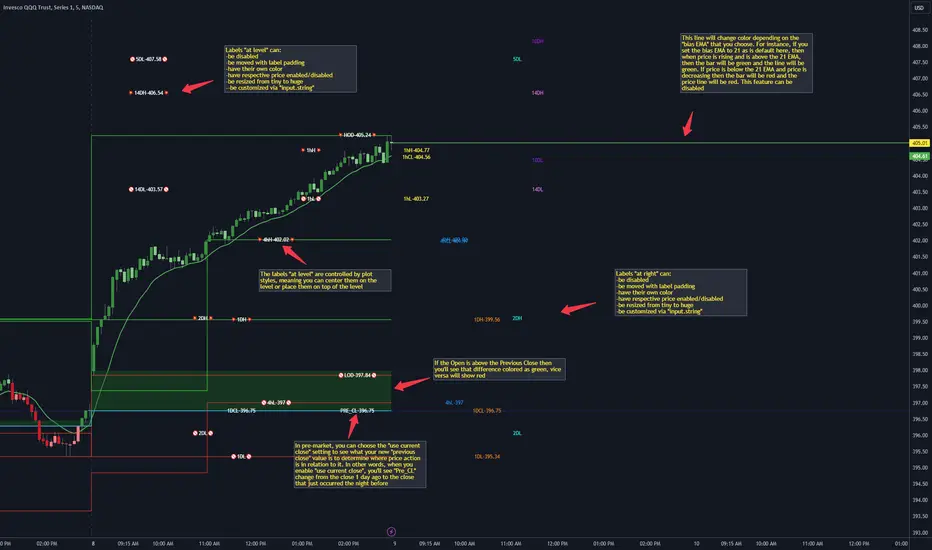
CANDLE LEVELS [PRO]This indicator provides you with 55 levels! with labels to help you identify quickly where current price is in relation to the OPEN, CLOSE, HIGH OF DAY and LOW OF DAY to a respective level. Choose from levels as low as the 5 minute time frame all the way up to 200 days. All of the levels except the day's OPEN, HIGH OF DAY AND LOW OF DAY use the PREVIOUS time frame's level. In other words, when you're looking at the "1 DAY HIGH", that's actually the previous day's HIGH OF DAY. Whether you're a scalper on the lower time frames or a swing trader that mainly uses the 1 hour and above, these candle levels can be an invaluable source of support and resistance; in other words you'll often see price bounce off of a level (whether price is increasing or decreasing) once or multiple times and that could be an indication of a price's direction. Another way that you could utilize this indicator is to use it in confluence with other popular signals, such as an EMA crossover. For instance, you could watch as price rises above the 21 EMA all the while price is also crossing up and over the previous day's HIGH OF DAY with a relative volume that's double that of the previous week's average. These are just a few of some potential bullish signals that you could look for to go long on a trade using the candle levels provided.
I've made this indicator extremely customizable:
⚡Each level has 2 labels: 1 "at level" and 1 "at right", each label and price can be disabled
⚡Each label has its own input for label padding. The "at right" label padding input allows you to zoom in and out of a chart without the labels moving along their respective axis
⚡Each label's text can be customized via an "input.string" code base
⚡Each level's label can be changed via a plot style setting to determine if the label is centered with it's respective level or rides along the top of it
⚡Significant figures input allows you to round price up or down
⚡A "bias EMA" tool that color codes the candles and price line to show you where price is in relation to the 21 EMA (or another value that you pick). As a result, this can be an effective visual to help reduce cognitive load
⚡A "fill level" where color is determined by price opening above or below the previous day's close
⚡A "use current close" setting that's great to use in pre-market as it shows you where price is in relation to the previous days' close
----------------------------------------------------------------------------------------------------------------------
🙏Thanks to (c)satymahajan for the inspiration behind the ATR "previous close" and "bias candle" code base
🙏Thanks to my mentor (c)SimpleCryptoLife for the libraries and extensive code to help create this indicator
ATR PivotsThe "ATR Pivots" script is a technical analysis tool designed to help traders identify key levels of support and resistance on a chart. The indicator uses various metrics such as the Average True Range (ATR), Daily True Range ( DTR ), Daily True Range Percentage (DTR%), Average Daily Range (ADR), Previous Day High ( PDH ), and Previous Day Low ( PDL ) to provide a comprehensive picture of the volatility and movement of a security. The script also includes an EMA cloud and 200 EMA for trend identification and a 1-minute ATR scalping strategy for traders to make informed trading decisions.
ATR Detail:-
The ATR is a measure of the volatility of a security over a given period of time. It is calculated by taking the average of the true range (the difference between the high and low of a security) over a set number of periods. The user can input the number of periods (ATR length) to be used for the ATR calculation. The script also allows the user to choose whether to use the current close or not for the calculation. The script calculates various levels of support and resistance based on the relationship between the security's range ( high-low ) and the ATR. The levels are calculated by multiplying the ATR by different Fibonacci ratios (0.236, 0.382, 0.5, 0.618, 0.786, 1.000) and then adding or subtracting the result from the previous close. The script plots these levels on the chart, with the -100 level being the most significant level. The user also has an option to choose whether to plot all Fibonacci levels or not.
DTR and DTR% Detail:-
The Daily True Range Percentage (DTR%) is a metric that measures the daily volatility of a security as a percentage of its previous close. It is calculated by dividing the Daily True Range ( DTR ) by the previous close. DTR is the range between the current period's high and low and gives a measure of the volatility of the security on a daily basis. DTR% can be used as an indicator of the percentage of movement of the security on a daily basis. In this script, DTR% is used in combination with other metrics such as the Average True Range (ATR) and Fibonacci ratios to calculate key levels of support and resistance for the security. The idea behind using DTR% is that it can help traders to better understand the daily volatility of the security and make more informed trading decisions.
For example, if a security has a DTR% of 2%, it suggests that the security has a relatively low level of volatility and is less likely to experience significant price movements on a daily basis. On the other hand, if a security has a DTR% of 10%, it suggests that the security has a relatively high level of volatility and is more likely to experience significant price movements on a daily basis.
ADR:-
The script then calculates the ADR (Average Daily Range) which is the average of the daily range of the security, using the formula (Period High - Period Low) / ATR Length. This gives a measure of the average volatility of the security on a daily basis, which can be useful for determining potential levels of support and resistance .
PDH /PDL:-
The script also calculates PDH (Previous Day High) and PDL (Previous Day Low) which are the High and low of the previous day of the security. This gives a measure of the previous day's volatility and movement, which can be useful for determining potential levels of support and resistance .
EMA Cloud and 200 EMA Detail:-
The EMA cloud is a technical analysis tool that helps traders identify the trend of the market by comparing two different exponential moving averages (EMAs) of different lengths. The cloud is created by plotting the fast EMA and the slow EMA on the chart and filling the space between them. The user can input the length of the fast and slow EMA , and the script will calculate and plot these EMAs on the chart. The space between the two EMAs is then filled with a color that represents the trend, with green indicating a bullish trend and red indicating a bearish trend . Additionally, the script also plots a 200 EMA , which is a commonly used long-term trend indicator. When the fast EMA is above the slow EMA and the 200 EMA , it is considered a bullish signal, indicating an uptrend. When the fast EMA is below the slow EMA and the 200 EMA , it is considered a bearish signal, indicating a downtrend. The EMA cloud and 200 EMA can be used together to help traders identify the overall trend of the market and make more informed trading decisions.
1 Minute ATR Scalping Strategy:-
The script also includes a 1-minute ATR scalping strategy that can be used by traders looking for quick profits in the market. The strategy involves using the ATR levels calculated by the script as well as the EMA cloud and 200 EMA to identify potential buy and sell opportunities. For example, if the 1-minute ATR is above 11 in NIFTY and the EMA cloud is bullish , the strategy suggests buying the security. Similarly, if the 1-minute ATR is above 30 in BANKNIFTY and the EMA cloud is bullish , the strategy suggests buying the security.
Inside Candle:-
The Inside Candle is a price action pattern that occurs when the current candle's high and low are entirely within the range of the previous candle's high and low. This pattern indicates indecision or consolidation in the market and can be a potential sign of a trend reversal. When used in the 15-minute chart, traders can look for Inside Candle patterns that occur at key levels of support or resistance. If the Inside Candle pattern occurs at a key level and the price subsequently breaks out of the range of the Inside Candle, it can be a signal to enter a trade in the direction of the breakout. Traders can also use the Inside Candle pattern to trade in a tight range, or to reduce their exposure to a current trend.
Risk Management:-
As with any trading strategy, it is important to practice proper risk management when using the ATR Pivots script and the 1-minute ATR scalping strategy. This may include setting stop-loss orders, using appropriate position sizing, and diversifying your portfolio. It is also important to note that past performance is not indicative of future results and that the script and strategy provided are for educational purposes only.
In conclusion, the "ATR Pivots" script is a powerful tool that can help traders identify key levels of support and resistance , as well as trend direction. The additional metrics such as DTR , DTR%, ADR, PDH , and PDL provide a more comprehensive picture of the volatility and movement of the security, making it easier for traders to make better trading decisions. The inclusion of the EMA cloud and 200 EMA for trend identification, and the 1-minute ATR scalping strategy for quick profits can further enhance a trader's decision-making process. However, it is important to practice proper risk management and understand that past performance is not indicative of future results.
Special thanks to satymahajan for the idea of clubbing Average True Range with Fibonacci levels.

thuyliemforever EMA Scalper - Buy/Sellthuyliemforever EMA Scalper - Buy/Sell
Indicator that help you make decision buy or sell.

Super Scalper - 5 Min 15 MinThis strategy is based on RSI and ATR Bands which works better in 5 and 15 Mins time frame.
Perform enough back testing with 1:2R before using in real time.
Entry only on trade on screen symbols, use additional buy/sell alerts to book profit or to trail SL.
I have also added Golden Cross Over of 65 and 21 EMA to have confirmation on trend.

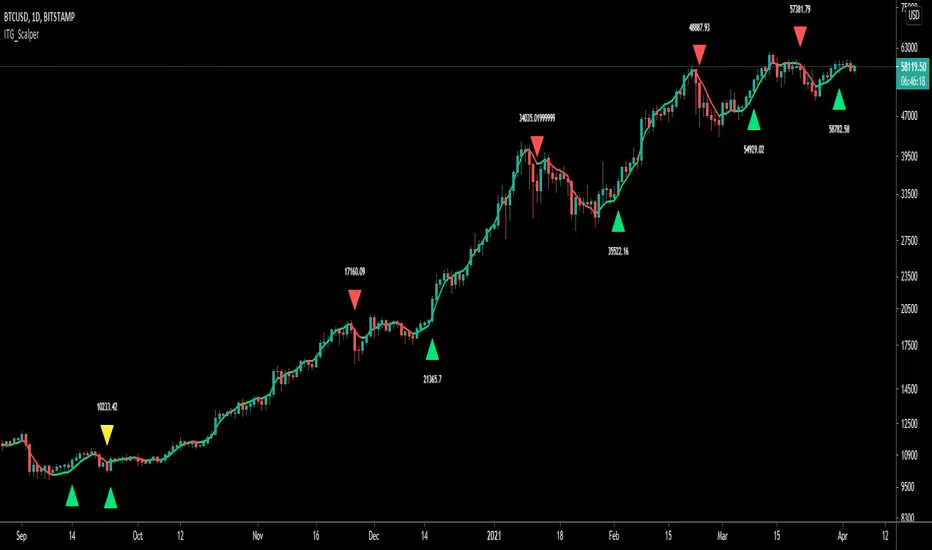
ITG ScalperITG Scalper by Complector.
Inspired by Juboal-Rabaroansa Perosteck Alseyn Balveda dam T'seif
Methology:
- I am using a TEMA (triple EMA) to determine the local trend direction and to give buy & sell signals when the trend changes.
- An optional filter, using moving average convergence divergence (MACD), can be switched on to filter out 'false' signals.
- The calculation of the TEMA does not request data from a resolution higher or lower than the resolution of the main charts symbol,
However, the filter function does, if another resolution is chosen for the filter.
- Persistent variables are used for buy and sell prices, enabling color-coding of the sell-signal (profitable or not).
Features:
- Color coded TEMA - bullish=green , bearish=red
- Buy/Sell indicator - Sell indicator: green=profit, yellow=loss
- Optional noise filter
- Optional variable time-frame for noise filter
Remarks:
In my experience, the default values works best on the daily time frame. I encourage everyone to experiment with the values for best results.
Using the script on non-standard charts (Heikin Ashi, Renko etc.) can produce unrealistic results.
Using a resolution higher or lower than the main charts symbol for the filter can possibly lead to repainting.
Thanks to Iain M. Banks for making my life richer :-)
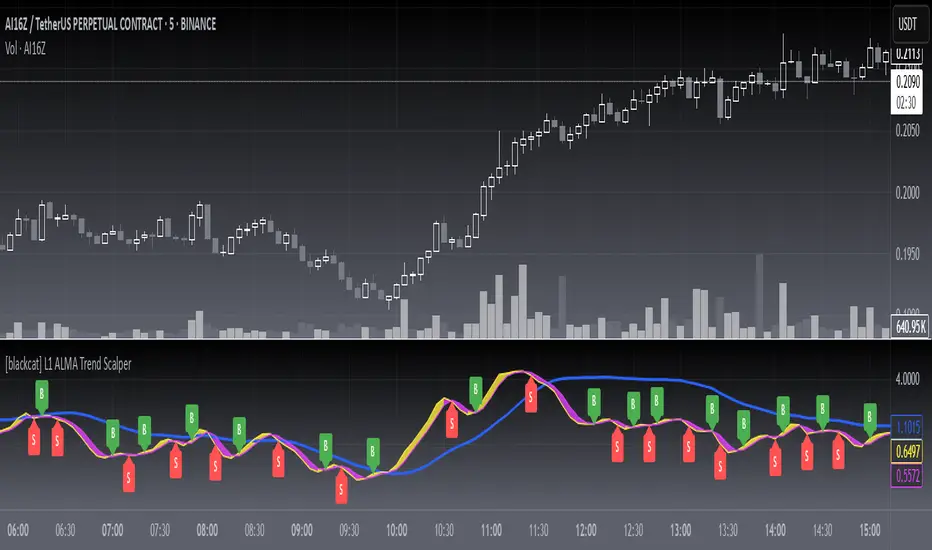
[blackcat] L1 ALMA Trend ScalperLevel: 1
Background
The Arnaud Legoux Moving Average (ALMA) indicator was recently added to the family of moving averages. It was developed in 2009 by Arnaud Legous and Dimitrios Kouzis Loukas. Since then, this indicator has gained huge popularity among traders.
ALMA works like any moving average work. However, the calculation of the ALMA is more perfect compared to the moving average. This indicator has minimal lag which makes it a leading indicator in the market. While the SMA, MA, EMA and SMMA signal line is often delayed. The ALMA was designed to address the two critical disadvantages of traditional moving averages, responsiveness and smoothness.
Function
L1 ALMA Trend Scalper is simple but powerful. This indicator makes full use of ALMA's rapid response advantage to provide buying and selling points by winding and crossing two short-term moving averages. A mid-term moving average can provide relatively effective support and pressure. Finally, the function of whale pump detection is simply realized through the characteristics of the moving average.
Key Signal
trendline --> mid term moving average for support and resistance
tradingline ---> basic element for fast line and slow line
fastline ---> fast line for short term
slowline --> slow line for short term
pumpstart ---> simple whale pump zone detection
Pros and Cons
Pros:
1. Simple but clear to see the trend reversals
2. Aux middle term moving average help just whether it is a true or fake breakout
Cons:
1. No advanced trading skill is incorporated
2. Need improvements on sideways.
Remarks
Just be simple but powerful
Readme
In real life, I am a prolific inventor. I have successfully applied for more than 60 international and regional patents in the past 12 years. But in the past two years or so, I have tried to transfer my creativity to the development of trading strategies. Tradingview is the ideal platform for me. I am selecting and contributing some of the hundreds of scripts to publish in Tradingview community. Welcome everyone to interact with me to discuss these interesting pine scripts.
The scripts posted are categorized into 5 levels according to my efforts or manhours put into these works.
Level 1 : interesting script snippets or distinctive improvement from classic indicators or strategy. Level 1 scripts can usually appear in more complex indicators as a function module or element.
Level 2 : composite indicator/strategy. By selecting or combining several independent or dependent functions or sub indicators in proper way, the composite script exhibits a resonance phenomenon which can filter out noise or fake trading signal to enhance trading confidence level.
Level 3 : comprehensive indicator/strategy. They are simple trading systems based on my strategies. They are commonly containing several or all of entry signal, close signal, stop loss, take profit, re-entry, risk management, and position sizing techniques. Even some interesting fundamental and mass psychological aspects are incorporated.
Level 4 : script snippets or functions that do not disclose source code. Interesting element that can reveal market laws and work as raw material for indicators and strategies. If you find Level 1~2 scripts are helpful, Level 4 is a private version that took me far more efforts to develop.
Level 5 : indicator/strategy that do not disclose source code. private version of Level 3 script with my accumulated script processing skills or a large number of custom functions. I had a private function library built in past two years. Level 5 scripts use many of them to achieve private trading strategy.
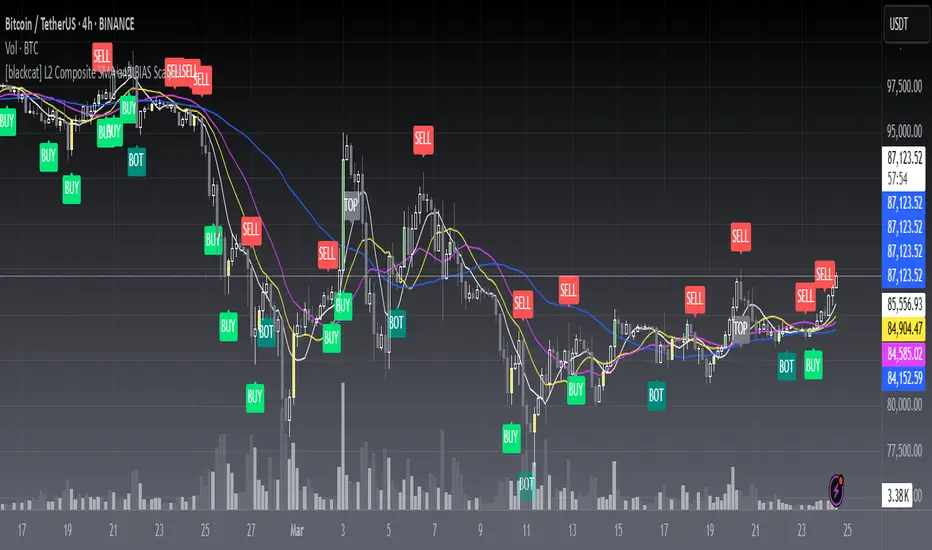
[blackcat] L2 Composite SMA and BIAS ScalperLevel: 2
Background
A simple moving average (SMA) calculates the average of a selected price range, usually closing prices, based on the number of periods in that range. A simple moving average is a technical indicator that can be used to determine whether an asset price is holding a bull, a bear, or is reversing.
The bias shows the moving average rate of deviation. Also known as the rate of deviation, or y-value for short, is an indicator that reflects the degree of deviation between the price and the SMA over a given period by calculating the percentage difference between the market index or the closing price and a moving average to allow for receive that the price reverses or recovers due to a deviation from the moving average trend with strong fluctuations and the price moves within the normal fluctuation range Build credibility to continue the original potential.
Function
L2 Composite SMA and BIAS Scalper is mainly based on a cluster of simple moving averages and their bias values to produce long and short entry points. Three different strategy to generate long and short entries are demostrated together. That is why this is called "Composite".
Key Signal
botsig --> indicating bottom zone
topsig --> indicating top zone
buysigI --> long entry type I
buysigII --> long entry type II
buysigIII --> long entry type III
selsigI --> short entry type I
selsigII --> short entry type II
selsigIII --> short entry type III
Pros and Cons
Pros:
1. common sma(), rsi() and bias() are utizlied to generate exact long and short entries
2. alerts for bottom and top zones
Cons:
1. SMA parameters may need optimization for specific trading pairs
2. No stop loss or take profit scheme is introduced.
Remarks
This is promising but need efforts to refine it.
Readme
In real life, I am a prolific inventor. I have successfully applied for more than 60 international and regional patents in the past 12 years. But in the past two years or so, I have tried to transfer my creativity to the development of trading strategies. Tradingview is the ideal platform for me. I am selecting and contributing some of the hundreds of scripts to publish in Tradingview community. Welcome everyone to interact with me to discuss these interesting pine scripts.
The scripts posted are categorized into 5 levels according to my efforts or manhours put into these works.
Level 1 : interesting script snippets or distinctive improvement from classic indicators or strategy. Level 1 scripts can usually appear in more complex indicators as a function module or element.
Level 2 : composite indicator/strategy. By selecting or combining several independent or dependent functions or sub indicators in proper way, the composite script exhibits a resonance phenomenon which can filter out noise or fake trading signal to enhance trading confidence level.
Level 3 : comprehensive indicator/strategy. They are simple trading systems based on my strategies. They are commonly containing several or all of entry signal, close signal, stop loss, take profit, re-entry, risk management, and position sizing techniques. Even some interesting fundamental and mass psychological aspects are incorporated.
Level 4 : script snippets or functions that do not disclose source code. Interesting element that can reveal market laws and work as raw material for indicators and strategies. If you find Level 1~2 scripts are helpful, Level 4 is a private version that took me far more efforts to develop.
Level 5 : indicator/strategy that do not disclose source code. private version of Level 3 script with my accumulated script processing skills or a large number of custom functions. I had a private function library built in past two years. Level 5 scripts use many of them to achieve private trading strategy.

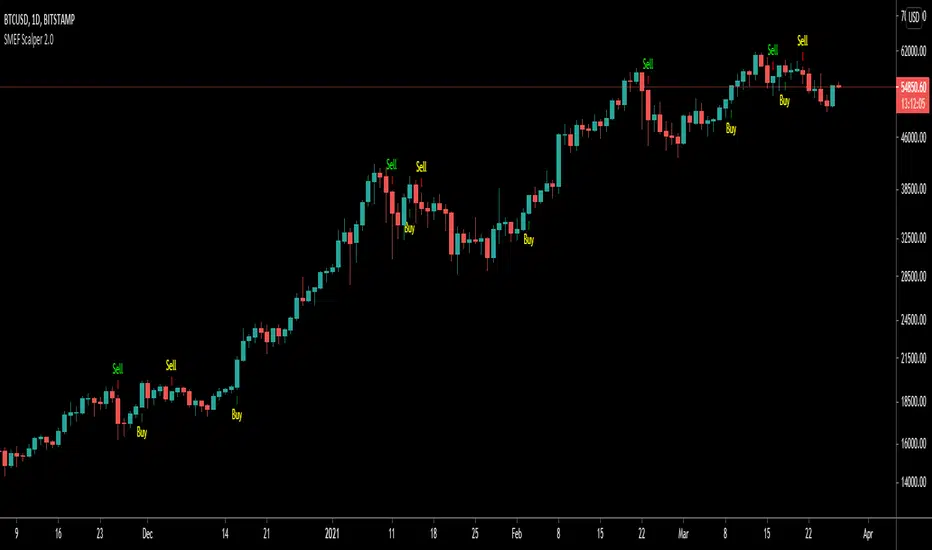
SMEF Scalper 2.0SMEF Scalper 2.0 by shaslund.
Trying to mix some humour into technical trading.
Kudos to Douglas Adams for his great books. Please take some time to read them.
I believe all traders have been SMEF'd now and then...
For the uninitiated: SMEF = 'Spontaneous Massive Existence Failure'.
Methology:
I am combining a TEMA and a volume-weighted average to predict the trend changes (buy/sell).
Features:
Some funny, some useful.
Changes in v2.0:
Removed some garbage and unprotected the code.
Thanks to ChrisMoody, LazyBear and Hpotter for invaluable scripting ideas :-)
Now, go ahead and board the 'Heart of Gold' and enjoy the ride :-)
5 min volume scalperThis scalper try to do it by volumes
The exit either by take profit or the signals, make the TP fit for your need so you will get better exit points
the len control the length so higher will be less signals lower is more
alerts inside
you free to change this code and do what ever you want with it
I hope you can make it better:)

(Alerts+Strategy)Noro's Bands Scalper Strategy v1.6Alerts for @noro strategy
Using with autoview.with.pink

yuthavithi BB Scalper 2 strategyIf you are searching a high win rate strategy with good profit factor ratio strategy. this one may be your choice.
Designed to be used with BTC or LTC. with 5 minute time frame or less. This BB strategy achieve win rate over 50% easily, with some tuning you can get even 60%+.

GLOBAL 3H SCALPING (BTC FILTER)글로벌 멀티 세션 & BTC 필터 고강도 스캘핑 알고리즘 기술 보고서
파인 스크립트 v5의 기술적 패러다임과 알고리즘 트레이딩의 진화
금융 시장의 디지털화가 가속화됨에 따라 개인 트레이더와 기관 투자자 모두 정교한 알고리즘을 활용하여 시장의 비효율성을 포착하려는 시도를 지속하고 있다. 파인 스크립트 v5는 네임스페이스 기반 아키텍처를 도입하여 코드의 가독성과 실행 효율성을 극대화하였습니다. 본 보고서에서는 기존 코드의 구문 오류를 수정하고, 아시아·유럽·미국 세션 및 비트코인(BTC) 커플링 필터를 포함한 최적화된 스크립트를 제공합니다.
🚀 GLOBAL 3H SCALPING (BTC FILTER) 전체 코드
이 코드는 모든 세션(아시아/유럽/미국)의 3시간 골든 아워를 포착하며, 비트코인의 추세가 알트코인과 일치할 때만 신호를 생성하는 '커플링 필터'가 내장된 최종 버전입니다.
Pine Script
//@version=5
indicator("GLOBAL 3H SCALPING (BTC FILTERED)", overlay=true, max_lines_count=300, max_labels_count=100)
//────────────────────
// ⏰ 세션 정의 (한국 시간 KST 기준)
//────────────────────
string tz = "Asia/Seoul"
string asiaSess = "0900-1200"
string euSess = "1600-1900"
string usSess = "2300-0200"
f_getFocus(sessionStr) =>
inSess = not na(time(timeframe.period, sessionStr, tz))
start = inSess and not nz(inSess , false)
float tfInSec = timeframe.in_seconds()
int bars3H = math.max(1, math.round(10800 / tfInSec))
int barsSinceStart = ta.barssince(start)
bool focus = inSess and (not na(barsSinceStart) and barsSinceStart < bars3H)
focus
bool asiaFocus = f_getFocus(asiaSess)
bool euFocus = f_getFocus(euSess)
bool usFocus = f_getFocus(usSess)
bool totalFocus = asiaFocus or euFocus or usFocus
bgcolor(asiaFocus? color.new(color.green, 92) : na, title="Asia Focus")
bgcolor(euFocus? color.new(color.blue, 92) : na, title="EU Focus")
bgcolor(usFocus? color.new(color.red, 92) : na, title="US Focus")
//────────────────────
// 🟠 BTC 커플링 필터 (BTC Trend Filter)
//────────────────────
// 비트코인의 추세를 실시간으로 가져와 알트코인 매매의 안전장치로 활용함
float btcPrice = request.security("BINANCE:BTCUSDT", timeframe.period, close)
float btcEMA = request.security("BINANCE:BTCUSDT", timeframe.period, ta.ema(close, 200))
bool btcBullish = btcPrice > btcEMA
bool btcBearish = btcPrice < btcEMA
//────────────────────
// 📈 기술적 지표 (Altcoin 자체 지표)
//────────────────────
float ema200 = ta.ema(close, 200)
plot(ema200, title="EMA200", color=color.new(color.yellow, 0), linewidth=2)
float vwapVal = ta.vwap(hlc3)
plot(vwapVal, title="VWAP", color=color.new(color.aqua, 0), linewidth=2)
float volMA = ta.sma(volume, 20)
bool volOK = volume > volMA
bool longVWAP = low <= vwapVal and close > vwapVal
bool shortVWAP = high >= vwapVal and close < vwapVal
//────────────────────
// 🚀 진입 조건 (BTC 필터 통합)
//────────────────────
bool longCond = totalFocus and close > ema200 and close > vwapVal and longVWAP and volOK and btcBullish
bool shortCond = totalFocus and close < ema200 and close < vwapVal and shortVWAP and volOK and btcBearish
plotshape(longCond, title="LONG", location=location.belowbar, style=shape.triangleup, size=size.small, color=color.lime, text="LONG")
plotshape(shortCond, title="SHORT", location=location.abovebar, style=shape.triangledown, size=size.small, color=color.red, text="SHORT")
//────────────────────
// 🧠 실시간 통합 대시보드
//────────────────────
var label infoLabel = na
if barstate.islast
label.delete(infoLabel)
string sessName = asiaFocus? "ASIA" : euFocus? "EUROPE" : usFocus? "US" : "WAITING"
string labelText = "GLOBAL ALGO (BTC FILTERED) 🌍\n" +
"--------------------------\n" +
"Active Session: " + sessName + "\n" +
"BTC Trend: " + (btcBullish? "BULLISH 🟢" : "BEARISH 🔴") + "\n" +
"Alt Trend: " + (close > ema200? "BULLISH" : "BEARISH") + "\n" +
"Volume: " + (volOK? "STRONG" : "WEAK")
infoLabel := label.new(
x = bar_index,
y = high,
text = labelText,
style = label.style_label_left,
color = color.new(color.black, 20),
textcolor = color.white
)
📘 Comprehensive User Manual (EN/KR)
1. English: Multi-Session & BTC Filtered Scalping Guide
Core Philosophy
The "Golden Hours" strategy focuses on the first 3 hours of global market openings when volatility and liquidity are at their peak . By filtering altcoin signals with the Bitcoin (BTC) trend, we ensure high-probability entries aligned with the overall market momentum .
Session Schedule (Korea Standard Time - KST)
The indicator highlights three major trading windows :
Asia Focus (Green): 09:00 – 12:00 KST (Tokyo/Seoul opening).
Europe Focus (Blue): 16:00 – 19:00 KST (London opening).
US Focus (Red): 23:00 – 02:00 KST (New York opening).
Trading Rules
Long (Buy) Entry Conditions:
Zone: Price must be within one of the colored Focus Zones.
BTC Filter: BTC must be trading above its EMA 200 (Market Sentiment: Bullish) .
Alt Trend: Altcoin price must be above its own EMA 200.
Value: Price is above VWAP.
Reaction: Candle low touches or dips below VWAP, then closes above it (Pullback) .
Volume: Current volume is higher than the 20-period average.
Short (Sell) Entry Conditions:
Zone: Price must be within one of the colored Focus Zones.
BTC Filter: BTC must be trading below its EMA 200 (Market Sentiment: Bearish).
Alt Trend: Altcoin price must be below its EMA 200.
Value: Price is below VWAP.
Reaction: Candle high touches or goes above VWAP, then closes below it (Rejection).
Volume: Current volume is higher than the 20-period average.
Professional Risk Management
1% Rule: Never risk more than 1% of your total capital on a single trade .
Leverage: Use 1x–5x for beginners, and 5x–20x for advanced traders only with tight stop-losses .
Stop-Loss: Place stop-losses 0.1%–0.5% away from the entry point or at the most recent swing high/low .

200 EMA Scalping 1 Minute (Only Nifty 1 Min Scalping)Only for scalping in 1 minute timeframe in Nifty 50.

Kijun-Sen with Buy / Sell Labels & Alerts - Ichimoku simplifiedI built this indicator for my own scalping style. Maybe it fits yours, too?
Happy scalping!

VIOP Scalping - OriginalVIOP Scalping – Original is a rule-based scalping strategy ported from an original C# logic set. It aims to trade only when trend direction, momentum, and trend strength align, then manages the position using fixed take-profit/stop-loss percentages with an optional trailing mechanism to protect gains during favorable moves.
This strategy is provided for educational and backtesting purposes only. It is not financial advice and does not guarantee profitability. Always test thoroughly before any live usage.
Core Concept
Follow the dominant WMA trend, confirm momentum with EMA separation, filter conditions with RSI + ADX, then exit using fixed TP/SL with trailing behavior after a defined profit threshold.
How the Strategy Works
Trend Direction is defined by WMA: above WMA = long bias, below WMA = short bias.
Momentum is measured via Fast EMA vs Slow EMA and the EMA difference.
Trend Strength is confirmed using ADX (must exceed a threshold).
RSI filters trades to avoid entering when momentum is likely overextended or weak.
A no-trade session blocks entries during a predefined time window (default 09:30–10:05).
Exit logic uses fixed percent TP/SL, with an optional trailing mechanism that activates after a profit threshold.
Inputs and Settings
Trend and Indicator Settings
Main Trend WMA: Determines directional bias (price above = long, price below = short).
Fast EMA / Slow EMA: Used to measure momentum and directional separation.
RSI Period: Filters entries based on RSI range constraints.
ADX Period: Measures trend strength (must exceed threshold to allow entries).
Threshold Settings
EMA Difference Threshold: Minimum EMA separation required to validate momentum.
ADX Threshold: Minimum ADX required to confirm trend strength.
RSI Long Ceiling: RSI must remain below this value for long entries.
RSI Short Floor: RSI must remain above this value for short entries.
Risk Management Settings
Take Profit %: Default TP distance in percent.
Strong Trend Take Profit %: Higher TP used when a “strong trend” condition is detected.
Stop Loss %: Fixed SL distance in percent.
Trailing Activation %: Profit threshold at which trailing starts.
Trailing Distance %: Trailing offset distance used once trailing is active.
Time Filter
No-Trade Hours: Default session is 09:30–10:05. During this window, the strategy does not open new trades.
Entry Logic
No-Trade Time Filter
If the current bar falls inside the no-trade session, entries are blocked.
Long Entry Conditions
Price is above the WMA trend line.
EMA difference is positive and greater than the EMA Difference Threshold.
EMA momentum is increasing (current EMA diff > previous EMA diff).
RSI is within the defined range (RSI > 48 and RSI < RSI Long Ceiling).
Close is higher than the previous close.
ADX is above the ADX Threshold.
Short Entry Conditions
Price is below the WMA trend line.
EMA difference is negative and lower than -EMA Difference Threshold.
Bearish momentum is increasing (current EMA diff < previous EMA diff).
RSI is within the defined range (RSI < 52 and RSI > RSI Short Floor).
Close is lower than the previous close.
ADX is above the ADX Threshold.
Strong Trend Logic (Dynamic TP Selection)
If price is far from the WMA (absolute distance > 20 points) AND EMA separation is strong (absolute EMA diff > 1.5 points), the strategy treats the environment as a strong trend.
In strong trend mode, the strategy uses “Strong Trend Take Profit %” instead of the default “Take Profit %”.
Exit Management (TP/SL + Trailing)
The strategy uses fixed percentage-based TP and SL levels.
Trailing logic is enabled via strategy.exit and activates only after price moves in profit by the defined Trailing Activation %.
Once activated, trailing follows price using the defined Trailing Distance % offset.
This is designed to secure partial gains during extended moves while still allowing room for continuation.
What You See on the Chart
WMA Trend Line (Main Trend Filter).
Fast EMA and Slow EMA (Momentum Confirmation).
Strategy entry/exit markers generated by TradingView.
Recommended Use
Scalping systems that rely on trend-following and momentum confirmation.
Markets where ADX filtering helps avoid choppy conditions.
Traders who want a simple, parameter-driven TP/SL system with trailing after confirmation.
Important Notes
The no-trade session depends on your chart/session settings. Ensure your symbol/session configuration matches your intended market hours.
Percent-based exits scale with price; results will vary across instruments and volatility regimes.
Always validate behavior using bar replay, forward testing, and realistic commission/slippage assumptions.

VIOP Scalping - ATR SNIPERVIOP Scalping – ATR SNIPER is a momentum-based scalping strategy designed to capture short, high-probability moves while keeping risk strictly defined using ATR-based stop-loss and fixed risk/reward targets. The strategy trades only when trend direction, momentum, and strength are aligned.
This script is provided for educational and testing purposes only. It does not guarantee profitability and must be used with proper risk management.
Core Idea
Trade in the direction of the dominant trend, confirm momentum acceleration, and manage risk using ATR-based dynamic stops and targets.
How the Strategy Works
The main trend is defined using a Weighted Moving Average (WMA).
Momentum is measured by the distance and direction between a fast EMA and a slow EMA.
Trend strength is confirmed using ADX.
RSI is used as a filter to avoid weak or overextended market conditions.
Entries are blocked during a predefined no-trade time window to avoid high-noise periods.
Long Entry Conditions
Fast EMA is above Slow EMA and the EMA difference is greater than the minimum threshold.
EMA momentum is increasing compared to the previous bar.
RSI is within the user-defined long range.
Current close is higher than the previous close.
ADX is above the minimum strength threshold.
Price is above the WMA trend line.
The current bar is not inside the no-trade session.
Short Entry Conditions
Fast EMA is below Slow EMA and the EMA difference is below the negative threshold.
Bearish EMA momentum is increasing.
RSI is within the user-defined short range.
Current close is lower than the previous close.
ADX is above the minimum strength threshold.
Price is below the WMA trend line.
The current bar is not inside the no-trade session.
Risk Management – ATR Sniper Logic
Stop-loss distance is calculated as ATR multiplied by the ATR Multiplier.
Take-profit distance is calculated using the defined Risk/Reward ratio.
Stop-loss and take-profit levels are dynamically calculated per trade.
Only one position can be open at any given time.
What You See on the Chart
Weighted Moving Average (WMA) trend line.
Fast EMA and Slow EMA lines.
Dynamic stop-loss line during active trades.
Dynamic take-profit line during active trades.
Recommended Use
Intraday scalping on VİOP instruments.
Momentum-based short-term trading.
Traders who prefer rule-based systems with strict risk control.
Always backtest and forward-test on your own instruments and timeframes before using this strategy in live markets.

4-Hour Range Scalping [v6.3]User Guide: 4-Hour Range Scalping Strategy
Hello! Here is the guide for the Pine Script strategy. Please read it carefully to get the best results.
📈 This script automates the "4-Hour Range Scalping Strategy" from the video.
The main idea is that the first four hours of a major trading day (like New York) set up a "trap zone." The strategy waits for the price to break out of this zone and then fail, giving us a signal that the breakout was false and the price is likely to reverse.
Here’s the simple logic:
Define the Range: It precisely calculates the highest high and lowest low during the first four hours of the selected trading session (e.g., 00:00 to 04:00 New York Time).
Wait for a Breakout: It then monitors the 5-minute chart for a price breakout where a candle fully closes outside of this established range.
Identify the Reversal: The trade trigger occurs when the price fails to continue its breakout and a subsequent 5-minute candle closes back inside the range. This signals a potential reversal or "failed breakout."
Execute the Trade:
]A Short (Sell) trade is triggered after a failed breakout above the range high.
A Long (Buy) trade is triggered after a failed breakout below the range low.
Manage the Risk: The Stop Loss is automatically placed at the peak (for shorts) or trough (for longs) of the breakout move, and the Take Profit is set to a default 2:1 Risk/Reward Ratio.
How to Use the Script (Step-by-Step) ⚙️
Follow these instructions to get it running perfectly.
1. Set Your Chart Timeframe This is the most important step. The strategy is designed to run on a 5-minute (5m) chart. Open your TradingView chart and make sure the timeframe is set to "5m".
2. Add the Script to Your Chart Open the Pine Editor tab at the bottom of TradingView, paste the entire script, and click the "Add to chart" button.
3. Configure the Settings On your chart, find the strategy's name (e.g., "4-Hour Range Scalping ") and click the gear icon ⚙️ to open its settings.
Trading Session: Choose the session for the range. New York is the default and the one from the video.
Risk/Reward Ratio: The default is 2.0, meaning your potential profit is twice your potential loss. You can adjust this to test other targets.
Backtesting Period: To see how the strategy performed on all historical data, go to the "Strategy Tester" panel, click its own gear icon ⚙️, and uncheck the boxes for "Start Date" and "End Date."
4. Understand the Visuals on Your Chart
Blue Background Area: This is the 4-hour calculation window. The script is identifying the day's high and low during this time. No trades will ever happen here.
Red Line (Range High): The highest price of the 4-hour window. This is the upper boundary of the "trap zone."
Green Line (Range Low): The lowest price of the 4-hour window. This is the lower boundary.
Green Triangle (▲): Shows where a Long (Buy) trade was entered.
Red Triangle (▼): Shows where a Short (Sell) trade was entered.
A Very Important Note on Timezones 🕒
This is critical for you in the Philippines (PHT).
The script is based on the New York session, which is 12 hours behind you. Your TradingView chart will still show your local time, but the script works on NY time in the background.
The New York "day" begins at 12:00 PM (Noon) your time.
The script's blue calculation window will be from 12:00 PM to 4:00 PM your local time.
The red and green range lines will appear on your chart only after 4:00 PM your time.
So, if you look at your chart in the morning or early afternoon, you will not see today's range yet. This is normal! The script is just waiting for the New York session to start.
How to Set Up Trade Alerts 🔔
You can have TradingView send you a notification whenever the script enters a trade.
Click the "Alert" button (looks like a clock) in the right-hand toolbar of TradingView.
In the "Condition" dropdown, select the name of the script (e.g., "4-Hour Range Scalping...").
You will then see two options: "Long Signal" and "Short Signal".
Select one (e.g., "Long Signal") and configure how you want to be notified (e.g., "Notify on app").
Click "Create". Repeat the process to create an alert for the other signal.
⚠️ Important Disclosure
For Educational and Research Purposes Only.
This script and all accompanying information are provided for educational and research purposes only. The strategy demonstrated is a technical concept and should not be misconstrued as financial, investment, legal, or tax advice.
Trading financial markets involves substantial risk and is not suitable for every investor. There is a possibility that you could sustain a loss of some or all of your initial investment. Therefore, you should not invest money that you cannot afford to lose.
Past performance is not indicative of future results. The backtesting results shown by this script are historical and do not guarantee future performance. Market conditions are constantly changing.
By using this script, you acknowledge that you are solely responsible for any and all trading decisions you make. You should conduct your own thorough research and, if necessary, seek advice from an independent financial advisor before making any investment decisions. The creators of this script assume no liability for any of your trading results.

Bollinger Adaptive Trend Navigator [QuantAlgo]🟢 Overview
The Bollinger Adaptive Trend Navigator synthesizes volatility channel analysis with variable smoothing mechanics to generate trend identification signals. It uses price positioning within Bollinger Band structures to modify moving average responsiveness, while incorporating ATR calculations to establish trend line boundaries that constrain movement during volatile periods. The adaptive nature makes this indicator particularly valuable for traders and investors working across various asset classes including stocks, forex, commodities, and cryptocurrencies, with effectiveness spanning multiple timeframes from intraday scalping to longer-term position analysis.
🟢 How It Works
The core mechanism calculates price position within Bollinger Bands and uses this positioning to create an adaptive smoothing factor:
bbPosition = bbUpper != bbLower ? (source - bbLower) / (bbUpper - bbLower) : 0.5
adaptiveFactor = (bbPosition - 0.5) * 2 * adaptiveMultiplier * bandWidthRatio
alpha = math.max(0.01, math.min(0.5, 2.0 / (bbPeriod + 1) * (1 + math.abs(adaptiveFactor))))
This adaptive coefficient drives an exponential moving average that responds more aggressively when price approaches Bollinger Band extremes:
var float adaptiveTrend = source
adaptiveTrend := alpha * source + (1 - alpha) * nz(adaptiveTrend , source)
finalTrend = 0.7 * adaptiveTrend + 0.3 * smoothedCenter
ATR-based volatility boundaries constrain the final trend line to prevent excessive movement during volatile periods:
volatility = ta.atr(volatilityPeriod)
upperBound = bollingerTrendValue + (volatility * volatilityMultiplier)
lowerBound = bollingerTrendValue - (volatility * volatilityMultiplier)
The trend line direction determines bullish or bearish states through simple slope comparison, with the final output displaying color-coded signals based on the synthesis of Bollinger positioning, adaptive smoothing, and volatility constraints (green = long/buy, red = short/sell).
🟢 Signal Interpretation
Rising Trend Line (Green): Indicates upward direction based on Bollinger positioning and adaptive smoothing = Potential long/buy opportunity
Falling Trend Line (Red): Indicates downward direction based on Bollinger positioning and adaptive smoothing = Potential short/sell opportunity
Built-in Alert System: Automated notifications trigger when bullish or bearish states change, allowing you to act on significant development without constantly monitoring the charts
Candle Coloring: Optional feature applies trend colors to price bars for visual consistency
Configuration Presets: Three parameter sets available - Default (standard settings), Scalping (faster response), and Swing Trading (slower response)
