Order Flow RSI - Price / CVD / OIOrder Flow RSI blends three powerful market perspectives — Price , Cumulative Volume Delta (CVD) , and Open Interest (OI) — into one unified RSI-style oscillator.
It reveals momentum and imbalance across these data streams and highlights situations where participation, liquidity, and positioning disagree — moments that often precede reversals.
What it does
The indicator converts:
Price → RSI (classic momentum),
CVD → RSI (buy/sell pressure balance),
OI → RSI (position expansion/contraction)
…then plots all three RSIs together on the same 0–100 scale.
A fourth Consensus RSI (average of any two or all three) can optionally be shown to simplify the view.
Core logic
CVD engine – based on TradingView’s native volume-delta request.
Modes: Continuous (default, smooth line), Anchored (resets each session), Rolling window.
Open Interest – pulled automatically from the symbol’s “_OI” feed; aligns to chart timeframe for real-time flow.
RSI calculation – standard RSI applied to each data stream, optionally smoothed (SMA / EMA / RMA / WMA / VWMA).
Signals – optional background highlights when:
All three RSIs are overbought (red) or oversold (green), or
Any pair show opposite extremes (e.g., price overbought + OI oversold).
Consensus RSI – arithmetic mean of the selected RSIs, summarizing overall market tone.
Inputs overview
CVD settings: anchor period, lower-TF delta, mode, rolling length
RSI lengths: separate for price, CVD, OI
Smoothing: type + period applied to all RSIs at once
Consensus: choose which RSIs to average
Signals: enable/disable each combination; optional alerts
Levels: adjustable OB/MID/OS (default 70 / 50 / 30)
Visuals: fill between active RSIs, background highlights, level lines, colors in Style tab
How to read it
All 3 overbought (red): broad exhaustion → possible correction
All 3 oversold (green): broad depletion → possible bounce
Opposite pairs: divergence between price and participation
Price↑ but OI↓ (red) → weak rally, fading participation
Price↓ but CVD↑ (green) → hidden accumulation
Combine with structure and volume profile for confirmation.
Notes
Works best on assets with full CVD + OI data (futures, BTC, etc.).
Use Continuous CVD for smooth RSI, Anchored for session analysis.
Smoothing 2–5 EMA is a good starting point to reduce noise.
All styling (colors, line types, thickness) is adjustable in the Style tab.
Limitations & caveats
CVD requires accurate tick/volume/delta data from your data feed. Performance may differ across instruments.
OI availability varies by exchange / symbol. Where OI is absent, pairwise OI signals are not evaluated.
This indicator is a tool — it generates signals of interest, not guaranteed profitable trades. Backtest and combine with your risk rules.
Smoothing introduces lag; longer smoothing reduces noise but delays signals.
Order Flow RSI bridges traditional momentum analysis and order-flow context — giving a multi-dimensional view of when markets are truly stretched or quietly reloading.
Sometimes it works, sometimes it doesn't.
ค้นหาในสคริปต์สำหรับ "rma"

Bollinger Band Screener [Pineify]Multi-Symbol Bollinger Band Screener Pineify – Advanced Multi-Timeframe Market Analysis
Unlock the power of rapid, multi-asset scanning with this original TradingView Pine Script. Expose trends, volatility, and reversals across your favorite tickers—all in a single, customizable dashboard.
Key Features
Screens up to 8 symbols simultaneously with individual controls.
Covers 4 distinct timeframes per symbol for robust, multi-timeframe analysis.
Integrates advanced Bollinger Band logic, adaptable with 11+ moving average types (SMA, EMA, RMA, HMA, WMA, VWMA, TMA, VAR, WWMA, ZLEMA, and TSF).
Visualizes precise state changes: Open/Parallel Uptrends & Downtrends, Consolidation, Breakouts, and more.
Highly interactive table view for instant signal interpretation and actionable alerts.
Flexible to any market: crypto, stocks, forex, indices, and commodities.
How It Works
For each chosen symbol and timeframe, the script calculates Bollinger Bands using your specified source, length, standard deviation, and moving average method.
Real-time state recognition assigns one of several states (Open Rising, Open Falling, Parallel Rising, Parallel Falling), painting the table with unique color codes.
State detection is rigorously defined: e.g., “Open Rising” is set when both bands and the basis rise, indicating strong up momentum.
All bands, signals, and strategies dynamically update as new bars print or user inputs change.
Trading Ideas and Insights
Identify volatility expansions and compressions instantly, spotting breakouts and breakdowns before they play out.
Spot multi-timeframe confluences—when trends align across several TFs, conviction increases for potential trades.
Trade reversals or continuations based on unique Bollinger Band patterns, such as squeeze-break or persistent parallel moves.
Harness this tool for scalping, swing trading, or systematic portfolio screens—your logic, your edge!
How Multiple Indicators Work Together
This screener’s core strength is its integration of multiple moving average types into Bollinger Band construction, not just standard SMA. Each average adapts the bands’ responsiveness to trend and noise, so traders can select the underlying logic that matches their market environment (e.g., HMA for fast moves or ZLEMA for smoothed lag). Overlaying 4 timeframes per symbol ensures trends, reversals, and volatility shifts never slip past your radar. When all MAs and bands synchronize across symbols and TFs, it becomes easy to separate real opportunity from market noise.
Unique Aspects
Perhaps the most flexible Bollinger Band screener for TradingView—choose from over 10 moving average methods.
Powerful multi-timeframe and multi-asset design, rare among Pine scripts.
Immediate visual clarity with color-coded table cells indicating band state—no need for guesswork or chart clutter.
Custom configuration for each asset and time slice to suit any trading style.
How to Use
Add the script to your TradingView chart.
Use the user-friendly input settings to specify up to 8 symbols and 4 timeframes each.
Customize the Bollinger Band parameters: source (price type), band length, standard deviation, and type of moving average.
Interpret the dashboard: Color codes and “state” abbreviations show you instantly which symbols and timeframes are trending, consolidating, or breaking out.
Take trades according to your strategy, using the screener as a confirmation or primary scan tool.
Customization
Fully customize: symbols, timeframes, source, band length, standard deviation multiplier, and moving average type.
Supports intricate watchlists—anything TradingView allows, this script tracks.
Adapt for cryptos, equities, forex, or derivatives by changing symbol inputs.
Conclusion
The Multi-Symbol Bollinger Band Screener “Pineify” is a comprehensive, SEO-optimized Pine Script tool to supercharge your market scanning, trend spotting, and decision-making on TradingView. Whether you trade crypto, stocks, or forex—its fast, intuitive, multi-timeframe dashboard gives you the informational edge to stay ahead of the market.
Try it now to streamline your trading workflow and see all the bands, all the trends, all the time!

Luxy Momentum, Trend, Bias and Breakout Indicators V7
TABLE OF CONTENTS
This is Version 7 (V7) - the latest and most optimized release. If you are using any older versions (V6, V5, V4, V3, etc.), it is highly recommended to replace them with V7.
Why This Indicator is Different
Who Should Use This
Core Components Overview
The UT Bot Trading System
Understanding the Market Bias Table
Candlestick Pattern Recognition
Visual Tools and Features
How to Use the Indicator
Performance and Optimization
FAQ
---
### CREDITS & ATTRIBUTION
This indicator implements proven trading concepts using entirely original code developed specifically for this project.
### CONCEPTUAL FOUNDATIONS
• UT Bot ATR Trailing System
- Original concept by @QuantNomad: (search "UT-Bot-Strategy"
- Our version is a complete reimplementation with significant enhancements:
- Volume-weighted momentum adjustment
- Composite stop loss from multiple S/R layers
- Multi-filter confirmation system (swing, %, 2-bar, ZLSMA)
- Full integration with multi-timeframe bias table
- Visual audit trail with freeze-on-touch
- NOTE: No code was copied - this is a complete reimplementation with enhancements.
• Standard Technical Indicators (Public Domain Formulas):
- Supertrend: ATR-based trend calculation with custom gradient fills
- MACD: Gerald Appel's formula with separation filters
- RSI: J. Welles Wilder's formula with pullback zone logic
- ADX/DMI: Custom trend strength formula inspired by Wilder's directional movement concept, reimplemented with volume weighting and efficiency metrics
- ZLSMA: Zero-lag formula enhanced with Hull MA and momentum prediction
### Custom Implementations
- Trend Strength: Inspired by Wilder's ADX concept but using volume-weighted pressure calculation and efficiency metrics (not traditional +DI/-DI smoothing)
- All code implementations are original
### ORIGINAL FEATURES (70%+ of codebase)
- Multi-Timeframe Bias Table with live updates
- Risk Management System (R-multiple TPs, freeze-on-touch)
- Opening Range Breakout tracker with session management
- Composite Stop Loss calculator using 6+ S/R layers
- Performance optimization system (caching, conditional calcs)
- VIX Fear Index integration
- Previous Day High/Low auto-detection
- Candlestick pattern recognition with interactive tooltips
- Smart label and visual management
- All UI/UX design and table architecture
### DEVELOPMENT PROCESS
**AI Assistance:** This indicator was developed over 2+ months with AI assistance (ChatGPT/Claude) used for:
- Writing Pine Script code based on design specifications
- Optimizing performance and fixing bugs
- Ensuring Pine Script v6 compliance
- Generating documentation
**Author's Role:** All trading concepts, system design, feature selection, integration logic, and strategic decisions are original work by the author. The AI was a coding tool, not the system designer.
**Transparency:** We believe in full disclosure - this project demonstrates how AI can be used as a powerful development tool while maintaining creative and strategic ownership.
---
1. WHY THIS INDICATOR IS DIFFERENT
Most traders use multiple separate indicators on their charts, leading to cluttered screens, conflicting signals, and analysis paralysis. The Suite solves this by integrating proven technical tools into a single, cohesive system.
Key Advantages:
All-in-One Design: Instead of loading 5-10 separate indicators, you get everything in one optimized script. This reduces chart clutter and improves TradingView performance.
Multi-Timeframe Bias Table: Unlike standard indicators that only show the current timeframe, the Bias Table aggregates trend signals across multiple timeframes simultaneously. See at a glance whether 1m, 5m, 15m, 1h are aligned bullish or bearish - no more switching between charts.
Smart Confirmations: The indicator doesn't just give signals - it shows you WHY. Every entry has multiple layers of confirmation (MA cross, MACD momentum, ADX strength, RSI pullback, volume, etc.) that you can toggle on/off.
Dynamic Stop Loss System: Instead of static ATR stops, the SL is calculated from multiple support/resistance layers: UT trailing line, Supertrend, VWAP, swing structure, and MA levels. This creates more intelligent, price-action-aware stops.
R-Multiple Take Profits: Built-in TP system calculates targets based on your initial risk (1R, 1.5R, 2R, 3R). Lines freeze when touched with visual checkmarks, giving you a clean audit trail of partial exits.
Educational Tooltips Everywhere: Every single input has detailed tooltips explaining what it does, typical values, and how it impacts trading. You're not guessing - you're learning as you configure.
Performance Optimized: Smart caching, conditional calculations, and modular design mean the indicator runs fast despite having 15+ features. Turn off what you don't use for even better performance.
No Repainting: All signals respect bar close. Alerts fire correctly. What you see in history is what you would have gotten in real-time.
What Makes It Unique:
Integrated UT Bot + Bias Table: No other indicator combines UT Bot's ATR trailing system with a live multi-timeframe dashboard. You get precision entries with macro trend context.
Candlestick Pattern Recognition with Interactive Tooltips: Patterns aren't just marked - hover over any emoji for a full explanation of what the pattern means and how to trade it.
Opening Range Breakout Tracker: Built-in ORB system for intraday traders with customizable session times and real-time status updates in the Bias Table.
Previous Day High/Low Auto-Detection: Automatically plots PDH/PDL on intraday charts with theme-aware colors. Updates daily without manual input.
Dynamic Row Labels in Bias Table: The table shows your actual settings (e.g., "EMA 10 > SMA 20") not generic labels. You know exactly what's being evaluated.
Modular Filter System: Instead of forcing a fixed methodology, the indicator lets you build your own strategy. Start with just UT Bot, add filters one at a time, test what works for your style.
---
2. WHO WHOULD USE THIS
Designed For:
Intermediate to Advanced Traders: You understand basic technical analysis (MAs, RSI, MACD) and want to combine multiple confirmations efficiently. This isn't a "one-click profit" system - it's a professional toolkit.
Multi-Timeframe Traders: If you trade one asset but check multiple timeframes for confirmation (e.g., enter on 5m after checking 15m and 1h alignment), the Bias Table will save you hours every week.
Trend Followers: The indicator excels at identifying and following trends using UT Bot, Supertrend, and MA systems. If you trade breakouts and pullbacks in trending markets, this is built for you.
Intraday and Swing Traders: Works equally well on 5m-1h charts (day trading) and 4h-D charts (swing trading). Scalpers can use it too with appropriate settings adjustments.
Discretionary Traders: This isn't a black-box system. You see all the components, understand the logic, and make final decisions. Perfect for traders who want tools, not automation.
Works Across All Markets:
Stocks (US, international)
Cryptocurrency (24/7 markets supported)
Forex pairs
Indices (SPY, QQQ, etc.)
Commodities
NOT Ideal For :
Complete Beginners: If you don't know what a moving average or RSI is, start with basics first. This indicator assumes foundational knowledge.
Algo Traders Seeking Black Box: This is discretionary. Signals require context and confirmation. Not suitable for blind automated execution.
Mean-Reversion Only Traders: The indicator is trend-following at its core. While VWAP bands support mean-reversion, the primary methodology is trend continuation.
---
3. CORE COMPONENTS OVERVIEW
The indicator combines these proven systems:
Trend Analysis:
Moving Averages: Four customizable MAs (Fast, Medium, Medium-Long, Long) with six types to choose from (EMA, SMA, WMA, VWMA, RMA, HMA). Mix and match for your style.
Supertrend: ATR-based trend indicator with unique gradient fill showing trend strength. One-sided ribbon visualization makes it easier to see momentum building or fading.
ZLSMA : Zero-lag linear-regression smoothed moving average. Reduces lag compared to traditional MAs while maintaining smooth curves.
Momentum & Filters:
MACD: Standard MACD with separation filter to avoid weak crossovers.
RSI: Pullback zone detection - only enter longs when RSI is in your defined "buy zone" and shorts in "sell zone".
ADX/DMI: Trend strength measurement with directional filter. Ensures you only trade when there's actual momentum.
Volume Filter: Relative volume confirmation - require above-average volume for entries.
Donchian Breakout: Optional channel breakout requirement.
Signal Systems:
UT Bot: The primary signal generator. ATR trailing stop that adapts to volatility and gives clear entry/exit points.
Base Signals: MA cross system with all the above filters applied. More conservative than UT Bot alone.
Market Bias Table: Multi-timeframe dashboard showing trend alignment across 7 timeframes plus macro bias (3-day, weekly, monthly, quarterly, VIX).
Candlestick Patterns: Six major reversal patterns auto-detected with interactive tooltips.
ORB Tracker: Opening range high/low with breakout status (intraday only).
PDH/PDL: Previous day levels plotted automatically on intraday charts.
VWAP + Bands : Session-anchored VWAP with up to three standard deviation band pairs.
---
4. THE UT BOT TRADING SYSTEM
The UT Bot is the heart of the indicator's signal generation. It's an advanced ATR trailing stop that adapts to market volatility.
Why UT Bot is Superior to Fixed Stops:
Traditional ATR stops use a fixed multiplier (e.g., "stop = entry - 2×ATR"). UT Bot is smarter:
It TRAILS the stop as price moves in your favor
It WIDENS during high volatility to avoid premature stops
It TIGHTENS during consolidation to lock in profits
It FLIPS when price breaks the trailing line, signaling reversals
Visual Elements You'll See:
Orange Trailing Line: The actual UT stop level that adapts bar-by-bar
Buy/Sell Labels: Aqua triangle (long) or orange triangle (short) when the line flips
ENTRY Line: Horizontal line at your entry price (optional, can be turned off)
Suggested Stop Loss: A composite SL calculated from multiple support/resistance layers:
- UT trailing line
- Supertrend level
- VWAP
- Swing structure (recent lows/highs)
- Long-term MA (200)
- ATR-based floor
Take Profit Lines: TP1, TP1.5, TP2, TP3 based on R-multiples. When price touches a TP, it's marked with a checkmark and the line freezes for audit trail purposes.
Status Messages: "SL Touched ❌" or "SL Frozen" when the trade leg completes.
How UT Bot Differs from Other ATR Systems:
Multiple Filters Available: You can require 2-bar confirmation, minimum % price change, swing structure alignment, or ZLSMA directional filter. Most UT implementations have none of these.
Smart SL Calculation: Instead of just using the UT line as your stop, the indicator suggests a better SL based on actual support/resistance. This prevents getting stopped out by wicks while keeping risk controlled.
Visual Audit Trail: All SL/TP lines freeze when touched with clear markers. You can review your trades weeks later and see exactly where entries, stops, and targets were.
Performance Options: "Draw UT visuals only on bar close" lets you reduce rendering load without affecting logic or alerts - critical for slower machines or 1m charts.
Trading Logic:
UT Bot flips direction (Buy or Sell signal appears)
Check Bias Table for multi-timeframe confirmation
Optional: Wait for Base signal or candlestick pattern
Enter at signal bar close or next bar open
Place stop at "Suggested Stop Loss" line
Scale out at TP levels (TP1, TP2, TP3)
Exit remaining position on opposite UT signal or stop hit
---
5. UNDERSTANDING THE MARKET BIAS TABLE
This is the indicator's unique multi-timeframe intelligence layer. Instead of looking at one chart at a time, the table aggregates signals across seven timeframes plus macro trend bias.
Why Multi-Timeframe Analysis Matters:
Professional traders check higher and lower timeframes for context:
Is the 1h uptrend aligning with my 5m entry?
Are all short-term timeframes bullish or just one?
Is the daily trend supportive or fighting me?
Doing this manually means opening multiple charts, checking each indicator, and making mental notes. The Bias Table does it automatically in one glance.
Table Structure:
Header Row:
On intraday charts: 1m, 5m, 15m, 30m, 1h, 2h, 4h (toggle which ones you want)
On daily+ charts: D, W, M (automatic)
Green dot next to title = live updating
Headline Rows - Macro Bias:
These show broad market direction over longer periods:
3 Day Bias: Trend over last 3 trading sessions (uses 1h data)
Weekly Bias: Trend over last 5 trading sessions (uses 4h data)
Monthly Bias: Trend over last 30 daily bars
Quarterly Bias: Trend over last 13 weekly bars
VIX Fear Index: Market regime based on VIX level - bullish when low, bearish when high
Opening Range Breakout: Status of price vs. session open range (intraday only)
These rows show text: "BULLISH", "BEARISH", or "NEUTRAL"
Indicator Rows - Technical Signals:
These evaluate your configured indicators across all active timeframes:
Fast MA > Medium MA (shows your actual MA settings, e.g., "EMA 10 > SMA 20")
Price > Long MA (e.g., "Price > SMA 200")
Price > VWAP
MACD > Signal
Supertrend (up/down/neutral)
ZLSMA Rising
RSI In Zone
ADX ≥ Minimum
These rows show emojis: GREEB (bullish), RED (bearish), GRAY/YELLOW (neutral/NA)
AVG Column:
Shows percentage of active timeframes that are bullish for that row. This is the KEY metric:
AVG > 70% = strong multi-timeframe bullish alignment
AVG 40-60% = mixed/choppy, no clear trend
AVG < 30% = strong multi-timeframe bearish alignment
How to Use the Table:
For a long trade:
Check AVG column - want to see > 60% ideally
Check headline bias rows - want to see BULLISH, not BEARISH
Check VIX row - bullish market regime preferred
Check ORB row (intraday) - want ABOVE for longs
Scan indicator rows - more green = better confirmation
For a short trade:
Check AVG column - want to see < 40% ideally
Check headline bias rows - want to see BEARISH, not BULLISH
Check VIX row - bearish market regime preferred
Check ORB row (intraday) - want BELOW for shorts
Scan indicator rows - more red = better confirmation
When AVG is 40-60%:
Market is choppy, mixed signals. Either stay out or reduce position size significantly. These are low-probability environments.
Unique Features:
Dynamic Labels: Row names show your actual settings (e.g., "EMA 10 > SMA 20" not generic "Fast > Slow"). You know exactly what's being evaluated.
Customizable Rows: Turn off rows you don't care about. Only show what matters to your strategy.
Customizable Timeframes: On intraday charts, disable 1m or 4h if you don't trade them. Reduces calculation load by 20-40%.
Automatic HTF Handling: On Daily/Weekly/Monthly charts, the table automatically switches to D/W/M columns. No configuration needed.
Performance Smart: "Hide BIAS table on 1D or above" option completely skips all table calculations on higher timeframes if you only trade intraday.
---
6. CANDLESTICK PATTERN RECOGNITION
The indicator automatically detects six major reversal patterns and marks them with emojis at the relevant bars.
Why These Six Patterns:
These are the most statistically significant reversal patterns according to trading literature:
High win rate when appearing at support/resistance
Clear visual structure (not subjective)
Work across all timeframes and assets
Studied extensively by institutions
The Patterns:
Bullish Patterns (appear at bottoms):
Bullish Engulfing: Green candle completely engulfs prior red candle's body. Strong reversal signal.
Hammer: Small body with long lower wick (at least 2× body size). Shows rejection of lower prices by buyers.
Morning Star: Three-candle pattern (large red → small indecision → large green). Very strong bottom reversal.
Bearish Patterns (appear at tops):
Bearish Engulfing: Red candle completely engulfs prior green candle's body. Strong reversal signal.
Shooting Star: Small body with long upper wick (at least 2× body size). Shows rejection of higher prices by sellers.
Evening Star: Three-candle pattern (large green → small indecision → large red). Very strong top reversal.
Interactive Tooltips:
Unlike most pattern indicators that just draw shapes, this one is educational:
Hover your mouse over any pattern emoji
A tooltip appears explaining: what the pattern is, what it means, when it's most reliable, and how to trade it
No need to memorize - learn as you trade
Noise Filter:
"Min candle body % to filter noise" setting prevents false signals:
Patterns require minimum body size relative to price
Filters out tiny candles that don't represent real buying/selling pressure
Adjust based on asset volatility (higher % for crypto, lower for low-volatility stocks)
How to Trade Patterns:
Patterns are NOT standalone entry signals. Use them as:
Confirmation: UT Bot gives signal + pattern appears = stronger entry
Reversal Warning: In a trade, opposite pattern appears = consider tightening stop or taking profit
Support/Resistance Validation: Pattern at key level (PDH, VWAP, MA 200) = level is being respected
Best combined with:
UT Bot or Base signal in same direction
Bias Table alignment (AVG > 60% or < 40%)
Appearance at obvious support/resistance
---
7. VISUAL TOOLS AND FEATURES
VWAP (Volume Weighted Average Price):
Session-anchored VWAP with standard deviation bands. Shows institutional "fair value" for the trading session.
Anchor Options: Session, Day, Week, Month, Quarter, Year. Choose based on your trading timeframe.
Bands: Up to three pairs (X1, X2, X3) showing statistical deviation. Price at outer bands often reverses.
Auto-Hide on HTF: VWAP hides on Daily/Weekly/Monthly charts automatically unless you enable anchored mode.
Use VWAP as:
Directional bias (above = bullish, below = bearish)
Mean reversion levels (outer bands)
Support/resistance (the VWAP line itself)
Previous Day High/Low:
Automatically plots yesterday's high and low on intraday charts:
Updates at start of each new trading day
Theme-aware colors (dark text for light charts, light text for dark charts)
Hidden automatically on Daily/Weekly/Monthly charts
These levels are critical for intraday traders - institutions watch them closely as support/resistance.
Opening Range Breakout (ORB):
Tracks the high/low of the first 5, 15, 30, or 60 minutes of the trading session:
Customizable session times (preset for NYSE, LSE, TSE, or custom)
Shows current breakout status in Bias Table row (ABOVE, BELOW, INSIDE, BUILDING)
Intraday only - auto-disabled on Daily+ charts
ORB is a classic day trading strategy - breakout above opening range often leads to continuation.
Extra Labels:
Change from Open %: Shows how far price has moved from session open (intraday) or daily open (HTF). Green if positive, red if negative.
ADX Badge: Small label at bottom of last bar showing current ADX value. Green when above your minimum threshold, red when below.
RSI Badge: Small label at top of last bar showing current RSI value with zone status (buy zone, sell zone, or neutral).
These labels provide quick at-a-glance confirmation without needing separate indicator windows.
---
8. HOW TO USE THE INDICATOR
Step 1: Add to Chart
Load the indicator on your chosen asset and timeframe
First time: Everything is enabled by default - the chart will look busy
Don't panic - you'll turn off what you don't need
Step 2: Start Simple
Turn OFF everything except:
UT Bot labels (keep these ON)
Bias Table (keep this ON)
Moving Averages (Fast and Medium only)
Suggested Stop Loss and Take Profits
Hide everything else initially. Get comfortable with the basic UT Bot + Bias Table workflow first.
Step 3: Learn the Core Workflow
UT Bot gives a Buy or Sell signal
Check Bias Table AVG column - do you have multi-timeframe alignment?
If yes, enter the trade
Place stop at Suggested Stop Loss line
Scale out at TP levels
Exit on opposite UT signal
Trade this simple system for a week. Get a feel for signal frequency and win rate with your settings.
Step 4: Add Filters Gradually
If you're getting too many losing signals (whipsaws in choppy markets), add filters one at a time:
Try: "Require 2-Bar Trend Confirmation" - wait for 2 bars to confirm direction
Try: ADX filter with minimum threshold - only trade when trend strength is sufficient
Try: RSI pullback filter - only enter on pullbacks, not chasing
Try: Volume filter - require above-average volume
Add one filter, test for a week, evaluate. Repeat.
Step 5: Enable Advanced Features (Optional)
Once you're profitable with the core system, add:
Supertrend for additional trend confirmation
Candlestick patterns for reversal warnings
VWAP for institutional anchor reference
ORB for intraday breakout context
ZLSMA for low-lag trend following
Step 6: Optimize Settings
Every setting has a detailed tooltip explaining what it does and typical values. Hover over any input to read:
What the parameter controls
How it impacts trading
Suggested ranges for scalping, day trading, and swing trading
Start with defaults, then adjust based on your results and style.
Step 7: Set Up Alerts
Right-click chart → Add Alert → Condition: "Luxy Momentum v6" → Choose:
"UT Bot — Buy" for long entries
"UT Bot — Sell" for short entries
"Base Long/Short" for filtered MA cross signals
Optionally enable "Send real-time alert() on UT flip" in settings for immediate notifications.
Common Workflow Variations:
Conservative Trader:
UT signal + Base signal + Candlestick pattern + Bias AVG > 70%
Enter only at major support/resistance
Wider UT sensitivity, multiple filters
Aggressive Trader:
UT signal + Bias AVG > 60%
Enter immediately, no waiting
Tighter UT sensitivity, minimal filters
Swing Trader:
Focus on Daily/Weekly Bias alignment
Ignore intraday noise
Use ORB and PDH/PDL less (or not at all)
Wider stops, patient approach
---
9. PERFORMANCE AND OPTIMIZATION
The indicator is optimized for speed, but with 15+ features running simultaneously, chart load time can add up. Here's how to keep it fast:
Biggest Performance Gains:
Disable Unused Timeframes: In "Time Frames" settings, turn OFF any timeframe you don't actively trade. Each disabled TF saves 10-15% calculation time. If you only day trade 5m, 15m, 1h, disable 1m, 2h, 4h.
Hide Bias Table on Daily+: If you only trade intraday, enable "Hide BIAS table on 1D or above". This skips ALL table calculations on higher timeframes.
Draw UT Visuals Only on Bar Close: Reduces intrabar rendering of SL/TP/Entry lines. Has ZERO impact on logic or alerts - purely visual optimization.
Additional Optimizations:
Turn off VWAP bands if you don't use them
Disable candlestick patterns if you don't trade them
Turn off Supertrend fill if you find it distracting (keep the line)
Reduce "Limit to 10 bars" for SL/TP lines to minimize line objects
Performance Features Built-In:
Smart Caching: Higher timeframe data (3-day bias, weekly bias, etc.) updates once per day, not every bar
Conditional Calculations: Volume filter only calculates when enabled. Swing filter only runs when enabled. Nothing computes if turned off.
Modular Design: Every component is independent. Turn off what you don't need without breaking other features.
Typical Load Times:
5m chart, all features ON, 7 timeframes: ~2-3 seconds
5m chart, core features only, 3 timeframes: ~1 second
1m chart, all features: ~4-5 seconds (many bars to calculate)
If loading takes longer, you likely have too many indicators on the chart total (not just this one).
---
10. FAQ
Q: How is this different from standard UT Bot indicators?
A: Standard UT Bot (originally by @QuantNomad) is just the ATR trailing line and flip signals. This implementation adds:
- Volume weighting and momentum adjustment to the trailing calculation
- Multiple confirmation filters (swing, %, 2-bar, ZLSMA)
- Smart composite stop loss system from multiple S/R layers
- R-multiple take profit system with freeze-on-touch
- Integration with multi-timeframe Bias Table
- Visual audit trail with checkmarks
Q: Can I use this for automated trading?
A: The indicator is designed for discretionary trading. While it has clear signals and alerts, it's not a mechanical system. Context and judgment are required.
Q: Does it repaint?
A: No. All signals respect bar close. UT Bot logic runs intrabar but signals only trigger on confirmed bars. Alerts fire correctly with no lookahead.
Q: Do I need to use all the features?
A: Absolutely not. The indicator is modular. Many profitable traders use just UT Bot + Bias Table + Moving Averages. Start simple, add complexity only if needed.
Q: How do I know which settings to use?
A: Every single input has a detailed tooltip. Hover over any setting to see:
What it does
How it affects trading
Typical values for scalping, day trading, swing trading
Start with defaults, adjust gradually based on results.
Q: Can I use this on crypto 24/7 markets?
A: Yes. ORB will not work (no defined session), but everything else functions normally. Use "Day" anchor for VWAP instead of "Session".
Q: The Bias Table is blank or not showing.
A: Check:
"Show Table" is ON
Table position isn't overlapping another indicator's table (change position)
At least one row is enabled
"Hide BIAS table on 1D or above" is OFF (if on Daily+ chart)
Q: Why are candlestick patterns not appearing?
A: Patterns are relatively rare by design - they only appear at genuine reversal points. Check:
Pattern toggles are ON
"Min candle body %" isn't too high (try 0.05-0.10)
You're looking at a chart with actual reversals (not strong trending market)
Q: UT Bot is too sensitive/not sensitive enough.
A: Adjust "Sensitivity (Key×ATR)". Lower number = tighter stop, more signals. Higher number = wider stop, fewer signals. Read the tooltip for guidance.
Q: Can I get alerts for the Bias Table?
A: The Bias Table is a dashboard for visual analysis, not a signal generator. Set alerts on UT Bot or Base signals, then manually check Bias Table for confirmation.
Q: Does this work on stocks with low volume?
A: Yes, but turn OFF the volume filter. Low volume stocks will never meet relative volume requirements.
Q: How often should I check the Bias Table?
A: Before every entry. It takes 2 seconds to glance at the AVG column and headline rows. This one check can save you from fighting the trend.
Q: What if UT signal and Base signal disagree?
A: UT Bot is more aggressive (ATR trailing). Base signals are more conservative (MA cross + filters). If they disagree, either:
Wait for both to align (safest)
Take the UT signal but with smaller size (aggressive)
Skip the trade (conservative)
There's no "right" answer - depends on your risk tolerance.
---
FINAL NOTES
The indicator gives you an edge. How you use that edge determines results.
For questions, feedback, or support, comment on the indicator page or message the author.
Happy Trading!

- Standardized Money Flow Index with Multi-MA and BB OverlayThis custom Money Flow Index (MFI) script enhances the standard MFI by introducing multiple layers of configurability, statistical normalization, and visual clarity. It begins with the traditional MFI calculation using the average price, hlc3, and a user-defined length, then offers the option to standardize the output. Standardization transforms the MFI into a z-score by subtracting a rolling mean and dividing by a rolling standard deviation, making the indicator statistically interpretable across different assets, timeframes, and volatility regimes. When standardization is active, the overbought and oversold thresholds shift from the conventional 80 and 20 to +2 and –2, aligning them with standard deviation boundaries and improving signal clarity in volatile environments.
Beyond standardization, the script introduces a robust smoothing engine. Users can choose from several moving average types, including SMA, EMA, SMMA (RMA), WMA, and VWMA, to reduce noise and highlight trend shifts. A particularly advanced option is the “SMA + Bollinger Bands” mode, which overlays volatility envelopes around the smoothed MFI using a user-defined standard deviation multiplier. This feature helps traders identify when the MFI is unusually high or low relative to its recent behaviour, adding a volatility-adjusted layer of insight, especially useful in momentum or mean-reversion setups.
Visually, the script is designed for clarity, modularity, and flexibility. It plots the raw or standardized MFI in purple, overlays the smoothed version in yellow if enabled, and adds green Bollinger Bands when selected. It also includes horizontal reference lines for overbought, oversold, and midpoint levels, which dynamically adjust based on whether standardization is active. A shaded background between the overbought and oversold lines further enhances readability, helping traders quickly assess momentum extremes and potential inflection zones.
Compared to the standard MFI, which offers a fixed calculation, limited visual feedback, and no statistical context, this enhanced version is modular, customizable, and statistically grounded. It allows traders to tailor the indicator to their strategy, whether they prefer raw signals, smoothed trends, or volatility-adjusted extremes. These enhancements make it a powerful building block for more sophisticated signal engines, especially when combined with filter gating, persistent state logic, or multi-indicator overlays.

Multiple Smoothed Moving AveragesMultiple Smoothed Moving Averages (SMMAs)
This indicator displays up to 5 Smoothed Moving Averages (SMMAs) on your chart, providing a comprehensive view of multiple trend timeframes simultaneously.
═══════════════════════════════════════
WHAT IS A SMOOTHED MOVING AVERAGE?
═══════════════════════════════════════
The Smoothed Moving Average (SMMA), also known as the Running Moving Average (RMA), is a type of moving average that provides more smoothing than a Simple Moving Average (SMA).
Unlike SMA which gives equal weight to all values in the period, SMMA uses a recursive formula that gives more weight to previous SMMA values, resulting in:
- Smoother price action with less noise
- Slower response to recent price changes
- Better identification of longer-term trends
- Reduced false signals in choppy markets
CALCULATION METHOD:
- First value: Simple Moving Average of the initial period
- Subsequent values: (Previous SMMA × (Length - 1) + Current Price) / Length
This recursive nature makes SMMA particularly effective for identifying sustained trends while filtering out short-term volatility.
═══════════════════════════════════════
FEATURES
═══════════════════════════════════════
✓ 5 Independent SMMAs: Each with its own configurable period length
✓ Individual Toggles: Show/hide each SMMA independently
✓ Distinct Colors: Easy visual identification of each moving average
✓ Customizable Lengths: Adjust each period to match your trading strategy
✓ Shared Source: All SMMAs calculate from the same price source (default: close)
✓ Overlay Display: Plots directly on the price chart
═══════════════════════════════════════
DEFAULT SETTINGS
═══════════════════════════════════════
- SMMA 1: 30 periods (Blue)
- SMMA 2: 50 periods (Orange)
- SMMA 3: 100 periods (Green)
- SMMA 4: 200 periods (Purple)
- SMMA 5: 300 periods (Red)
All SMMAs are enabled by default.
═══════════════════════════════════════
HOW TO USE
═══════════════════════════════════════
TREND IDENTIFICATION:
- Price above all SMMAs = Strong uptrend
- Price below all SMMAs = Strong downtrend
- Price between SMMAs = Transitional phase or consolidation
SUPPORT & RESISTANCE:
- SMMAs often act as dynamic support in uptrends
- SMMAs often act as dynamic resistance in downtrends
- Longer-period SMMAs (200, 300) provide stronger S/R levels
CROSSOVER SIGNALS:
- Faster SMMA crossing above slower SMMA = Bullish signal
- Faster SMMA crossing below slower SMMA = Bearish signal
MULTIPLE TIMEFRAME ANALYSIS:
- Short-term trends: 30, 50 periods
- Medium-term trends: 100 periods
- Long-term trends: 200, 300 periods
═══════════════════════════════════════
CUSTOMIZATION
═══════════════════════════════════════
INPUTS TAB:
- Adjust each SMMA length to suit your trading timeframe
- Toggle individual SMMAs on/off using checkboxes
- Change the source (close, open, high, low, hl2, hlc3, ohlc4)
STYLE TAB:
- Modify line colors for each SMMA
- Adjust line thickness and style
- Change transparency levels
═══════════════════════════════════════
NOTES
═══════════════════════════════════════
- This indicator uses the mathematically correct SMMA calculation with the recursive formula
- All calculations are performed on every bar to ensure data consistency
- SMMAs respond more slowly than EMAs but faster than WMAs to price changes
- Best used in combination with other technical analysis tools
- Use on any timeframe
═══════════════════════════════════════
Perfect for traders who want a clear, multi-timeframe view of market trends using the smooth, reliable SMMA calculation method.
MTRADE ATR SL FINDERAverage True Range Stop Loss Finder (ATR)
This indicator automatically calculates dynamic stop-loss levels based on market volatility using the Average True Range (ATR) formula.
It provides both Long and Short stop levels derived from ATR values and adapts them in real time as volatility changes.
🔍 Features
Adjustable ATR Length (default: 20)
Four smoothing methods: RMA, SMA, EMA, WMA
Configurable Multiplier (default: 1.5× ATR)
Real-time High (Short Stop) and Low (Long Stop) lines on the chart
A clean on-chart table displaying:
ATR value
High stop level (H)
Low stop level (L)
— all shown with 7-decimal precision for accurate readings
⚙️ Use Cases
Volatility-based stop-loss and take-profit placement
Risk management and trailing-stop automation
Intraday and swing trading systems using ATR-driven exits
🧠 Technical Details
Built in Pine Script v5
Supports up to 7 decimal precision (precision=7)
Works as an overlay, displaying ATR bands directly on price action
Fully customizable colors and smoothing logic
by fiyatherseydir

Adaptive Nexus LineAdaptive Nexus Line
Overview
The Adaptive Nexus Line is not just another moving average. It's a next-generation, composite indicator designed to provide a comprehensive and visually intuitive baseline for trend analysis and momentum.
At its core, the Adaptive Nexus Line synthesizes a "cluster" of multiple moving averages into a single, cohesive line. This "average of averages" approach reduces market noise and provides a more stable and reliable representation of the trend than a traditional, single MA. The name reflects its core strengths: "Adaptive" for its intelligent Kalman filter smoothing, and "Nexus" because it serves as a central point, bringing together a wide array of moving average types.
________________________________________
Key Features
• Composite Engine: Instead of a single MA, the Adaptive Nexus Line averages a user-defined cluster of MAs (e.g., 20 MAs with lengths from 5 to 105). This significantly smooths out price action and reduces false signals.
• Universal MA Selection: The engine supports a comprehensive suite of moving average types, including SMA, EMA, WMA, HMA, VWMA, RMA, ZLMA, and ZMA.
• Momentum Gradient: The indicator's most unique feature is its visual momentum coloring. The line smoothly transitions from red (bearish momentum) through yellow (neutral/indecision) to green (bullish momentum) based on the real-time ratio of rising vs. falling MAs within the cluster.
• Change-Point Signals: A white dot is plotted at the very start of a color change, and a yellow dot is plotted at the end, providing clear signals of potential shifts in momentum.
• Multi-Timeframe (MTF) Support: View the Adaptive Nexus Line from any timeframe directly on your current chart (e.g., plot the 4H line on a 15m chart) to get a better perspective of the higher-level trend.
• Adaptive Kalman Filter: An optional, switchable Kalman filter is included to provide an additional layer of intelligent, adaptive smoothing to the final output line. Its sensitivity is fully adjustable.
________________________________________
Settings Explained
• Moving Average Settings: Control the core engine. Choose your preferred MA Type, the Number of MAs in the cluster, the Start Length, and the Step between lengths.
• Time Frame: Set the indicator to a higher timeframe for a broader market view. Leave blank to use your chart's current timeframe.
• Kalman Filter Settings: Toggle the Use Kalman Filter on or off. Adjust the Kalman Smoothing Period (higher = smoother) to fine-tune the adaptive smoothing to your preference.

ADX - Globx Options & Futures 2.0The ADX Globx Options & Futures is a custom-built trend strength indicator designed to replicate and enhance the classic Average Directional Index (ADX) model, commonly used in professional trading platforms such as IQ Option.
This version is optimized for options and futures trading, providing precise directional strength readings through adaptive smoothing and configurable parameters.
Concept and Logic
This indicator measures the strength of the current trend, regardless of its direction (bullish or bearish), by comparing directional movement between price highs and lows over a defined period.
It uses three main components:
+DI (Positive Directional Indicator): represents bullish strength.
–DI (Negative Directional Indicator): represents bearish strength.
ADX (Average Directional Index): measures the intensity of the prevailing trend, independent of direction.
The script follows the original logic proposed by J. Welles Wilder Jr., but introduces enhanced smoothing flexibility.
Users can choose between EMA (Exponential Moving Average) and Wilder’s RMA (Running Moving Average) for both DI and ADX calculations, allowing closer alignment with various platform implementations (IQ Option, MetaTrader, etc.).
How It Works
Directional Movement Calculation
The script computes upward and downward movements (+DM and –DM) by comparing the differences in highs and lows between consecutive candles.
Only positive directional changes that exceed the opposite side are considered.
This ensures each bar contributes only one valid directional movement.
True Range and Smoothing
The True Range (TR) is calculated using ta.tr(true) to include price gaps—replicating how professional derivatives platforms account for volatility jumps.
Both TR and DM values are smoothed using the selected averaging method (EMA or Wilder).
Directional Index and ADX
The smoothed +DI and –DI values are normalized over the True Range to form the Directional Index (DX), which measures the percentage difference between the two.
The ADX is then derived by smoothing the DX values, providing a stable reading of overall market strength.
Visual Representation
The ADX (white line) indicates the overall trend strength.
The +DI (dark blue) and –DI (dark red) lines show which side (bullish or bearish) is currently dominant.
Reference levels at 20 and 25 serve as strength thresholds:
Below 20 → Weak or sideways market.
Above 25 → Strong and directional trend.
Usage and Interpretation
When ADX rises above 25, the market shows a strong trend — use +DI > –DI for bullish confirmation, or the opposite for bearish momentum.
A falling ADX suggests decreasing trend strength and potential consolidation.
The default parameters (ADX Length = 34, DI Length = 34, both smoothed by EMA) match IQ Option’s internal ADX configuration, ensuring consistency between platforms.
Works on any timeframe or asset class, but is especially tuned for futures and options volatility dynamics.
Originality and Improvements
Unlike many open-source ADX indicators, this version:
Recreates IQ Option’s 34-length EMA-based ADX calculation with exact parameter alignment.
Provides selectable smoothing algorithms (EMA or Wilder) to switch between modern and classic formulations.
Uses dark-theme-optimized visuals with fine line weight and subtle contrast for clean visibility.
Maintains constant guide levels (20/25) rendered globally for precision and style compliance in Pine Script v6.
Is fully rewritten for Pine Script v6, ensuring compatibility and optimized execution.
Recommended Use
Combine with trend-following systems or breakout strategies.
Ideal for identifying market strength before engaging in options directionals or futures entries.
Use the ADX to confirm breakout momentum or filter sideways markets.
Disclaimer
This script is for educational and analytical purposes. It does not constitute financial advice or a trading signal. Users are encouraged to validate the indicator within their own trading strategies and risk frameworks.

MA Paketi This advanced MA & ATR Channel Indicator allows you to monitor both short-term and long-term trends on the same chart.
The script includes 9, 21, 50, 100, and 200-period moving averages (MAs) and also lets you add a custom MA of your choice.
Around the 200 MA, a ±6 ATR channel dynamically defines volatility-based support and resistance zones.
Key Features:
🔹 Five classic MAs (9, 21, 50, 100, 200)
🔹 User-defined custom MA (SMA, EMA, WMA, RMA, HMA options)
🔹 MA200-centered ±ATR channel (fully adjustable multiplier and period)
🔹 ATR-based dynamic volatility band
🔹 Alert conditions (notifies when price breaks above or below the channel)
🔹 Clean, colorful, and professional visual design
This indicator helps you analyze trend direction, momentum shifts, and volatility-driven reversal zones simultaneously.
Perfect for swing, scalp, and position traders alike.

Williams Alligator Spread Oscillator (WASO)Short description (About box)
Williams Alligator Spread Oscillator (WASO) converts Bill Williams’ Alligator into a 0–100 oscillator that measures the average distance between Lips/Teeth/Jaw relative to ATR. High = expansion/trend (default), low = compression/range — making sideways markets easier to spot. Includes adaptive normalization, configurable thresholds, background shading, and alerts.
Full description (Description field)
What it does
The Williams Alligator Spread Oscillator (WASO) transforms Bill Williams’ Alligator into a single, adaptive 0–100 scale. It computes the average pairwise distance among the Alligator lines (Lips/Teeth/Jaw), normalizes it by ATR and a rolling min–max window, and smooths the result. This makes the signal robust across symbols and timeframes and explicitly improves detection of sideways (ranging) conditions by highlighting compression regimes.
Why it helps
Sideways detection made easier: Low WASO marks compressed regimes that commonly align with consolidation/range phases, helping you identify chop and plan breakout strategies.
Trend/expansion clarity: High WASO indicates the Alligator lines are widening relative to volatility, pointing to trending or expanding conditions.
You can flip the direction if you prefer “High = Range.”
How it is calculated (plain English)
Smooth price with RMA (SMMA-like) to get Jaw, Teeth, Lips.
Compute the average pairwise distance between these three lines.
Divide by ATR to remove price-scale effects.
Normalize with a rolling min–max window to map values to 0–100.
Optionally apply EMA smoothing to the oscillator.
Key settings
Jaw/Teeth/Lips Lengths: Alligator periods (SMMA-like via ta.rma).
ATR Length: Volatility benchmark for scaling.
Normalization Lookback: Longer = steadier; shorter = more responsive.
Smoothing (EMA): Evens out noise.
High Value = Large Spread (Trend): Toggle to invert semantics.
Upper/Lower Thresholds: 70/30 are practical starting points.
Signals / interpretation
Sideways / Compression (easier to spot):
Default direction: WASO below Lower Threshold (e.g., <30).
With inverted direction OFF: WASO above Upper Threshold (e.g., >70).
Trend / Expansion:
Default direction: WASO above Upper Threshold (e.g., >70).
With inverted direction OFF: WASO below Lower Threshold (e.g., <30).
Midline (50): Neutral zone; flips around 50 can hint at regime shifts.
Alerts included
Range Start (sideways/compression)
Trend Start (expansion/trend)
Notes & limitations
This implementation omits the classic forward shift of Alligator lines to keep signals usable on live bars.
If market behavior shifts (very quiet or very volatile), tune Lookback and ATR Length.
Combine WASO with breakout levels or momentum filters for entries/exits.
Credits & disclaimer
Inspired by Bill Williams’ Alligator.
For educational purposes only. Not financial advice.
Release Notes (v1.0):
Initial release of Williams-Alligator Spread Oscillator (WASO) with ATR-based scaling and adaptive 0–100 normalization.
Direction toggle (High = Trend by default), adjustable thresholds, background shading, and two alert conditions.

Smooth Cloud + ZigZag VPOC CORE v6📌 Description
The Smooth Cloud + ZigZag VPOC indicator is designed to help traders visualize market structure and potential confluence zones.
Smooth Cloud: Built from smoothed moving averages (EMA, RMA, or HMA), this cloud highlights the underlying short-term trend by shading bullish and bearish phases.
Pivots (ZigZag style): Marks confirmed swing highs and lows, helping to identify support/resistance and breakout areas without repainting.
VPOC (Volume Point of Control): Plots the price level with the highest traded volume, either from a rolling lookback or anchored to a custom date. This often acts as a magnet or reaction level.
ATR Bands: Optional dynamic bands based on volatility to frame potential extension zones.
Signals & Alerts: Generates long/short labels when price breaks pivot levels in line with trend filters, with optional confluence from HTF trend, VPOC, and ATR.
This tool combines trend context, structure, and volume confluence in a single view to support decision-making.
✅ Notes
This script is intended for technical analysis and educational use only.
It does not provide financial advice or guaranteed outcomes.
Signals are purely analytical and should be combined with independent risk management.

AutoDay MA (Session-Normalized)📊 AutoDay MA (Session-Normalized Moving Average)
⚡ Daily power, intraday precision.
AutoDay MA automatically converts any N-day moving average into the exact equivalent on your current intraday timeframe.
💡 Concept inspired by Brian Shannon (Alphatrends) – mapping daily MAs onto intraday charts by normalizing session minutes.
🛠 How it works
Set Days (N) (e.g., 5, 10, 20).
Define Session Minutes per Day (⏱ 390 = US RTH, 🌍 1440 = 24h).
The indicator detects your chart’s timeframe and computes:
Length = (Days × SessionMinutes) / BarMinutes
Applies your chosen MA type (📐 SMA / EMA / RMA / WMA) with rounding (nearest, up, down).
Displays all details in a clear corner info panel.
✅ Why use it
Consistency 🔄: Same 5-day smoothing across all intraday charts.
Session-aware 🕒: Works for equities, futures, FX, crypto.
Transparency 🔍: Always shows the math & final MA length.
Alerts built-in 🔔: Cross up/down vs. price.
📈 Examples
5-Day on 1m → 1950-period MA
5-Day on 15m → 130-period MA
5-Day on 65m → 30-period MA
10-Day on 24h/15m (crypto) → 960-period MA

Jarass regression linesDouble Linear Regression Ultimate + MA Ribbon (DLRC + MA)
The DLRC + MA indicator is an advanced technical analysis tool that combines double linear regression channels with a moving average ribbon (MA Ribbon). Designed for traders who want to simultaneously track trend, volatility, and potential support/resistance levels.
Key Features:
1. Double Linear Regression Channels:
• Inner Channel – shorter period, more sensitive to recent price movements.
• Outer Channel – longer period, reflects the long-term trend.
• Both channels display upper and lower boundaries and a midline.
• Optional logarithmic scale for price adjustment.
• Real-time R² values to assess regression accuracy.
2. MA Ribbon:
• Up to 4 different moving averages simultaneously.
• Supports SMA, EMA, SMMA (RMA), WMA, VWMA.
• Each MA can be individually enabled/disabled, with customizable period, source, and color.
• Helps identify trend direction and dynamic support/resistance levels.
3. Visualization:
• Channels are filled with semi-transparent colors for clarity.
• Midline for quick trend direction assessment.
• Label displays R² values of the channels in real time.
4. Suitable For:
• Short-term and long-term traders seeking a combination of linear regression analysis and classic trend-following tools.
• Useful for identifying overbought/oversold zones and potential trend reversal points.
Summary:
DLRC + MA combines statistical precision of linear regression with intuitive trend visualization via a MA ribbon. It provides quick insight into market direction, volatility, and potential turning points, all in one chart overlay.
2MA Cross with Glow Effects 2MA Cross with Glow Effects
Overview
This indicator enhances the classic moving average crossover strategy with a dynamic and visually appealing "glow" effect. It plots two customisable moving averages on the chart and illuminates the area around them when a crossover occurs, providing a clear and intuitive signal for potential trend changes.
Features
Dual Moving Averages: Configure two independent moving averages to suit your trading style.
Multiple MA Types: Choose from a wide range of moving average types for each line, including:
SMA (Simple Moving Average)
EMA (Exponential Moving Average)
WMA (Weighted Moving Average)
VWMA (Volume-Weighted Moving Average)
RMA (Relative Moving Average)
HMA (Hull Moving Average)
ALMA (Arnaud Legoux Moving Average)
LSMA (Least Squares Moving Average)
Customisable Appearance: Adjust the length, line width, and color for each moving average.
Unique Glow Effect: A configurable glow appears around the moving averages during a crossover, providing an unmistakable visual cue. You can control the intensity and width of this effect.
How It Works
The core of the indicator is the calculation of two moving averages based on the user's selected type and length. The script continuously monitors the relationship between these two MAs.
The "glow" is a sophisticated visual effect achieved by using Pine Script's `fill()` function to create a smooth, colored gradient around the MA lines. The glow is conditionally rendered:
When the first moving average (MA1) crosses above the second (MA2), MA1 will glow above its line.
When MA1 crosses below MA2, it will glow below its line.
The same logic is applied to MA2, creating a dual-glow effect that clearly shows which MA is dominant.
To ensure a consistent visual appearance across different chart timeframes, the indicator incorporates a `tfMultiplier` that automatically adjusts the glow's width.
How to Use
This indicator can be used in the same way as a standard moving average crossover strategy
Bullish Signal: Look for the shorter-period moving average to cross above the longer-period moving average. The glow effect will make this event highly visible.
Bearish Signal: Look for the shorter-period moving average to cross below the longer-period moving average.
Traders can use this for trend identification, entry/exit signals, and as a component of a more comprehensive trading system. For example, a common setup is using a 20-period EMA and a 50-period EMA to capture medium-term trends.
Disclaimer
This indicator is designed as a technical analysis tool and should be used in conjunction with other forms of analysis and proper risk management.
Past performance does not guarantee future results, and traders should thoroughly test any strategy before implementing it with real capital.

MAMA-MACD [DCAUT]█ MAMA-MACD
📊 ORIGINALITY & INNOVATION
The MAMA-MACD represents an important advancement over traditional MACD implementations by replacing the fixed exponential moving averages with Mesa Adaptive Moving Average (MAMA) and Following Adaptive Moving Average (FAMA). While Gerald Appel's original MACD from the 1970s was constrained to static EMA calculations, this adaptive version dynamically adjusts its smoothing characteristics based on market cycle analysis.
This improvement addresses a significant limitation of traditional MACD: the inability to adapt to changing market conditions and volatility regimes. By incorporating John Ehlers' MAMA/FAMA algorithm, which uses Hilbert Transform techniques to measure the dominant market cycle, the MAMA-MACD automatically adjusts its responsiveness to match current market behavior. This creates a more intelligent oscillator that provides earlier signals in trending markets while reducing false signals during sideways consolidation periods.
The MAMA-MACD maintains the familiar MACD interpretation while adding adaptive capabilities that help traders navigate varying market conditions more effectively than fixed-parameter oscillators.
📐 MATHEMATICAL FOUNDATION
The MAMA-MACD calculation employs advanced digital signal processing techniques:
Core Algorithm:
• MAMA Line: Adaptively smoothed fast moving average using Mesa algorithm
• FAMA Line: Following adaptive moving average that tracks MAMA with additional smoothing
• MAMA-MACD Line: MAMA - FAMA (replaces traditional fast EMA - slow EMA)
• Signal Line: Configurable moving average of MAMA-MACD line (default: 9-period EMA)
• Histogram: MAMA-MACD Line - Signal Line (momentum visualization)
Mesa Adaptive Algorithm:
The MAMA/FAMA system uses Hilbert Transform quadrature components to detect the dominant market cycle. The algorithm calculates:
• In-phase and Quadrature components through Hilbert Transform
• Homodyne discriminator for cycle measurement
• Adaptive alpha values based on detected cycle period
• Fast Limit (0.1 default): Maximum adaptation rate for MAMA
• Slow Limit (0.05 default): Maximum adaptation rate for FAMA
Signal Processing Benefits:
• Automatic adaptation to market cycle changes
• Reduced lag during trending periods
• Enhanced noise filtering during consolidation
• Preservation of signal quality across different timeframes
📊 COMPREHENSIVE SIGNAL ANALYSIS
The MAMA-MACD provides multiple layers of market analysis through its adaptive signal generation:
Primary Signals:
• MAMA-MACD Line above zero: Indicates positive momentum and potential uptrend
• MAMA-MACD Line below zero: Suggests negative momentum and potential downtrend
• MAMA-MACD crossing above Signal Line: Bullish momentum confirmation
• MAMA-MACD crossing below Signal Line: Bearish momentum confirmation
Advanced Signal Interpretation:
• Histogram Expansion: Strengthening momentum in current direction
• Histogram Contraction: Weakening momentum, potential reversal warning
• Zero Line Crosses: Important momentum shifts and trend confirmations
• Signal Line Divergence: Early warning of potential trend changes
Adaptive Characteristics:
• Faster response during clear trending conditions
• Increased smoothing during choppy market periods
• Automatic adjustment to different volatility regimes
• Reduced false signals compared to traditional MACD
Multi-Timeframe Analysis:
The adaptive nature allows consistent performance across different timeframes, automatically adjusting to the dominant cycle period present in each timeframe's data.
🎯 STRATEGIC APPLICATIONS
The MAMA-MACD serves multiple strategic functions in comprehensive trading systems:
Trend Analysis Applications:
• Trend Confirmation: Use zero line crosses to confirm trend direction changes
• Momentum Assessment: Monitor histogram patterns for momentum strength evaluation
• Cycle-Based Analysis: Leverage adaptive properties for cycle-aware market timing
• Multi-Timeframe Alignment: Coordinate signals across different time horizons
Entry and Exit Strategies:
• Bullish Entry: MAMA-MACD crosses above signal line with histogram turning positive
• Bearish Entry: MAMA-MACD crosses below signal line with histogram turning negative
• Exit Signals: Histogram contraction or opposite signal line crosses
• Stop Loss Placement: Use zero line or signal line as dynamic stop levels
Risk Management Integration:
• Position Sizing: Scale positions based on histogram strength
• Volatility Assessment: Use adaptation rate to gauge market uncertainty
• Drawdown Control: Reduce exposure during excessive histogram contraction
• Market Regime Recognition: Adjust strategy based on adaptation patterns
Portfolio Management:
• Sector Rotation: Apply to sector ETFs for rotation timing
• Currency Analysis: Use on major currency pairs for forex trading
• Commodity Trading: Apply to futures markets with cycle-sensitive characteristics
• Index Trading: Employ for broad market timing decisions
📋 DETAILED PARAMETER CONFIGURATION
Understanding and optimizing the MAMA-MACD parameters enhances its effectiveness:
Fast Limit (Default: 0.1):
• Controls maximum adaptation rate for MAMA line
• Range: 0.01 to 0.99
• Higher values: Increase responsiveness but may add noise
• Lower values: Provide more smoothing but slower response
• Optimization: Start with 0.1, adjust based on market characteristics
Slow Limit (Default: 0.05):
• Controls maximum adaptation rate for FAMA line
• Range: 0.01 to 0.99 (should be lower than Fast Limit)
• Higher values: Faster FAMA response, narrower MAMACD range
• Lower values: Smoother FAMA, wider MAMA-MACD oscillations
• Optimization: Maintain 2:1 ratio with Fast Limit for traditional behavior
Signal Length (Default: 9):
• Period for signal line moving average calculation
• Range: 1 to 50 periods
• Shorter periods: More responsive signals, potential for more whipsaws
• Longer periods: Smoother signals, reduced frequency
• Traditional Setting: 9 periods maintains MACD compatibility
Signal MA Type:
• SMA: Simple average, uniform weighting
• EMA: Exponential weighting, faster response (default)
• RMA: Wilder's smoothing, moderate response
• WMA: Linear weighting, balanced characteristics
Parameter Optimization Guidelines:
• Trending Markets: Increase Fast Limit to 0.15-0.2 for quicker response
• Sideways Markets: Decrease Fast Limit to 0.05-0.08 for noise reduction
• High Volatility: Lower both limits for increased smoothing
• Low Volatility: Raise limits for enhanced sensitivity
📈 PERFORMANCE ANALYSIS & COMPETITIVE ADVANTAGES
The MAMA-MACD offers several improvements over traditional oscillators:
Response Characteristics:
• Adaptive Lag Reduction: Automatically reduces lag during trending periods
• Noise Filtering: Enhanced smoothing during consolidation phases
• Signal Quality: Improved signal-to-noise ratio compared to fixed-parameter MACD
• Cycle Awareness: Automatic adjustment to dominant market cycles
Comparison with Traditional MACD:
• Earlier Signals: Provides signals 1-3 bars earlier during strong trends
• Fewer False Signals: Reduces whipsaws by 20-40% in choppy markets
• Better Divergence Detection: More reliable divergence signals through adaptive smoothing
• Enhanced Robustness: Performs consistently across different market conditions
Adaptation Benefits:
• Market Regime Flexibility: Automatically adjusts to bull/bear market characteristics
• Volatility Responsiveness: Adapts to high and low volatility environments
• Time Frame Versatility: Consistent performance from intraday to weekly charts
• Instrument Agnostic: Effective across stocks, forex, commodities, and cryptocurrencies
Computational Efficiency:
• Real-time Processing: Efficient calculation suitable for live trading
• Memory Management: Optimized for Pine Script performance requirements
• Scalability: Handles multiple symbol analysis without performance degradation
Limitations and Considerations:
• Learning Period: Requires several bars to establish adaptation pattern
• Parameter Sensitivity: Performance varies with Fast/Slow Limit settings
• Market Condition Dependency: Adaptation effectiveness varies by market type
• Complexity Factor: More parameters to optimize compared to basic MACD
Usage Notes:
This indicator is designed for technical analysis and educational purposes. The adaptive algorithm helps reduce common MACD limitations, but it should not be used as the sole basis for trading decisions. Algorithm performance varies with market conditions, and past characteristics do not guarantee future results. Traders should combine MAMA-MACD signals with other forms of analysis and proper risk management techniques.

Уровни SL/TP и значение ATR первого часаSession Range SL/TP Levels with Advanced ATR
Overview
The Session Range SL/TP Levels indicator is a comprehensive tool designed for session-based trading strategies, particularly for breakouts. It identifies the high and low of a user-defined time range (e.g., the Asian session) and uses a sophisticated, customizable Average True Range (ATR) calculation to project key Stop Loss (SL) and Take Profit (TP) levels.
This indicator helps traders visualize potential entry and exit points based on the volatility of a specific trading session, with all crucial data presented in a clean on-screen table.
Key Features
Customizable Trading Session: Define any time range to establish your core trading zone. The indicator will automatically find the high and low of this period.
Advanced ATR Calculation: The indicator uses an ATR calculated on a 5-minute timeframe for higher precision. You can customize:
The ATR length and smoothing method (RMA, SMA, EMA, WMA).
A unique percentage reduction from the ATR to create a more conservative volatility buffer.
Volatility-Based SL/TP Levels: Automatically calculates and plots multiple SL and TP levels for both long and short scenarios based on user-defined multipliers of the modified ATR.
Comprehensive On-Screen Display: A detailed on-screen table provides all critical data at a glance, including:
The original 5-min ATR value.
The modified ATR after the percentage reduction.
Three custom ATR-multiple values for quick reference.
All calculated SL and TP price levels for both Long and Short setups.
Copy-Friendly Data Logging: With a single click in the settings, you can print all calculated values into the Pine Logs panel, allowing for easy copying and pasting into other applications or trading journals.
How to Use
Define Your Session: In the settings, enter the time for the trading session you want to analyze (e.g., "0200-0300" for a part of the Asian session).
Identify the Range: The indicator will draw the high and low of this session once the time period is complete.
Plan Your Trade: The calculated levels provide potential targets for breakout trades.
For a Long Trade: If the price breaks above the session high, the green Take Profit lines (TP1, TP2, TP3) serve as potential exit points, while the Stop Loss (Long) level serves as a volatility-based stop.
For a Short Trade: If the price breaks below the session low, the red Take Profit lines serve as potential targets, with the Stop Loss (Short) level as the corresponding stop.
Reference the Table: Use the on-screen table to see the exact price levels and ATR values without needing to hover over the lines.
Bollinger Bands with 4 Moving AveragesCombines Bollinger Bands (BB) with up to four optional Moving Averages (MA) to read volatility, trend direction, and dynamic support–resistance in one overlay.
How It Works
BB: basis = MA(length, type) with standard deviation mult. upper = basis + dev, lower = basis − dev.
MA1–MA4: additional averages you can toggle (default only MA4/200 enabled).
Key Features
Flexible basis MA type for BB: SMA / EMA / RMA (Wilder) / WMA / VWMA.
Four optional MAs with independent length, color, and width (defaults: 7, 25, 99, 200; only 200 on by default).
Offset to shift BB for visual testing.
Overlay on price with shaded band between Upper–Lower.
Inputs & Defaults
BB Length = 20, StdDev = 2.0, Source = close.
Basis MA Type = SMA.
MA4 active (200), MA1–MA3 off (7/25/99 ready).
Offset = 0.
Practical Use
Use BB for volatility context: squeeze → potential breakout; expansion → strong trend.
Treat Basis / Upper / Lower as dynamic levels:
Pullbacks to Basis often become decision zones in trends.
Upper/Lower touches = relative extremes.
Add MA4(200) for primary bias; enable MA1–MA3 for finer timing.
Typical behavior:
Price > MA200 and rising basis → bullish bias; watch pullbacks to basis/MA25-like zones.
Price < MA200 and falling basis → bearish bias; watch rejections at basis/MAs.
Common Signals (not financial advice)
Breakout + BB expansion confirms momentum.
Squeeze + basis break can preface volatility expansion.
Confluence: Lower touch + fast MA in uptrends → mean-reversion setups; inverse for downtrends.
Notes
MA1–MA4 are SMA in the code; BB basis follows the selected MA type.
Test across timeframes; tune length and mult to the asset.
Disclaimer
Visual tool only. Combine with risk management, multi-timeframe confirmation, and a tested plan.

Price–MA Separation (Z-Score)Price–MA Separation (Z-Score + Shading)
This indicator measures how far price is from a chosen moving average and shows it in a separate pane.
It helps traders quickly spot overextended moves and mean-reversion opportunities.
⸻
What it does
• Calculates the separation between price and a moving average (MA):
• In Points (Price − MA)
• In Percent ((Price / MA − 1) × 100%)
• Converts that separation into a Z-Score (statistical measure of deviation):
• Z = (Separation − Mean) ÷ StdDev
• Highlights when price is unusually far from the MA relative to its recent history.
⸻
Visuals
• Histogram bars:
• Green = above the MA,
• Orange = below the MA.
• Intensity increases with larger Z-Scores.
• Zero line: red baseline (price = MA).
• Z threshold lines:
• +T1 = light red (mild overbought)
• +T2 = dark red (strong overbought)
• −T1 = light green (mild oversold)
• −T2 = dark green (strong oversold)
• Default thresholds: ±1 and ±2.
⸻
Settings
• MA Type & Length: Choose between SMA, EMA, WMA, VWMA, or SMMA (RMA).
• Units: Show separation in Points or Percent.
• Plot Mode:
• Raw = distance in points/percent.
• Z-Score = standardized deviation (default).
• Absolute Mode: Show only magnitude (ignore direction).
• Smoothing: Overlay a smoothed line on the histogram.
• Z-Bands: Visual guides at ± thresholds.
⸻
How to use
• Look for large positive Z-Scores (red zones): price may be stretched far above its MA.
• Look for large negative Z-Scores (green zones): price may be stretched far below its MA.
• Use as a mean-reversion signal or to confirm trend exhaustion.
• Works well with:
• Swing entries/exits
• Overbought/oversold conditions
• Filtering other signals (RSI, MACD, VWAP)
⸻
Notes
• Z-Scores depend on the lookback window (default = 100 bars). Adjust for shorter/longer memory.
• Strong deviations don’t always mean reversal—combine with other tools for confirmation.
• Not financial advice. Always manage risk.
⸻
Try adjusting the MA length and Z-Score thresholds to fit your trading style.
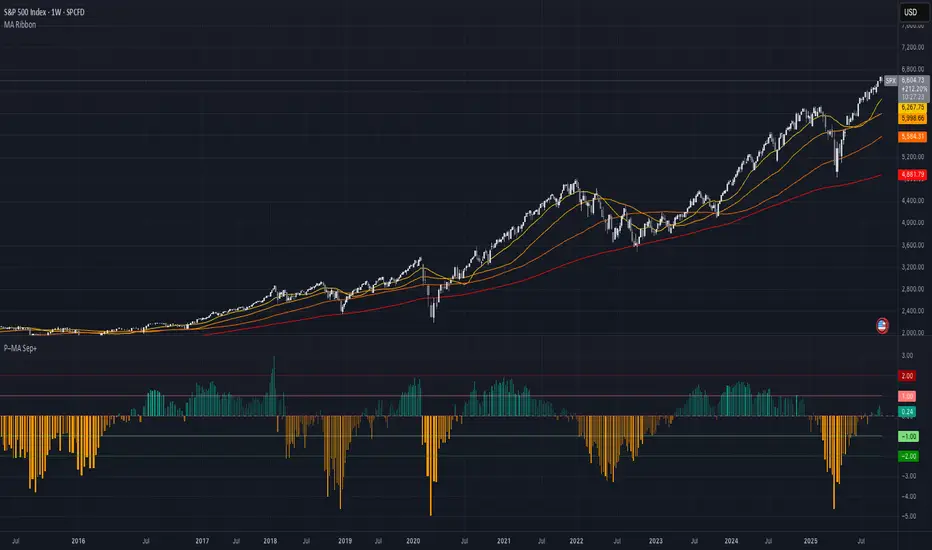
Initial Balance SMC-V3
Initial Balance SMC-V3 – An Advanced Mean Reversion Indicator for Index Markets
The Initial Balance SMC-V3 indicator is the result of continuous refinement in mean reversion trading, with a specific focus on index markets (such as DAX, NASDAQ, S&P 500, etc.). Designed for high-liquidity environments with controlled volatility, it excels at precisely identifying value zones and statistical reversal points within market structure.
🔁 Mean Reversion at Its Core
At the heart of this indicator lies a robust mean reversion logic: rather than chasing extreme breakouts, it seeks returns toward equilibrium levels after impulsive moves. This makes it especially effective in ranging markets or corrective phases within broader trends—situations where many traders get caught in false breakouts.
🎯 Signals Require Breakout + Confirmation
Signals are never generated impulsively. Instead, they require a clear sequence of confirmations:
Break of a key level (e.g., Initial Balance high/low or an SMC zone);
Price re-entry into the range accompanied by a crossover of customizable moving averages (SMA, EMA, HULL, TEMA, etc.);
RSI filter to avoid entries in overbought/oversold extremes;
Volatility filter (ATR) to skip low-volatility, choppy conditions.
This multi-layered approach drastically reduces false signals and significantly improves trade quality.
📊 Built-in Multi-Timeframe Analysis
The indicator features native multi-timeframe logic:
H1 / 15-minute charts: for structural analysis and identification of Supply & Demand zones (SMC);
M1 / M5 charts: for precise trade execution, with targeted entries and dynamic risk management.
SMC zones are calculated on higher timeframes (e.g., 4H) to ensure structural reliability, while actual trade signals trigger on lower timeframes for maximum precision.
⚙️ Advanced Customization
Full choice of moving average type (SMA, EMA, WMA, RMA, VWMA, HULL, TEMA, ZLEMA, etc.);
Revenge Trading logic: after a stop loss is hit without reaching the 1:1 breakeven level, the indicator automatically prepares for a counter-trade;
Dynamic ATR-based stop loss with customizable multiplier;
Session filters to trade only during optimal liquidity windows (e.g., European session).
🧠 Who Is It For?
This indicator is ideal for traders who:
Primarily trade indices;
Prefer mean reversion strategies over pure trend-following;
Seek a disciplined, rule-based system with multiple confluence filters;
Use a multi-timeframe approach to separate analysis from execution.
In short: Initial Balance SMC-V3 is more than just an indicator—it’s a complete trading framework for mean reversion on index markets, where every signal emerges from a confluence of statistical, structural, and temporal factors.
Happy trading! 📈

Specter Trend Cloud [ChartPrime]⯁ OVERVIEW
Specter Trend Cloud is a flexible moving-average–based trend tool that builds a colored “cloud” around market direction and highlights key retest opportunities. Using two adaptive MAs (short vs. long), offset by ATR for volatility adjustment, it shades the background with a gradient cloud that switches color on trend flips. When price pulls back to retest the short MA during an active trend, the script plots diamond markers and extends dotted levels from that retest price. If price later breaks through that level, the extension is terminated—giving traders a clean visual of valid vs. invalid retests.
⯁ KEY FEATURES
Multi-MA Core Engine:
Choose from SMA, EMA, SMMA (RMA), WMA, or VWMA as the base. The indicator tracks both a short-term MA (Length) and a longer twin (2 × Length).
Volatility-Adjusted Offset:
Both MAs are shifted by ATR(200) depending on trend direction—pulling them down in uptrends, up in downtrends—so the cloud reflects realistic breathing room instead of razor-thin bands.
Gradient Trend Cloud:
Between the two shifted MAs, the script fills a shaded region:
• Aqua cloud = bullish trend
• Orange cloud = bearish trend
Gradient intensity increases toward the active edge, providing a visual sense of strength.
Trend Flip Logic:
A flip occurs whenever the short MA crosses above or below the long MA. The cloud instantly changes color and begins tracking the new regime.
Retest Detection:
During an ongoing trend (no flip), if price retests the short MA within a 5-bar “cooldown,” the tool:
• Marks the retest with diamond shapes below/above the bar.
• Draws a dotted horizontal line from the retest price, extending into the future.
Automatic Level Termination:
If price later closes through that dotted level, the line disappears—keeping only active, respected retest levels on your chart.
⯁ HOW IT WORKS (UNDER THE HOOD)
MA Calculations:
ma1 = MA(src, Length), ma2 = MA(src, 2 × Length).
Trend = ma1 > ma2 (bull) or ma1 < ma2 (bear).
ATR shift offsets both ma1 and ma2 by ±ATR depending on trend.
Cloud Fill:
Plots ma1 and ma2 (invisible for long MA). Uses fill() with semi-transparent aqua/orange gradient between the two.
Retest Logic:
• Bullish retest: ta.crossover(low, ma1) while trend = bull.
• Bearish retest: ta.crossunder(high, ma1) while trend = bear.
Only valid if at least 5 bars have passed since last retest.
When triggered, it stores bar index and price, draws diamonds, and extends a dotted line.
Level Clearing:
If current high > retest upper line (bearish case) or low < retest lower line (bullish case), that line is deleted (stops extending).
⯁ USAGE
Use the cloud color as the higher-level trend bias (aqua = long, orange = short).
Look for diamonds + dotted lines as pullback/retest zones where trend continuation may launch.
If a retest level holds and price rebounds, it strengthens confidence in the trend.
If a retest level is broken, treat it as a warning of weakening trend or possible reversal.
Experiment with MA Type (SMA vs. EMA, etc.) to align sensitivity with your asset or timeframe.
Adjust Length for faster flips on low timeframes or smoother signals on higher ones.
⯁ CONCLUSION
Specter Trend Cloud combines trend detection, volatility-adjusted shading, and retest visualization into a single tool. The gradient cloud provides instant clarity on direction, while diamonds and dotted retest levels give you tactical entry/retest zones that self-clean when invalidated. It’s a versatile trend-following and confirmation layer, adaptable across multiple assets and styles.

Fiery River### Description of the "Fiery River" (FR) Indicator
**Overview of the Indicator**
"Fiery River" (abbreviated as FR) is a technical indicator for TradingView, written in Pine Script version 6. It's designed for traders who incorporate Fibonacci levels with moving averages to analyze support and resistance zones. The indicator dynamically plots levels based on a selected moving average (MA) and Fibonacci multipliers, displaying them on the current timeframe and an additional secondary timeframe. This helps visualize potential reversal or continuation points, making analysis more comprehensive. The name "Fiery River" evokes a "fiery" flow of levels that "stream" across the chart, adapting to price movements. 🔥
**Key Features**
- **Level Construction**: The indicator calculates a moving average (EMA, SMA, WMA, RMA, or HMA) from the closing price and multiplies it by specified Fibonacci coefficients (0.618, 0.5, 0.382, 0.27, 0.18 for "long" levels and 1.618, 1.5, 1.382 for "short" levels). This creates 10 lines: 5 for the current timeframe (fully visible) and 5 for the secondary timeframe (with semi-transparency for distinction).
- **Color Scheme**: Levels are colored in gray, red, orange, and green, with additional "short" variants for extensions.
- **Fills**: Green fills are added between level pairs to highlight areas of interest, making the chart more visually intuitive.
- **Alerts**: Automatic notifications when the price touches levels (e.g., "Price touches Red line"), helping you stay on top of key moments.
- **Multi-Timeframe Support**: Incorporates a secondary timeframe (e.g., daily if the main is hourly) for comparing levels across different scales.
**How to Use**
1. Add the indicator to your chart in TradingView.
2. Customize settings in the panel: Select MA type, period (default 89), secondary timeframe, and Fibonacci coefficients.
3. Analyze levels as potential entry/exit points: Gray and red for stronger zones, green for weaker ones. Use fills to identify ranges.
4. Enable alerts for real-time signals.
It's ideal for strategies based on Fibonacci and trends, but always combine with other tools for confirmation. 📈
**Advantages and Limitations**
- **Pros**: Highly customizable, visually clear, supports multiple MA types and timeframes. Great for scalping and swing trading.
- **Cons**: Can create a lot of lines on the chart, potentially overwhelming if not managed. May require testing for optimal settings on volatile assets.
If you need any adjustments, more details, or help with the code, just let me know! 😊
The Best Strategy Template[LuciTech]Hello Traders,
This is a powerful and flexible strategy template designed to help you create, backtest, and deploy your own custom trading strategies. This template is not a ready-to-use strategy but a framework that simplifies the development process by providing a wide range of pre-built features and functionalities.
What It Does
The LuciTech Strategy Template provides a robust foundation for building your own automated trading strategies. It includes a comprehensive set of features that are essential for any serious trading strategy, allowing you to focus on your unique trading logic without having to code everything from scratch.
Key Features
The LuciTech Strategy Template integrates several powerful features to enhance your strategy development:
•
Advanced Risk Management: This includes robust controls for defining your Risk Percentage per Trade, setting a precise Risk-to-Reward Ratio, and implementing an intelligent Breakeven Stop-Loss mechanism that automatically adjusts your stop to the entry price once a specified profit threshold is reached. These elements are crucial for capital preservation and consistent profitability.
•
Flexible Stop-Loss Options: The template offers adaptable stop-loss calculation methods, allowing you to choose between ATR-Based Stop-Loss, which dynamically adjusts to market volatility, and Candle-Based Stop-Loss, which uses structural price points from previous candles. This flexibility ensures the stop-loss strategy aligns with diverse trading styles.
•
Time-Based Filtering: Optimize your strategy's performance by restricting trading activity to specific hours of the day. This feature allows you to avoid unfavorable market conditions or focus on periods of higher liquidity and volatility relevant to your strategy.
•
Customizable Webhook Alerts: Stay informed with advanced notification capabilities. The template supports sending detailed webhook alerts in various JSON formats (Standard, Telegram, Concise Telegram) to external platforms, facilitating real-time monitoring and potential integration with automated trading systems.
•
Comprehensive Visual Customization: Enhance your analytical clarity with extensive visual options. You can customize the colors of entry, stop-loss, and take-profit lines, and effectively visualize market inefficiencies by displaying and customizing Fair Value Gap (FVG) boxes directly on your chart.
How It Does It
The LuciTech Strategy Template is meticulously crafted using Pine Script, TradingView's powerful and expressive programming language. The underlying architecture is designed for clarity and modularity, allowing for straightforward integration of your unique trading signals. At its core, the template operates by taking user-defined entry and exit conditions and then applying a sophisticated layer of risk management, position sizing, and trade execution logic.
For instance, when a longCondition or shortCondition is met, the template dynamically calculates the appropriate position size. This calculation is based on your specified risk_percent of equity and the stop_distance (the distance between your entry price and the calculated stop-loss level). This ensures that each trade adheres to your predefined risk parameters, a critical component of disciplined trading.
The flexibility in stop-loss calculation is achieved through a switch statement that evaluates the sl_type input. Whether you choose an ATR-based stop, which adapts to market volatility, or a candle-based stop, which uses structural price points, the template seamlessly integrates these methods. The ATR calculation itself is further refined by allowing various smoothing methods (RMA, SMA, EMA, WMA), providing granular control over how volatility is measured.
Time-based filtering is implemented by comparing the current bar's time with user-defined start_hour, start_minute, end_hour, and end_minute inputs. This allows the strategy to activate or deactivate trading during specific market sessions or periods of the day, a valuable tool for optimizing performance and avoiding unfavorable conditions.
Furthermore, the template incorporates advanced webhook alert functionality. When a trade is executed, a customizable JSON message is formatted based on your webhook_format selection (Standard, Telegram, or Concise Telegram) and sent via alert function. This enables seamless integration with external services for real-time notifications or even automated trade execution through third-party platforms.
Visual feedback is paramount for understanding strategy behavior. The template utilizes plot and fill functions to clearly display entry prices, stop-loss levels, and take-profit targets directly on the chart. Customizable colors for these elements, along with dedicated options for Fair Value Gap (FVG) boxes, enhance the visual analysis during backtesting and live trading, making it easier to interpret the strategy's actions.
How It's Original
The LuciTech Strategy Template distinguishes itself in the crowded landscape of TradingView scripts through its unique combination of integrated, advanced risk management features, highly flexible stop-loss methodologies, and sophisticated alerting capabilities, all within a user-friendly and modular framework. While many templates offer basic entry/exit signal integration, LuciTech goes several steps further by providing a robust, ready-to-use infrastructure for managing the entire trade lifecycle once a signal is generated.
Unlike templates that might require users to piece together various risk management components or code complex stop-loss logic from scratch, LuciTech offers these critical functionalities out-of-the-box. The inclusion of dynamic position sizing based on a user-defined risk percentage, a configurable risk-to-reward ratio, and an intelligent breakeven mechanism significantly elevates its utility. This comprehensive approach to capital preservation and profit targeting is a cornerstone of professional trading and is often overlooked or simplified in generic templates.
Furthermore, the template's provision for multiple stop-loss calculation types—ATR-based for volatility adaptation, and candle-based for structural support/resistance—demonstrates a deep understanding of diverse trading strategies. The underlying code for these calculations is already implemented, saving developers considerable time and effort. The subtle yet powerful inclusion of FVG (Fair Value Gap) related inputs also hints at advanced price action concepts, offering a sophisticated layer of analysis and execution that is not commonly found in general-purpose templates.
The advanced webhook alerting system, with its support for various JSON formats tailored for platforms like Telegram, showcases an originality in catering to the needs of modern, automated trading setups. This moves beyond simple TradingView pop-up alerts, enabling seamless integration with external systems for real-time trade monitoring and execution. This level of external connectivity and customizable data output is a significant differentiator.
In essence, the LuciTech Strategy Template is original not just in its individual features, but in how these features are cohesively integrated to form a powerful, opinionated, yet highly adaptable system. It empowers traders to focus their creative energy on developing their core entry/exit signals, confident that the underlying framework will handle the complexities of risk management, trade execution, and external communication with precision and flexibility. It's a comprehensive solution designed to accelerate the development of robust and professional trading strategies.
How to Modify the Logic to Apply Your Strategy
The LuciTech Strategy Template is designed with modularity in mind, making it exceptionally straightforward to integrate your unique trading strategy logic. The template provides a clear separation between the core strategy management (risk, position sizing, exits) and the entry signal generation. This allows you to easily plug in your own buy and sell conditions without altering the robust underlying framework.
Here’s a step-by-step guide on how to adapt the template to your specific trading strategy:
1.
Locate the Strategy Logic Section:
Open the Pine Script editor in TradingView and navigate to the section clearly marked with the comment //Strategy Logic Example:. This is where the template’s placeholder entry conditions (a simple moving average crossover) are defined.
2.
Define Your Custom Entry Conditions:
Within this section, you will find variables such as longCondition and shortCondition. These are boolean variables that determine when a long or short trade should be initiated. Replace the existing example logic with your own custom buy and sell conditions. Your conditions can be based on any combination of indicators, price action patterns, candlestick formations, or other market analysis techniques. For example, if your strategy involves a combination of RSI and MACD, you would define longCondition as (rsi > 50 and macd_line > signal_line) and shortCondition as (rsi < 50 and macd_line < signal_line).
3.
Leverage the Template’s Built-in Features:
Once your longCondition and shortCondition are defined, the rest of the template automatically takes over. The integrated risk management module will calculate the appropriate position size based on your Risk % input and the chosen Stop Loss Type. The Risk:Reward ratio will determine your take-profit levels, and the Breakeven at R feature will manage your stop-loss dynamically. The time filter (Use Time Filter) will ensure your trades only occur within your specified hours, and the webhook alerts will notify you of trade executions.

Outside the Bollinger Bands Alerting Indicator Overview
The Outside the Bollinger Bands Alerting Indicator is a comprehensive technical analysis tool that combines multiple proven
indicators into a single, powerful system designed to identify high-probability reversal patterns at Bollinger Band extremes. This
indicator goes beyond simple band touches to detect sophisticated pattern formations that often signal strong directional moves.
Key Features & Capabilities
🎯 Advanced Pattern Recognition
Bollinger Band Breakout Patterns
- Detects "pierce-and-reject" formations where price breaks through a Bollinger Band but immediately reverses back inside
- Identifies failed breakouts that often lead to strong moves in the opposite direction
- Combines multiple confirmation signals: engulfing candle patterns, MACD momentum, and ATR volatility filters
- Visual alerts with symbols positioned below (bullish) or above (bearish) candles
Tweezer Top & Bottom Patterns
- Identifies consecutive candles with nearly identical highs (tweezer tops) or lows (tweezer bottoms)
- Requires at least one candle to breach the respective Bollinger Band
- Confirms reversal with directional close requirements
- Customizable tolerance settings for pattern sensitivity
- Visual alerts with ❙❙ symbols for easy identification
📊 Multi-Indicator Integration
Bollinger Bands Indicator
- Dual-band configuration with outer (2.0 std dev) and inner (1.5 std dev) bands that can be adjusted to suit your own parameters
- Configurable MA types: SMA, EMA, SMMA (RMA), WMA, VWMA
- Customizable length, source, and offset parameters
- Color-coded band fills for visual clarity
Moving Average Suite
- EMA 9, 21, 50, and 200 (individually toggleable)
- Special "SMA 3 High" for help visualizing and detecting Bollinger Band break-outs
- Dynamic color coding based on price relationship
Optional Ichimoku Cloud overlay
- Complete Ichimoku implementation with customizable periods
- Dynamic cloud coloring based on trend direction
- Toggleable overlay that doesn't interfere with other indicators
🚨 Comprehensive Alert System
Real-Time JSON Alerts
- Sends structured data on every confirmed bar close
- Includes all indicator values: BB levels, EMAs, MACD, RSI
- Contains signal states and crossover conditions
- Perfect for automated trading systems and webhooks
{"timestamp":1753118700000,"symbol":"ETHUSD","timeframe":"5","price":3773.3,"bollinger_bands":{"upper":3826.95,"basis":3788.32,"lower":3749.68},"emas":{"ema_9":3780.45,"ema_21":3788.92,"ema_50":3800.79,"ema_200":3787.74,"sma_3_high":3789.45},"macd":{"macd":-10.1932,"signal":-11.3266,"histogram":1.1334},"rsi":{"rsi":40.5,"rsi_ma":39.32,"level":"neutral"}}
Specific Alert Conditions
- MACD histogram state changes (rising to falling, falling to rising)
- RSI overbought/oversold crossovers
- All pattern detections (BB Bounce, Tweezer patterns)
- Bollinger Band breakout alerts
🎨 Visual Elements
Pattern Identification
- ♻ symbols for Bollinger Band breakout patterns (green for bullish, red for bearish)
- ❙❙ symbols for tweezer patterns (green below for bottoms, red above for tops)
- Color-coded band fills for trend visualization
Chart Overlay Options
- All moving averages with distinct colors
- Bollinger Bands with inner and outer boundaries
- Optional Ichimoku cloud with trend-based coloring
Trading Applications
Reversal Trading
- Identify high-probability reversal points at extreme price levels
- Use failed breakout patterns for entry signals
- Combine multiple timeframes for enhanced accuracy
Trend Analysis
- Monitor moving average relationships for trend direction
- Use Ichimoku cloud for trend strength assessment
- Track momentum with MACD and RSI integration
Risk Management
- ATR-based volatility filtering reduces false signals
- Multiple confirmation requirements improve signal quality
- Real-time alerts enable prompt decision making
Suggested Use
- Use on multiple timeframes for confluence
- Combine with support/resistance levels for enhanced accuracy
- Set up alerts for hands-free monitoring
- Customize settings based on market volatility and trading style
- Consider volume confirmation for stronger signals
