v2.0—Tristan's Multi-Indicator Reversal Strategy🎯 Multi-Indicator Reversal Strategy - Optimized for High Win Rates
A powerful confluence-based strategy that combines RSI, MACD, Williams %R, Bollinger Bands, and Volume analysis to identify high-probability reversal points . Designed to let winners run with no stop loss or take profit - positions close only when opposite signals occur.
Also, the 3 hour timeframe works VERY well—just a lot less trades.
📈 Proven Performance
This strategy has been backtested and optimized on multiple blue-chip stocks with 80-90%+ win rates on 1-hour timeframes from Aug 2025 through Oct 2025:
✅ V (Visa) - Payment processor
✅ MSFT (Microsoft) - Large-cap tech
✅ WMT (Walmart) - Retail leader
✅ IWM (Russell 2000 ETF) - Small-cap index
✅ NOW (ServiceNow) - Enterprise software
✅ WM (Waste Management) - Industrial services
These stocks tend to mean-revert at extremes, making them ideal candidates for this reversal-based approach. I only list these as a way to show you the performance of the script. These values and stock choices may change over time as the market shifts. Keep testing!
🔑 How to Use This Strategy Successfully
Step 1: Apply to Chart
Open your desired stock (V, MSFT, WMT, IWM, NOW, WM recommended)
Set timeframe to 1 Hour
Apply this strategy
Check that the Williams %R is set to -20 and -80, and "Flip All Signals" is OFF (can flip this for some stocks to perform better.)
Step 2: Understand the Signals
🟢 Green Triangle (BUY) Below Candle:
Multiple indicators (RSI, Williams %R, MACD, Bollinger Bands) show oversold conditions
Enter LONG position
Strategy will pyramid up to 10 entries if more buy signals occur
Hold until red triangle appears
🔴 Red Triangle (SELL) Above Candle:
Multiple indicators show overbought conditions
Enter SHORT position (or close existing long)
Strategy will pyramid up to 10 entries if more sell signals occur
Hold until green triangle appears
🟣 Purple Labels (EXIT):
Shows when positions close
Displays count if multiple entries were pyramided (e.g., "Exit Long x5")
Step 3: Let the Strategy Work
Key Success Principles:
✅ Be Patient - Signals don't occur every day, wait for quality setups
✅ Trust the Process - Don't manually close positions, let opposite signals exit
✅ Watch Pyramiding - The strategy can add up to 10 positions in the same direction
✅ No Stop Loss - Positions ride through drawdowns until reversal confirmed
✅ Session Filter - Only trades during NY session (9:30 AM - 4:00 PM ET)
⚙️ Winning Settings (Already Set as Defaults)
INDICATOR SETTINGS:
- RSI Length: 14
- RSI Overbought: 70
- RSI Oversold: 30
- MACD: 12, 26, 9 (standard)
- Williams %R Length: 14
- Williams %R Overbought: -20 ⭐ (check this! And adjust to your liking)
- Williams %R Oversold: -80 ⭐ (check this! And adjust to your liking)
- Bollinger Bands: 20, 2.0
- Volume MA: 20 periods
- Volume Multiplier: 1.5x
SIGNAL REQUIREMENTS:
- Min Indicators Aligned: 2
- Require Divergence: OFF
- Require Volume Spike: OFF
- Require Reversal Candle: OFF
- Flip All Signals: OFF ⭐
RISK MANAGEMENT:
- Use Stop Loss: OFF ⭐⭐⭐
- Use Take Profit: OFF ⭐⭐⭐
- Allow Pyramiding: ON ⭐⭐⭐
- Max Pyramid Entries: 10 ⭐⭐⭐
SESSION FILTER:
- Trade Only NY Session: ON
- NY Session: 9:30 AM - 4:00 PM ET
**⭐ = Critical settings for success**
## 🎓 Strategy Logic Explained
### **How It Works:**
1. **Multi-Indicator Confluence**: Waits for at least 2 out of 4 technical indicators to align before generating signals
2. **Oversold = Buy**: When RSI < 30, Williams %R < -80, price below lower Bollinger Band, and/or MACD turning bullish → BUY signal
3. **Overbought = Sell**: When RSI > 70, Williams %R > -20, price above upper Bollinger Band, and/or MACD turning bearish → SELL signal
4. **Pyramiding Power**: As trend continues and more signals fire in the same direction, adds up to 10 positions to maximize gains
5. **Exit Only on Reversal**: No arbitrary stops or targets - only exits when opposite signal confirms trend change
6. **Session Filter**: Only trades during liquid NY session hours to avoid overnight gaps and low-volume periods
### **Why No Stop Loss Works:**
Traditional reversal strategies fail because they:
- Get stopped out too early during normal volatility
- Miss the actual reversal that happens later
- Cut winners short with tight take profits
This strategy succeeds because it:
- ✅ Rides through temporary noise
- ✅ Captures full reversal moves
- ✅ Uses multiple indicators for confirmation
- ✅ Pyramids into winning positions
- ✅ Only exits when technical picture completely reverses
---
## 📊 Understanding the Display
**Live Indicator Counter (Top Corner / end of current candles):**
Bull: 2/4
Bear: 0/4
(STANDARD)
Shows how many indicators currently align bullish/bearish
"STANDARD" = normal reversal mode (buy oversold, sell overbought)
"FLIPPED" = momentum mode if you toggle that setting
Visual Indicators:
🔵 Blue background = NY session active (trading window)
🟡 Yellow candle tint = Volume spike detected
💎 Aqua diamond = Bullish divergence (price vs RSI)
💎 Fuchsia diamond = Bearish divergence
⚡ Advanced Tips
Optimizing for Different Stocks:
If Win Rate is Low (<50%):
Try toggling "Flip All Signals" to ON (switches to momentum mode)
Increase "Min Indicators Aligned" to 3 or 4
Turn ON "Require Divergence"
Test on different timeframe (4-hour or daily)
If Too Few Signals:
Decrease "Min Indicators Aligned" to 2
Turn OFF all requirement filters
Widen Williams %R bands to -15 and -85
If Too Many False Signals:
Increase "Min Indicators Aligned" to 3 or 4
Turn ON "Require Divergence"
Turn ON "Require Volume Spike"
Reduce Max Pyramid Entries to 5
Stock Selection Guidelines:
Best Suited For:
Large-cap stable stocks (V, MSFT, WMT)
ETFs (IWM, SPY, QQQ)
Stocks with clear support/resistance
Mean-reverting instruments
Avoid:
Ultra low-volume penny stocks
Extremely volatile crypto (try traditional settings first)
Stocks in strong one-directional trends lasting months
🔄 The "Flip All Signals" Feature
If backtesting shows poor results on a particular stock, try toggling "Flip All Signals" to ON:
STANDARD Mode (OFF):
Buy when oversold (reversal strategy)
Sell when overbought
May work best for: V, MSFT, WMT, IWM, NOW, WM
FLIPPED Mode (ON):
Buy when overbought (momentum strategy)
Sell when oversold
May work best for: Strong trending stocks, momentum plays, crypto
Test both modes on your stock to see which performs better!
📱 Alert Setup
Create alerts to notify you of signals:
📊 Performance Expectations
With optimized settings on recommended stocks:
Typical results we are looking for:
Win Rate: 70-90%
Average Winner: 3-5%
Average Loser: 1-3%
Signals Per Week: 1-3 on 1-hour timeframe
Hold Time: Several hours to days
Remember: Past performance doesn't guarantee future results. Always use proper risk management.
ค้นหาในสคริปต์สำหรับ "reversal"

Baha'i Reversal Points [CC]The Baha'i Reversal Points is a custom creation that combines some of my favorite passions, creating stock indicator scripts and my faith. The Baha'i Faith believes in the oneness of God and all religions, and sees the number 9 as significant because that is the number of major world religions as well as the Baha'i symbol is a nine-pointed star. The number 19 is also seen as significant because in the Baha'i calendar, there are 19 months, and each month is made up of 19 days. Anyway, with all that being explained, I created these reversal points to find the points where the last 19 highs or lows are higher or lower, respectively than the previous high or low nine days ago. As with many indicators, this does have some hits and misses but does a pretty good job of finding reversal points based on these criteria.
There are a few different ways to analyze this data to determine when to buy or sell. I have set the default behavior for when we encounter the first time that the amount of highs or lows is greater than or equal to the length amount using a crossover or crossunder alert. You could also ignore the crossover or crossunder alerts and buy when the count is greater than or equal to the length, which can happen for extended periods depending on the underlying trend. Overall, buy when the buy label appears and sell when the sell label appears.
Let me know if there are any other custom indicators or scripts you would like to see me publish!

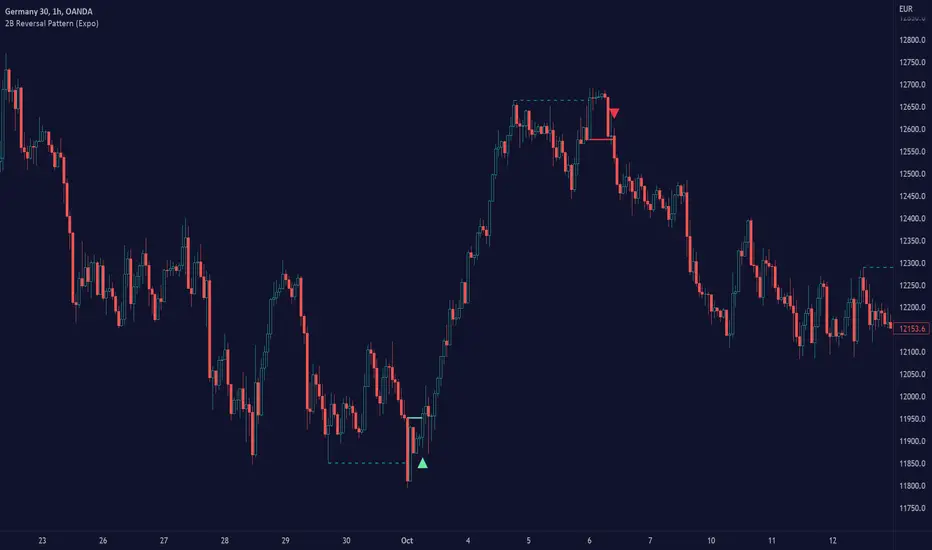
2B Reversal Pattern (Expo)█ Overview
The 2B reversal pattern , also called the "spring pattern", is a popular chart pattern professional traders use to identify potential trend reversals. It occurs when the price appears to be breaking down or up and then suddenly bounces back up/down, forming a "spring" or "false breakout" pattern. This pattern indicates that the trend is losing momentum and that a reversal is coming.
In a bearish market , the "spring pattern" occurs when the price of an asset breaks below a support level, causing many traders to sell their positions and causing the price to drop even further. However, the selling pressure eases at some point, and the price begins to rebound, "springing" back above the support level. This rebound creates a long opportunity for traders who can enter the market at a lower price.
In a bullish market , the "spring pattern" occurs when the price of an asset breaks above a resistance level, causing many traders to buy into the asset and drive the price up even further. However, the buying pressure eases at some point, and the price begins to decline, "springing" below the resistance level. This decline creates a selling opportunity for traders who can short the market at a higher price.
█ What are the benefits of using the 2B Reversal Pattern?
The benefits of using the 2B Reversal pattern as a trader include identifying potential buying or selling opportunities with reduced risk. By waiting for the price to "spring back" to the initial breakout level, traders can avoid entering the market too soon and minimize the risk of potential losses.
█ How to use
Traders can use the 2B reversal pattern to identify reversals. If the pattern occurs after an uptrend, traders may sell their long positions or enter a short position, anticipating a reversal to a downtrend. If the pattern occurs after a downtrend, traders may sell their short positions or enter a long position, anticipating a reversal to an uptrend.
█ Consolidation Strategy
First, traders should identify a period of price consolidation or a trading range where the price has been trading sideways for some time. The key feature of the "spring pattern" is a sudden, sharp move downward/upwards through the lower/upper boundary of this trading range, often accompanied by high volume.
However, instead of continuing to move lower/higher, the price then quickly recovers and moves back into the trading range, often on low volume. This quick recovery is the "spring" part of the pattern and suggests that the market has rejected the lower/higher price and that buying/selling pressure is building.
Traders may use the "spring pattern" as a signal to buy/sell the asset, suggesting strong demand/supply for the stock at the lower/higher price level. However, as with all trading strategies, it is important to use other indicators and to manage risk to minimize potential losses carefully.
-----------------
Disclaimer
The information contained in my Scripts/Indicators/Ideas/Algos/Systems does not constitute financial advice or a solicitation to buy or sell any securities of any type. I will not accept liability for any loss or damage, including without limitation any loss of profit, which may arise directly or indirectly from the use of or reliance on such information.
All investments involve risk, and the past performance of a security, industry, sector, market, financial product, trading strategy, backtest, or individual's trading does not guarantee future results or returns. Investors are fully responsible for any investment decisions they make. Such decisions should be based solely on an evaluation of their financial circumstances, investment objectives, risk tolerance, and liquidity needs.
My Scripts/Indicators/Ideas/Algos/Systems are only for educational purposes!
Heikin-Ashi Reversals with Region & DotsIf you want to use Heiken Ashi candles as a way to screen for bullish and bearish reversal.
Green background is stay long and strong. Red background = potential top or bearish continuation.
Yellow dots show strong red heiken ashi candles with small upside wicks. The next candle determines whether it should be green or red. If next heiken ashi candle closes above the current candle = green, bull trend still in line. If next heiken ashi candle closes below, then time to sell

3 Drive Harmonic Pattern [TradingFinder] Three Drive Reversal🔵 Introduction
The Three Drive harmonic pattern closely resembles other price structures such as Wedge Pattern and Three Push Pattern, yet it stands out due to its precise use of Fibonacci ratios and symmetrical price movements.
This pattern comprises three consecutive and symmetrical price drives, each validated by key Fibonacci ratios (1.27 and 1.618), which help identify critical Potential Reversal Zones (PRZ).
Unlike the Wedge, which relies on converging trend lines and can indicate either continuation or reversal, and the Three Push, which lacks defined Fibonacci ratios and symmetry, the Three Drive pattern defines PRZ with greater accuracy, providing traders with high-probability trading opportunities.
This pattern appears in both bullish and bearish trends. After the completion of the third drive (Drive 3), it signals the market's readiness to reverse direction. The PRZ in this pattern serves as a crucial zone where price is highly likely to reverse, offering a strategic point for entering or exiting trades. Professional traders utilize the Three Drive pattern and PRZ as essential tools for analyzing and capitalizing on potential market reversals.
Bullish Pattern :
Bearish Pattern :
🔵 How to Use
The Three Drive harmonic pattern is an effective tool for identifying potential reversal points in the market. By utilizing Fibonacci extension levels (1.27 and 1.618) and focusing on the pattern’s symmetry, traders can pinpoint Potential Reversal Zones (PRZ) where the price is likely to change direction. This pattern works in both bearish and bullish scenarios, each with distinct characteristics and trading opportunities.
🟣 Bullish Three Drive Pattern
The bullish Three Drive pattern develops during a downtrend, indicating a potential reversal to the upside. Similar to its bearish counterpart, this pattern features three consecutive downward price movements (drives) with retracements in between. The third drive concludes within the PRZ, which serves as a strong support zone where the price is expected to reverse upwards.
The first drive begins with a downward movement, followed by a retracement to the 0.618 Fibonacci level. The second drive continues downward to reach a 1.27 or 1.618 Fibonacci extension of the retracement. Finally, the third drive aligns with the PRZ, where a confluence of Fibonacci levels creates a high-probability support zone.
In the PRZ, traders look for bullish confirmation signals such as bullish candlestick patterns (e.g., bullish engulfing or pin bars) or increasing trading volume. Once confirmation is observed, the PRZ becomes an ideal entry point for a buy position. Stop-loss orders are placed slightly below the PRZ to minimize risk, while take-profit targets are set at key resistance levels or Fibonacci retracement levels.
🟣 Bearish Three Drive Pattern
The bearish Three Drive pattern forms during an uptrend, signaling a potential reversal to the downside. This pattern consists of three consecutive upward price movements (drives) and intermediate retracements. Each drive aligns with Fibonacci extension levels, and the third drive ends within the PRZ, indicating a high probability of a bearish reversal.
In the first drive, the price moves upward and then retraces to approximately the 0.618 Fibonacci retracement level, forming the base for the second drive. The second drive then extends upward to the 1.27 or 1.618 Fibonacci extension of the preceding retracement. This process repeats for the third drive, which reaches the PRZ, typically defined by the convergence of Fibonacci levels from previous drives.
Once the PRZ is identified, traders look for confirmation signals such as bearish candlestick patterns (e.g., bearish engulfing or pin bars) or declining trading volume. If confirmation is present, the PRZ becomes an optimal zone for entering a sell position. Stop-loss levels are typically placed slightly above the PRZ to protect against pattern failure, and take-profit targets are set at key support levels or Fibonacci retracement levels of the overall structure.
🟣 Three Drive Vs Wedge Pattern Vs 3 Push pattern
The Three Drive, Wedge, and Three Push patterns are all used to identify potential price reversal points, but they differ significantly in structure and application. The Three Drive pattern is based on three consecutive and symmetrical price movements, validated by precise Fibonacci ratios (1.27 and 1.618), to define Potential Reversal Zones (PRZ).
In contrast, the Wedge pattern relies on converging trend lines and does not require Fibonacci ratios; it can act as either a reversal or continuation pattern. Meanwhile, the Three Push pattern shares similarities with Three Drive but lacks precise symmetry and Fibonacci-based validation.
Instead of a PRZ, Three Push focuses on identifying areas of support and resistance, often signaling weakening momentum in the current trend. Among these, the Three Drive pattern is more reliable for pinpointing high-probability reversal zones due to its strict Fibonacci-based and symmetrical structure.
🔵 Setting
🟣 Logical Setting
ZigZag Pivot Period : You can adjust the period so that the harmonic patterns are adjusted according to the pivot period you want. This factor is the most important parameter in pattern recognition.
Show Valid Format : If this parameter is on "On" mode, only patterns will be displayed that they have exact format and no noise can be seen in them. If "Off" is, the patterns displayed that maybe are noisy and do not exactly correspond to the original pattern.
Show Formation Last Pivot Confirm : if Turned on, you can see this ability of patterns when their last pivot is formed. If this feature is off, it will see the patterns as soon as they are formed. The advantage of this option being clear is less formation of fielded patterns, and it is accompanied by the latest pattern seeing and a sharp reduction in reward to risk.
Period of Formation Last Pivot : Using this parameter you can determine that the last pivot is based on Pivot period.
🟣 Genaral Setting
Show : Enter "On" to display the template and "Off" to not display the template.
Color : Enter the desired color to draw the pattern in this parameter.
LineWidth : You can enter the number 1 or numbers higher than one to adjust the thickness of the drawing lines. This number must be an integer and increases with increasing thickness.
LabelSize : You can adjust the size of the labels by using the "size.auto", "size.tiny", "size.smal", "size.normal", "size.large" or "size.huge" entries.
🟣 Alert Setting
Alert : On / Off
Message Frequency : This string parameter defines the announcement frequency. Choices include: "All" (activates the alert every time the function is called), "Once Per Bar" (activates the alert only on the first call within the bar), and "Once Per Bar Close" (the alert is activated only by a call at the last script execution of the real-time bar upon closing). The default setting is "Once per Bar".
Show Alert Time by Time Zone : The date, hour, and minute you receive in alert messages can be based on any time zone you choose. For example, if you want New York time, you should enter "UTC-4". This input is set to the time zone "UTC" by default.
🔵 Conclusion
The Three Drive pattern is a highly effective harmonic tool for identifying potential reversal points in the market. By leveraging its symmetrical structure and precise Fibonacci ratios (1.27 and 1.618), this pattern provides traders with clear entry and exit signals, enhancing the accuracy of their trades.
Whether in bullish or bearish scenarios, the identification of the Potential Reversal Zone (PRZ) serves as a critical aspect of this pattern, enabling traders to anticipate price movements with greater confidence.
Compared to similar patterns like Wedge and Three Push, the Three Drive pattern stands out for its stringent reliance on Fibonacci levels and symmetrical price movements, making it a more robust choice for forecasting reversals. However, as with any technical analysis tool, its effectiveness increases when combined with confirmation signals, such as candlestick patterns, volume analysis, and broader market context.
Mastering the Three Drive pattern requires practice and attention to detail, especially in accurately defining the PRZ and ensuring the pattern adheres to its criteria. Traders who consistently apply this pattern as part of a comprehensive trading strategy can capitalize on high-probability opportunities and improve their overall performance in the market.

Price breakout and reversal [TCS] | PAThis indicator is designed to identify potential breaks and reversals in price movements for a financial instrument.
The indicator displays several elements to assist users in spotting specific market conditions:
1. High and Low Pivots : The indicator marks the highest and lowest points on the price chart within a customizable lookback period. These pivots represent important turning points in the price movement and serve as reference levels for potential breakouts and reversals.
2. Fair Value Line : A horizontal line is drawn at the midpoint between the high and low pivots. This line represents the "fair value" based on the recent price action. Traders may consider this level as a reference for evaluating the price's deviation from its average value.
3. Bullish Breakouts : When the closing price of the financial instrument crosses above the high pivot the indicator identifies a potential bullish breakout. This suggests a possible buying opportunity.
4. Bearish Breakouts : Conversely, a bearish breakout is identified when the closing price crosses below the low pivot. This may indicate a selling opportunity.
5. Fair Value Breakouts : In addition to regular breakouts, the indicator can detect breakouts based on the fair value line. If the closing price crosses above or below the fair value line, it may signal a fair value breakout, indicating the price's potential return to its average level.
6. Reversals : Reversal patterns are essential in technical analysis. The indicator identifies potential bullish and bearish reversals .
The indicator enhances its visual signals with geometric shapes (triangles and diamonds) placed above or below the price bars to represent different types of breakouts and reversals.
Moreover, the indicator can be configured to send alerts to the user when any of these specific events occur, helping traders stay informed and respond promptly to potential trading opportunities.
Please note that this code is for educational purposes only and should not be used for trading without further testing and analysis.

Deep Crab Harmonic Pattern [TradingFinder] Reversal Zones🔵 Introduction
The Deep Crab pattern is a 5-point extension harmonic structure (X-A-B-C-D) used in technical analysis to identify potential reversal points in financial markets. Like the original Crab pattern, it heavily relies on a 1.618 XA projection to form the Potential Reversal Zone (PRZ).
However, the key difference lies in the B point, which must be an 0.886 retracement of the XA leg. The D point in this pattern typically extends beyond the X point, signaling a strong potential reversal in price movement.
Bullish Deep Crab :
The Bullish Deep Crab is a pattern used in technical analysis to spot potential trend reversals. It signals a shift from a downtrend to an uptrend. Traders enter a buy position at the D point and set a stop-loss below point X, anticipating a price increase.
Bearish Deep Crab :
The Bearish Deep Crab is a reversal pattern that indicates the potential end of an uptrend. Traders enter a sell position at point D and set a stop-loss above point X, expecting the price to fall afterward.
🟣 Crab Vs Deep Crab
The Crab and Deep Crab patterns are both used to identify reversal points in technical analysis, but they differ in terms of correction depth :
Crab : The B point retraces between 38.2% to 61.8% of the XA leg, and point D extends beyond X, indicating a price reversal after a smaller correction.
Deep Crab : The B point retraces more deeply, around 88.6% of the XA leg, and point D has a stronger extension, signaling a reversal after a deeper correction.
The Deep Crab is more suited for identifying stronger price movements.
🔵 How to Use
To effectively use the Deep Crab pattern, it’s essential to correctly identify its five key points (X, A, B, C, and D) based on Fibonacci retracements and extensions. Traders look for a deep retracement at point B, followed by an extended move to point D, which typically signals a strong price reversal.
Once these points are established, traders can strategically enter positions at point D with appropriate stop-loss and take-profit levels, capitalizing on the anticipated market reversal. Proper use of Fibonacci tools is crucial for accurate pattern identification.
🟣 Bullish Deep Crab
To use the Bullish Deep Crab pattern, a trader identifies point D as the key price reversal point in a downtrend. Using Fibonacci tools, points X, A, B, and C are identified, with point B showing an 88.6% retracement of XA, and CD extending 1.618% of XA.
The trader enters a buy position at point D and sets a stop-loss below X, expecting a reversal from a downtrend to an uptrend.
🟣 Bearish Deep Crab
In the Bearish Deep Crab pattern, point D acts as the reversal point in an uptrend. After identifying points X, A, B, and C, D extends 1.618% of XA. Point B retraces 88.6% of XA. Traders enter a sell position at point D and place a stop-loss above X, anticipating a drop in price.
🔵 Setting
🟣 Logical Setting
ZigZag Pivot Period : You can adjust the period so that the harmonic patterns are adjusted according to the pivot period you want. This factor is the most important parameter in pattern recognition.
Show Valid Forma t: If this parameter is on "On" mode, only patterns will be displayed that they have exact format and no noise can be seen in them. If "Off" is, the patterns displayed that maybe are noisy and do not exactly correspond to the original pattern.
Show Formation Last Pivot Confirm : if Turned on, you can see this ability of patterns when their last pivot is formed. If this feature is off, it will see the patterns as soon as they are formed. The advantage of this option being clear is less formation of fielded patterns, and it is accompanied by the latest pattern seeing and a sharp reduction in reward to risk.
Period of Formation Last Pivot : Using this parameter you can determine that the last pivot is based on Pivot period.
🟣 Genaral Setting
Show : Enter "On" to display the template and "Off" to not display the template.
Color : Enter the desired color to draw the pattern in this parameter.
LineWidth : You can enter the number 1 or numbers higher than one to adjust the thickness of the drawing lines. This number must be an integer and increases with increasing thickness.
LabelSize : You can adjust the size of the labels by using the "size.auto", "size.tiny", "size.smal", "size.normal", "size.large" or "size.huge" entries.
🟣 Alert Setting
Alert : On / Off
Message Frequency : This string parameter defines the announcement frequency. Choices include: "All" (activates the alert every time the function is called), "Once Per Bar" (activates the alert only on the first call within the bar), and "Once Per Bar Close" (the alert is activated only by a call at the last script execution of the real-time bar upon closing). The default setting is "Once per Bar".
Show Alert Time by Time Zone : The date, hour, and minute you receive in alert messages can be based on any time zone you choose. For example, if you want New York time, you should enter "UTC-4". This input is set to the time zone "UTC" by default.
🔵 Conclusion
The Deep Crab pattern is a valuable reversal tool in technical analysis, known for its deep retracement and extended price movements.
Unlike other harmonic patterns, it emphasizes identifying critical points where price action is likely to reverse sharply. This pattern works well in both bullish and bearish market scenarios, offering clear signals for entry and exit points.
However, successful application requires a deep understanding of market behavior and precise use of technical tools like Fibonacci retracement. Overall, mastering this pattern can enhance trading strategies and risk management.

Pivot Points High Low & Missed Reversal Levels [LuxAlgo]Pivot Points High/Low, sometimes referred to as "Bar Count Reversals" allows highlighting market prices local tops and bottoms. This method compares the price value at a certain index within a user-specified window length and tests whether it is the highest (pivot high) or lowest (pivot low).
This method can return successive pivots of the same type, thus missing certain reversals, as such, we aimed to highlight those missed reversals and provide a level at their location to determine if they had any significant role to play. A zig-zag is additionally built, connecting regular pivots with missed reversals.
Settings
Pivot Length: Determine the "Bar Count Reversals" window size. higher values will highlight more significant reversals.
Other settings control the look of the displayed graphical elements within the indicator.
Usage
Missed reversals are highlighted by labels with a ghost emoji, a Zig-Zag line connecting a missed reversal is dashed. Note that labels are offset by -Pivot Length bars (with the exception of the most recent one), and as such are detected further ahead of their location.
When a missed reversal is detected, a level is displayed, starting at the location of the missed reversal and ending when a new missed reversal is detected.
These levels can be used as support and resistance.
The most recent label estimates the possible location of a confirmed reversal, and will continuously readjust whether price makes a new higher high/lower low depending on the type of previously detected pivot. A level is also made out of this estimated reversal.

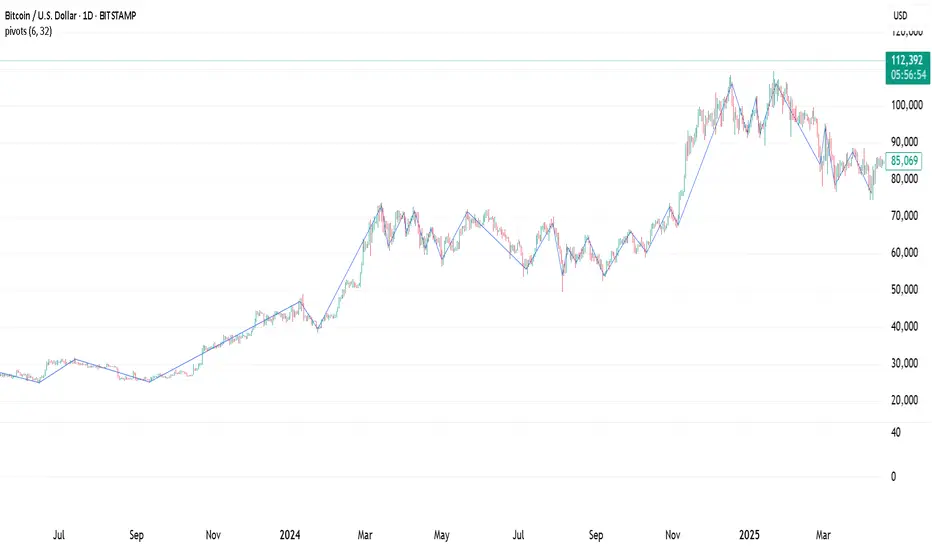
Pivot Points. High & Lows By Reversal PercentageLibrary "Pivot Points. High & Lows By Reversal Percentage" by Jal9000
This Pine Script library provides a robust function for identifying and tracking pivot points (reversal points) in price data, suitable for integration into custom trading indicators and strategies.
🛠️ Main Features:
- ✅ Identifies pivot highs and lows based on configurable price movement thresholds.
- ✅ Lightweight. No candle backtracing used. Much less computation heavy.
- ✅ Supports multiple calls (with different values) within a single script.
- ✅ Compatible with request.security for multi-timeframe analysis.
- ✅ Returns both confirmed and temporary pivots for flexible integration.
- ✅ Pinescript V5 and V6 compliant code.
Purpose:
The pivots library enables Pine Script developers to easily add pivot point detection to their scripts. It identifies significant price reversals by evaluating price movements against a minimum range threshold ( min_range_pct ) and confirming reversals based on a percentage ( reversal_pct ) of the prior trend’s magnitude. The library supports multiple simultaneous calls with different settings, making it ideal for multi-timeframe strategies.
How It Works:
The library’s f_calculatePivot function tracks price movements to detect pivot points:
Minimum Range Threshold : A potential pivot is considered if the price moves beyond the min_range_pct percentage of the current high (for a high pivot) or low (for a low pivot), ensuring sufficient movement.
Reversal Confirmation : A pivot is confirmed if the price reverses from the potential pivot by at least the reversal_pct percentage of the distance between the last confirmed pivot and the current potential pivot, measuring the retracement relative to the prior trend’s magnitude.
The function alternates between tracking highs (in an uptrend) and lows (in a downtrend), updating the trend when a pivot is confirmed.
State management uses an array of pivot_state objects, allowing independent calculations for different timeframes and min_range_pct values within the same script.
## Technical Reference
Functions:
f_calculatePivot(series float _high, series float _low, float _min_range_pct, float _reversal_pct) →
- Parameters:
_high : The high price series (e.g., high or math.max(open, close) ).
_low : The low price series (e.g., low or math.min(open, close) ).
_min_range_pct : The minimum percentage price movement to consider a potential pivot.
_reversal_pct : The percentage of the prior trend’s distance required to confirm a pivot.
- Returns:
A tuple containing:
isNewPivot : Boolean indicating if a new pivot was confirmed.
last_confirmed_pivot : The most recent confirmed pivot (type pivot ).
temp_pivot : The current temporary pivot (type pivot ).
Pivot type:
idx (series int) : Bar index of the pivot.
typ (series int) : Type of pivot ( PIVOT_HIGH or PIVOT_LOW ).
prc (series float) : Price of the pivot.
tme (series int) : Timestamp of the pivot.
Constants (internal):
TREND_LONG , TREND_SHORT : Trend direction indicators (1, -1).
PIVOT_HIGH , PIVOT_LOW : Pivot type indicators (1, -1).
✨ Example of Use:
//@version=5
indicator("Pivot Example", overlay=true)
import jal9000/pivots/1 as pivots
// Inputs
min_range_pct = input.float(20.0, 'Min Range %')
reversal_pct = input.float(30.0, 'Reversal %')
ignore_wick = input.bool(true, 'Ignore wick')
h = ignore_wick ? math.max(open, close) : high
l = ignore_wick ? math.min(open, close) : low
// Call the function with high, low, and input parameters
= pivots.f_calculatePivot(h, l, min_range_pct, reversal_pct)
// Variable to store previous confirmed pivot outside the function
var pivots.pivot prev_confirmed_pivot = na
// Draw the line if a new pivot is confirmed and previous pivot exists
if is_new_pivot
if not na(prev_confirmed_pivot) and not na(new_confirmed_pivot)
line.new(x1 = prev_confirmed_pivot.idx, y1 = prev_confirmed_pivot.prc, x2 = new_confirmed_pivot.idx, y2 = new_confirmed_pivot.prc, color = color.blue, width = 1)
prev_confirmed_pivot := new_confirmed_pivot
## Release Notes
v1
- Initial release of the pivots library with f_calculatePivot function for detecting pivot points and supporting multiple configurations and timeframes.
v2
- Code is Pinescript V6 ready. Remains identified as V5, but changing the version number is the only thing that is required to be v6.
Cluster Reversal Zones📌 Cluster Reversal Zones – Smart Market Turning Point Detector
📌 Category : Public (Restricted/Closed-Source) Indicator
📌 Designed for : Traders looking for high-accuracy reversal zones based on price clustering & liquidity shifts.
🔍 Overview
The Cluster Reversal Zones Indicator is an advanced market reversal detection tool that helps traders identify key turning points using a combination of price clustering, order flow analysis, and liquidity tracking. Instead of relying on static support and resistance levels, this tool dynamically adjusts to live market conditions, ensuring traders get the most accurate reversal signals possible.
📊 Core Features:
✅ Real-Time Reversal Zone Mapping – Detects high-probability market turning points using price clustering & order flow imbalance.
✅ Liquidity-Based Support/Resistance Detection – Identifies strong rejection zones based on real-time liquidity shifts.
✅ Order Flow Sensitivity for Smart Filtering – Filters out weak reversals by detecting real market participation behind price movements.
✅ Momentum Divergence for Confirmation – Aligns reversal zones with momentum divergences to increase accuracy.
✅ Adaptive Risk Management System – Adjusts risk parameters dynamically based on volatility and trend state.
🔒 Justification for Mashup
The Cluster Reversal Zones Indicator contains custom-built methodologies that extend beyond traditional support/resistance indicators:
✔ Smart Price Clustering Algorithm: Instead of plotting fixed support/resistance lines, this system analyzes historical price clustering to detect active reversal areas.
✔ Order Flow Delta & Liquidity Shift Sensitivity: The tool tracks real-time order flow data, identifying price zones with the highest accumulation or distribution levels.
✔ Momentum-Based Reversal Validation: Unlike traditional indicators, this tool requires a momentum shift confirmation before validating a potential reversal.
✔ Adaptive Reversal Filtering Mechanism: Uses a combination of historical confluence detection + live market validation to improve accuracy.
🛠️ How to Use:
• Works well for reversal traders, scalpers, and swing traders seeking precise turning points.
• Best combined with VWAP, Market Profile, and Delta Volume indicators for confirmation.
• Suitable for Forex, Indices, Commodities, Crypto, and Stock markets.
🚨 Important Note:
For educational & analytical purposes only.

Zen MIG Reversal V1**Zen MIG Reversal V1**
Zen MIG Reversal is a pattern-based indicator that highlights rare reversal setups.
It’s designed to support traders in visually identifying potential turning points, especially following strong momentum or gap-style moves.
**How it works:**
- **Bullish Reversal:**
Detects 3 consecutive bullish candles. The third bar must have a low above the high of the first bar and below the 20 EMA. When this occurs, a light blue box is drawn across the 3-bar range, from high to the current bar’s low. A blue arrow appears below the prior bar.
- **Bearish Reversal:**
Detects 3 consecutive bearish candles. The third bar must have a high below the low of the first bar and above the 20 EMA. A light red box is drawn from low to the current bar’s high. A red arrow appears above the prior bar.
- Optional settings allow you to:
- Show or hide the EMA line
- Toggle the arrows
- Adjust smoothing settings for context
**Purpose:**
It’s best used for discretionary analysis, journaling, or studying price behavior in momentum-driven environments.
**Disclaimer:**
This script is for educational and informational purposes only. It does not provide financial advice or trade recommendations. Always backtest and use proper risk management before applying any indicator to live trading.

N Bar Reversal Detector [LuxAlgo]The N Bar Reversal Detector is designed to detect and highlight N-bar reversal patterns in user charts, where N represents the length of the candle sequence used to detect the patterns. The script incorporates various trend indicators to filter out detected signals and offers a range of customizable settings to fit different trading strategies.
🔶 USAGE
The N-bar reversal pattern extends the popular 3-bar reversal pattern. While the 3-bar reversal pattern involves identifying a sequence of three bars signaling a potential trend reversal, the N-bar reversal pattern builds on this concept by incorporating additional bars based on user settings. This provides a more comprehensive indication of potential trend reversals. The script automates the identification of these patterns and generates clear, visually distinct signals to highlight potential trend changes.
When a reversal chart pattern is confirmed and aligns with the price action, the pattern's boundaries are extended to create levels. The upper boundary serves as resistance, while the lower boundary acts as support.
The script allows users to filter patterns based on the trend direction identified by various trend indicators. Users can choose to view patterns that align with the detected trend or those that are contrary to it.
🔶 DETAILS
🔹 The N-bar Reversal Pattern
The N-bar reversal pattern is a technical analysis tool designed to signal potential trend reversals in the market. It consists of N consecutive bars, with the first N-1 bars used to identify the prevailing trend and the Nth bar confirming the reversal. Here’s a detailed look at the pattern:
Bullish Reversal : In a bullish reversal setup, the first bar is the highest among the first N-1 bars, indicating a prevailing downtrend. Most of the remaining bars in this sequence should be bearish (closing lower than where they opened), reinforcing the existing downward momentum. The Nth (most recent) bar confirms a bullish reversal if its high price is higher than the high of the first bar in the sequence (standard pattern). For a stronger signal, the closing price of the Nth bar should also be higher than the high of the first bar.
Bearish Reversal : In a bearish reversal setup, the first bar is the lowest among the first N-1 bars, indicating a prevailing uptrend. Most of the remaining bars in this sequence should be bullish (closing higher than where they opened), reinforcing the existing upward momentum. The Nth bar confirms a bearish reversal if its low price is lower than the low of the first bar in the sequence (standard pattern). For a stronger signal, the closing price of the Nth bar should also be lower than the low of the first bar.
🔹 Min Percentage of Required Candles
This parameter specifies the minimum percentage of candles that must be bullish (for a bearish reversal) or bearish (for a bullish reversal) among the first N-1 candles in a pattern. For higher values of N, it becomes more challenging for all of the first N-1 candles to be consistently bullish or bearish. By setting a percentage value, P, users can adjust the requirement so that only a minimum of P percent of the first N-1 candles need to meet the bullish or bearish condition. This allows for greater flexibility in pattern recognition, accommodating variations in market conditions.
🔶 SETTINGS
Pattern Type: Users can choose the type of the N-bar reversal patterns to detect: Normal, Enhanced, or All. "Normal" detects patterns that do not necessarily surpass the high/low of the first bar. "Enhanced" detects patterns where the last bar surpasses the high/low of the first bar. "All" detects both Normal and Enhanced patterns.
Reversal Pattern Sequence Length: Specifies the number of candles (N) in the sequence used to identify a reversal pattern.
Min Percentage of Required Candles: Sets the minimum percentage of the first N-1 candles that must be bullish (for a bearish reversal) or bearish (for a bullish reversal) to qualify as a valid reversal pattern.
Derived Support and Resistance: Toggles the visibility of the support and resistance levels/zones.
🔹 Trend Filtering
Filtering: Allows users to filter patterns based on the trend indicators: Moving Average Cloud, Supertrend, and Donchian Channels. The "Aligned" option only detects patterns that align with the trend and conversely, the "Opposite" option detects patterns that go against the trend.
🔹 Trend Indicator Settings
Moving Average Cloud: Allows traders to choose the type of moving averages (SMA, EMA, HMA, etc.) and set the lengths for fast and slow moving averages.
Supertrend: Options to set the ATR length and factor for Supertrend.
Donchian Channels: Option to set the length for the channel calculation.
🔶 RELATED SCRIPTS
Reversal-Candlestick-Structure.
Reversal-Signals.

Reversal ConfirmationReversal Confirmation (RC)
This indicator identifies potential price reversals using a simple but effective two-candle pattern. It detects when a trend exhausts and confirms the reversal when the next candle eclipses the close of the reversal candle.
How It Works
The indicator uses a two-step process to confirm reversals:
Reversal Candle (R) - The first candle that closes in the opposite direction after a sustained trend. This signals potential exhaustion of the current move.
Confirmation Candle (C) - The candle that eclipses (closes beyond) the close of the reversal candle. This confirms the reversal is underway.
For a bullish reversal, the confirmation candle must close above the close of the reversal candle. For a bearish reversal, the confirmation candle must close below the close of the reversal candle.
Key Features
Requires a significant prior trend before looking for reversals, filtering out choppy sideways markets
Uses ATR to measure move significance, adapting to current volatility
Clean two-candle pattern that's easy to understand and trade
Visual dashed line showing the reversal candle close level that must be eclipsed
Built-in alerts for all signal types
Settings
Trend Lookback - Number of candles to analyze for prior trend detection (default: 7)
Trend Strength - Percentage of lookback candles required in trend direction (default: 0.7 = 70%)
Minimum Move (ATR multiple) - How large the prior move must be before signaling (default: 2.0)
Show Bullish/Bearish - Toggle each signal type on or off
Mark Reversal Candles - Toggle visibility of the reversal candle markers
Visual Signals
"R" with small circle - Marks the reversal candle where the pattern begins
"C" with triangle - Marks the confirmation candle (your entry signal)
Dashed line - Shows the close level of the reversal candle that must be eclipsed
Alerts
Three alert options are available:
Bullish Confirmation
Bearish Confirmation
Any Confirmation
How To Set Up Alerts
Add the indicator to your chart
Right-click on the chart and select "Add Alert" (or press Alt+A)
In the Condition dropdown, select "Reversal Confirmation"
Choose your preferred alert type
Set notification preferences (popup, email, sound, webhook)
Click "Create"
Tips For Best Results
Signals appearing at key support/resistance levels tend to be more reliable
Combine with VWAP, moving averages, or prior day high/low for confluence
Use higher timeframe trend direction as a filter
Increase Minimum Move ATR in volatile conditions to reduce false signals
Adjust Trend Lookback based on your timeframe (higher values for longer timeframes)
The Logic Behind It
After a sustained move in one direction, the first candle to close in the opposite direction signals potential exhaustion. However, one candle alone isn't enough. When the next candle eclipses the close of that reversal candle, it confirms that buyers (or sellers) have truly taken control and the reversal is underway.
Note: This indicator is for informational purposes only and should not be used as the sole basis for trading decisions. Always use proper risk management and consider combining with other forms of analysis.

Reversal Candlestick Setups (Doji, Outside, Extreme, Wick)Reversal Candlestick Setups – Doji, Outside, Extreme & Wick
This indicator identifies four high-probability reversal candlestick patterns across all timeframes: Doji Reversals, Outside Reversals, Extreme Reversals, and Wick Reversals. Each setup is based on clearly defined quantitative rules, allowing traders to filter noise and focus on strong reversal signals instead of relying on subjective visual interpretation.
The tool automatically scans every candle, highlights qualifying patterns on the chart, and provides alert options for both bullish and bearish versions of all four setups. This makes it suitable for intraday traders, swing traders, and positional traders seeking early reversal confirmation.
Included Setups
1. Doji Reversal Setup
Identifies candles with extremely small bodies relative to their range, combined with a smaller-than-average bar size. Useful for spotting market indecision before a directional shift.
2. Outside Reversal Setup
Flags candles that engulf the previous candle’s high–low range and exceed the average range by a multiplier. This is designed to capture strong momentum reversals driven by aggressive buying or selling.
3. Extreme Reversal Setup
Highlights large-bodied candles that dominate their overall range and exceed twice the average bar size. These signals aim to catch climactic exhaustion and institutional-level reversals.
4. Wick Reversal Setup
Detects candles with long rejection wicks, small bodies, and closes near an extreme of the range, supported by above-average bar size. Ideal for identifying sharp intrabar rejections.
Key Features
• Automatically detects all four reversal setups
• Works on all timeframes and symbols
• Customizable variables for deeper testing and optimization
• Clear bullish and bearish labels directly on the chart
• Fully integrated alert conditions for real-time notifications
• Suitable for crypto, stocks, indices, forex, and commodities
Who This Indicator Is For
• Traders who want objective, rule-based reversal detection
• Price action traders looking to enhance accuracy
• Systematic traders wanting quantifiable candlestick criteria
• Beginners learning reversal structures with visual guidance
• Professionals integrating reversal patterns into algorithmic or discretionary systems
How to Use
Add the indicator to your chart and enable alerts for the specific setups you want to track (e.g., “Bullish Wick Reversal”). Combine these signals with market structure, trend filters, volume analysis, or momentum indicators for increased conviction.

Three Bar Reversal Pattern [LuxAlgo]The Three Bar Reversal Pattern indicator identifies and highlights three bar reversal patterns on the user price chart.
The script also provides an option for incorporating various trend indicators used to filter out detected signals, allowing them to enhance their accuracy and help obtain a more comprehensive analysis.
🔶 USAGE
The script automates the detection of three-bar reversal patterns and provides a clear, visually identifiable signal for potential trend reversals.
When a reversal chart pattern is confirmed and price action aligns with the pattern, the pattern's boundaries are extended, forming levels, with the upper boundary often acting as a resistance and the lower boundary as a support.
The script allows users to filter patterns based on a specific trend direction detected by multiple trend indicators. Users can choose to view patterns that are either aligned with the detected trend or opposite to it.
Included trend indicators are: Moving Average Cloud, Supertrend, and Donchian Channels.
🔶 DETAILS
The three-bar reversal pattern is a technical analysis pattern that signals a potential reversal in the prevailing trend. The pattern consists of three consecutive bar formations:
First Bar and Second Bar: 2 consecutive of the same sentiment, representing the prevailing trend in the market.
Third Bar: Confirms the reversal by closing beyond the high or low of the first bar, signaling a potential change in market sentiment.
Various types of three-bar reversal patterns are documented. The script supports two main types:
Normal Pattern: Detects three-bar reversal patterns without requiring the third bar closing price to surpass the high (bullish pattern) or low (bearish pattern) of the first bar. It identifies basic formations signaling potential trend reversals.
Enhanced Pattern: Specifically identifies three-bar reversal patterns where the third bar closing price surpasses the high (bullish pattern) or low (bearish pattern) of the first bar. This type provides a more selective signal for stronger trend reversals.
🔶 SETTINGS
Pattern Type: Users can choose the type of 3-bar reversal patterns to detect: Normal, Enhanced, or All. "Normal" detects patterns that do not necessarily surpass the high/low of the first bar. "Enhanced" detects patterns where the third bar surpasses the high/low of the first bar. "All" detects both Normal and Enhanced patterns.
Derived Support and Resistance: Toggles the visibility of the support and resistance levels/zones.
🔹 Trend Filtering
Filtering: Allows users to filter patterns based on the trend indicators: Moving Average Cloud, Supertrend, and Donchian Channels. The "Aligned" option only detects patterns that align with the trend and conversely, the "Opposite" option detects patterns that go against the trend.
🔹 Trend Indicator Settings
Moving Average Cloud: Allows traders to choose the type of moving averages (SMA, EMA, HMA, etc.) and set the lengths for fast and slow-moving averages.
Supertrend: Options to set the ATR length and factor for Supertrend.
Donchian Channels: Option to set the length for the channel calculation.
🔶 RELATED SCRIPTS
Reversal-Candlestick-Structure .
Reversal-Signals .

Fear/Greed Zone Reversals [UAlgo]The "Fear/Greed Zone Reversals " indicator is a custom technical analysis tool designed for TradingView, aimed at identifying potential reversal points in the market based on sentiment zones characterized by fear and greed. This indicator utilizes a combination of moving averages, standard deviations, and price action to detect when the market transitions from extreme fear to greed or vice versa. By identifying these critical turning points, traders can gain insights into potential buy or sell opportunities.
🔶 Key Features
Customizable Moving Averages: The indicator allows users to select from various types of moving averages (SMA, EMA, WMA, VWMA, HMA) for both fear and greed zone calculations, enabling flexible adaptation to different trading strategies.
Fear Zone Settings:
Fear Source: Select the price data point (e.g., close, high, low) used for Fear Zone calculations.
Fear Period: This defines the lookback window for calculating the Fear Zone deviation.
Fear Stdev Period: This sets the period used to calculate the standard deviation of the Fear Zone deviation.
Greed Zone Settings:
Greed Source: Select the price data point (e.g., close, high, low) used for Greed Zone calculations.
Greed Period: This defines the lookback window for calculating the Greed Zone deviation.
Greed Stdev Period: This sets the period used to calculate the standard deviation of the Greed Zone deviation.
Alert Conditions: Integrated alert conditions notify traders in real-time when a reversal in the fear or greed zone is detected, allowing for timely decision-making.
🔶 Interpreting Indicator
Greed Zone: A Greed Zone is highlighted when the price deviates significantly above the chosen moving average. This suggests market sentiment might be leaning towards greed, potentially indicating a selling opportunity.
Fear Zone Reversal: A Fear Zone is highlighted when the price deviates significantly below the chosen moving average of the selected price source. This suggests market sentiment might be leaning towards fear, potentially indicating a buying opportunity. When the indicator identifies a reversal from a fear zone, it suggests that the market is transitioning from a period of intense selling pressure to a more neutral or potentially bullish state. This is typically indicated by an upward arrow (▲) on the chart, signaling a potential buy opportunity. The fear zone is characterized by high price volatility and overselling, making it a crucial point for traders to consider entering the market.
Greed Zone Reversal: Conversely, a Greed Zone is highlighted when the price deviates significantly above the chosen moving average. This suggests market sentiment might be leaning towards greed, potentially indicating a selling opportunity. When the indicator detects a reversal from a greed zone, it indicates that the market may be moving from an overbought condition back to a more neutral or bearish state. This is marked by a downward arrow (▼) on the chart, suggesting a potential sell opportunity. The greed zone is often associated with overconfidence and high buying activity, which can precede a market correction.
🔶 Why offer multiple moving average types?
By providing various moving average types (SMA, EMA, WMA, VWMA, HMA) , the indicator offers greater flexibility for traders to tailor the indicator to their specific trading strategies and market preferences. Different moving averages react differently to price data and can produce varying signals.
SMA (Simple Moving Average): Provides an equal weighting to all data points within the specified period.
EMA (Exponential Moving Average): Gives more weight to recent data points, making it more responsive to price changes.
WMA (Weighted Moving Average): Allows for custom weighting of data points, providing more flexibility in the calculation.
VWMA (Volume Weighted Moving Average): Considers both price and volume data, giving more weight to periods with higher trading volume.
HMA (Hull Moving Average): A combination of weighted moving averages designed to reduce lag and provide a smoother curve.
Offering multiple options allows traders to:
Experiment: Traders can try different moving averages to see which one produces the most accurate signals for their specific market.
Adapt to different market conditions: Different market conditions may require different moving average types. For example, a fast-moving market might benefit from a faster moving average like an EMA, while a slower-moving market might be better suited to a slower moving average like an SMA.
Personalize: Traders can choose the moving average that best aligns with their personal trading style and risk tolerance.
In essence, providing a variety of moving average types empowers traders to create a more personalized and effective trading experience.
🔶 Disclaimer
Use with Caution: This indicator is provided for educational and informational purposes only and should not be considered as financial advice. Users should exercise caution and perform their own analysis before making trading decisions based on the indicator's signals.
Not Financial Advice: The information provided by this indicator does not constitute financial advice, and the creator (UAlgo) shall not be held responsible for any trading losses incurred as a result of using this indicator.
Backtesting Recommended: Traders are encouraged to backtest the indicator thoroughly on historical data before using it in live trading to assess its performance and suitability for their trading strategies.
Risk Management: Trading involves inherent risks, and users should implement proper risk management strategies, including but not limited to stop-loss orders and position sizing, to mitigate potential losses.
No Guarantees: The accuracy and reliability of the indicator's signals cannot be guaranteed, as they are based on historical price data and past performance may not be indicative of future results.

4 Bar Momentum Reversal strategy█ STRATEGY DESCRIPTION
The "4 Bar Momentum Reversal Strategy" is a mean-reversion strategy designed to identify price reversals following a sustained downward move. It enters a long position when a reversal condition is met and exits when the price shows strength by exceeding the previous bar's high. This strategy is optimized for indices and stocks on the daily timeframe.
█ WHAT IS THE REFERENCE CLOSE?
The Reference Close is the closing price from X bars ago, where X is determined by the Lookback period. Think of it as a moving benchmark that helps the strategy assess whether prices are trending upwards or downwards relative to past performance. For example, if the Lookback is set to 4, the Reference Close is the closing price 4 bars ago (`close `).
█ SIGNAL GENERATION
1. LONG ENTRY
A Buy Signal is triggered when:
The close price has been lower than the Reference Close for at least `Buy Threshold` consecutive bars. This indicates a sustained downward move, suggesting a potential reversal.
The signal occurs within the specified time window (between `Start Time` and `End Time`).
2. EXIT CONDITION
A Sell Signal is generated when the current closing price exceeds the high of the previous bar (`close > high `). This indicates that the price has shown strength, potentially confirming the reversal and prompting the strategy to exit the position.
█ ADDITIONAL SETTINGS
Buy Threshold: The number of consecutive bearish bars needed to trigger a Buy Signal. Default is 4.
Lookback: The number of bars ago used to calculate the Reference Close. Default is 4.
Start Time and End Time: The time window during which the strategy is allowed to execute trades.
█ PERFORMANCE OVERVIEW
This strategy is designed for trending markets with frequent reversals.
It performs best in volatile conditions where price movements are significant.
Backtesting results should be analysed to optimize the Buy Threshold and Lookback parameters for specific instruments.

The Bar Counter Trend Reversal Strategy [TradeDots]Overview
The Bar Counter Trend Reversal Strategy is designed to identify potential counter-trend reversal points in the market after a series of consecutive rising or falling bars.
By analyzing price movements in conjunction with optional volume confirmation and channel bands (Bollinger Bands or Keltner Channels), this strategy aims to detect overbought or oversold conditions where a trend reversal may occur.
🔹How it Works
Consecutive Price Movements
Rising Bars: The strategy detects when there are a specified number of consecutive rising bars (No. of Rises).
Falling Bars: Similarly, it identifies a specified number of consecutive falling bars (No. of Falls).
Volume Confirmation (Optional)
When enabled, the strategy checks for increasing volume during the consecutive price movements, adding an extra layer of confirmation to the potential reversal signal.
Channel Confirmation (Optional)
Channel Type: Choose between Bollinger Bands ("BB") or Keltner Channels ("KC").
Channel Interaction: The strategy checks if the price interacts with the upper or lower channel lines: For short signals, it looks for price moving above the upper channel line. For long signals, it looks for price moving below the lower channel line.
Customization:
No. of Rises/Falls: Set the number of consecutive bars required to trigger a signal.
Volume Confirmation: Enable or disable volume as a confirmation factor.
Channel Confirmation: Enable or disable channel bands as a confirmation factor.
Channel Settings: Adjust the length and multiplier for the Bollinger Bands or Keltner Channels.
Visual Indicators:
Entry Signals: Triangles plotted on the chart indicate potential entry points:
Green upward triangle for long entries.
Red downward triangle for short entries.
Channel Bands: The upper and lower bands are plotted for visual reference.
Strategy Parameters:
Initial Capital: $10,000.
Position Sizing: 80% of equity per trade.
Commission: 0.01% per trade to simulate realistic trading costs.
🔹Usage
Set up the number of Rises/Falls and choose whether if you want to use channel indicators and volume as the confirmation.
Monitor the chart for triangles indicating potential entry points.
Consider the context of the overall market trend and other technical factors.
Backtesting and Optimization:
Use TradingView's Strategy Tester to evaluate performance.
Adjust parameters to optimize results for different market conditions.
🔹 Considerations and Recommendations
Risk Management:
The strategy does not include built-in stop-loss or take-profit levels. It's recommended to implement your own risk management techniques.
Market Conditions:
Performance may vary in different market environments. Testing and adjustments are advised when applying the strategy to new instruments or timeframes.
No Guarantee of Future Results:
Past performance is not indicative of future results. Always perform due diligence and consider the risks involved in trading.

Island Reversal [LuxAlgo]The Island Reversal tool allows traders to identify reversal patterns directly on the chart. These patterns signal a potential change in trend, either from bullish to bearish or vice versa.
The tool enables traders to filter these patterns by trend, volume, and range, making it easy to display pure or less constrained island reversals.
🔶 USAGE
An island reversal pattern may indicate a change in trend. It occurs when prices change direction from an uptrend to a downtrend, or vice versa.
This pattern is a great tool for timing the market. Traders should be aware of when these patterns develop and watch how prices behave after the pattern forms.
Now, let's take a closer look at one of these island reversal patterns to highlight its different components.
The different parts are depicted in the image above.
1. A trend prior to the pattern
2. A gap starts the pattern.
3. A range of prices
4. A final gap, opposite to the first one, closes the pattern.
5. In this case, the pattern leads to a bearish trend, which is opposite to the trend in the first step.
🔹 Trend, Volume and Range Filters
Enabling the trend filter causes the tool to only detect top island reversals during a bullish trend and bottom island reversals during a bearish trend.
Traders can adjust the size of the detected trend in the settings panel. The larger the trend size, the more relevant the reversal patterns can be.
The volume filter only detects reversal patterns if there is more volume within the range of the pattern than in the preceding trend.
The idea is that more people tend to participate at the top and bottom of a trend as it changes direction.
The tool has two range filters that discriminate the range within the island reversal pattern:
Horizontality Filter (R2): Based on the R-squared statistic from linear regression, it detects whether the price is moving sideways within the range.
Volatility Filter: Based on long-term volatility, it detects the size of the range within the pattern.
The smaller the value in the Horizontality Filter, the more horizontal the prices will be within the range. A larger value will detect more reversal patterns.
The larger the value in the Volatility Filter, the larger the ranges will be. A smaller value will detect fewer reversal patterns.
🔶 SETTINGS
🔹 Trend Filter
Trend Filter: Enable or disable the trend filter.
Trend Length: Select the size of the detected trend.
🔹 Volume Filter
Volume Filter: Enable or disable the volume filter.
🔹 Range Filter
Horizontality Filter (R2): Enable or disable the Horizontality filter and select a threshold value.
Volatility Filter: Enable or disable the Volatility filter and select the multiplier value.
🔹 Style
Bullish: Select a color for bullish sessions.
Bearish: Select a color for bearish sessions.
Transparency: Select a transparency level from 100 to 0.

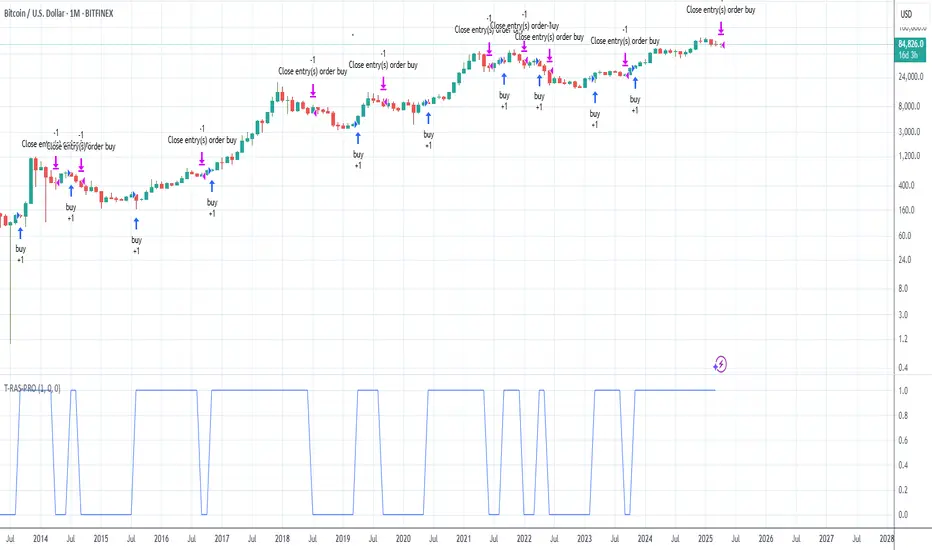
Trend Reversal Alerts Strategy [4H/3M]This is advanced version of T-R.A.S with better logic adapted for 4hour / 3month timeframes
Volume-Confirmed Reversal Engine [AlgoPoint]Volume-Confirmed Reversal Engine v2.0
Overview
A price pattern alone is not enough to signal a high-probability reversal. True market turning points—moments of capitulation or euphoria—are almost always confirmed by a significant spike in volume.
The Volume-Confirmed Reversal Engine is designed to identify these exact moments. It filters out low-conviction price movements and focuses only on reversal patterns that are backed by meaningful volume activity.
How It Works
The indicator's logic is based on a sequential confirmation process:
- High-Volume Anchor Candle: The engine first scans for an "Anchor Candle"—a candle that makes a new high or low over a user-defined look_back period. Critically, this candle's volume must also be significantly higher than the recent average. Low-volume breakouts are ignored.
- Setup Activation & Visualization: When a valid Anchor Candle is detected, the indicator enters a "setup" phase. It visually marks this on your chart by drawing a Setup Box around the high and low of the Anchor Candle, extending it forward for the duration of the confirm_in window.
- Confirmation & Signal: A final signal is only triggered if the price breaks out of the opposite side of the Setup Box within the confirmation window. This action, combined with the initial volume spike, confirms the reversal.
- Setup Box Visualization: See exactly which candle the indicator is watching and the key price levels (the box boundaries) that need to be broken for a signal.
Signal Strength Score (1-4): Every signal now comes with a score, providing insight into its quality based on four factors:
- The base price pattern is met.
- The initial Anchor Candle had high volume.
- The final Confirmation Candle also had high volume.
- The signal is aligned with the long-term macro trend (e.g., a BUY signal above the 200 EMA).
Status Dashboard: A simple panel on your chart tells you what the indicator is doing in real-time ("Scanning for Setups," "Watching Bullish Setup," etc.) and displays a countdown for how many bars are left for a confirmation.
How to Interpret & Use
- The Box: When a colored box appears, it's an early warning that a reversal setup is active. Watch the boundaries of the box for a potential breakout.
- The Score: Use the score to gauge the quality of a signal. A 3/4 or 4/4 score represents a very high-conviction setup where multiple technical factors are aligned.
- The Dashboard: Use the panel to understand the indicator's current state and the time-sensitivity of an active setup.
- The BUY/SELL Labels: These are the final, actionable triggers, appearing only after the full price and volume confirmation process is complete.

Reversal & Breakout Strategy with ORB### Reversal & Breakout Strategy with ORB
This strategy combines three distinct trading approaches—reversals, trend breakouts, and opening range breakouts (ORB)—into a single, cohesive system. The goal is to capture high-probability setups across different market conditions, leveraging a mashup of technical indicators for confirmation and risk management. Below, I’ll explain why this combination works, how the components interact, and how to use it effectively.
#### Why the Mashup?
- **Reversals**: Identifies overextended moves using RSI (overbought/oversold) and SMA50 crosses, filtered by VWAP and SMA200 trend direction. This targets mean-reversion opportunities in trending markets.
- **Breakouts**: Uses EMA9/EMA20 crossovers with VWAP and SMA200 confirmation to catch momentum-driven trend continuations.
- **Opening Range Breakout (ORB)**: Detects early momentum by breaking the high/low of a user-defined opening range (default: 15 bars) with volume confirmation. This adds a time-based edge, ideal for intraday trading.
The synergy comes from blending these methods: reversals catch pullbacks, breakouts ride trends, and ORB exploits early volatility—all filtered by trend (SMA200) and anchored by VWAP for context.
#### How It Works
1. **Indicators**:
- **EMA9/EMA20**: Fast-moving averages for breakout signals.
- **SMA50**: Medium-term trend filter for reversals.
- **SMA200**: Long-term trend direction to align trades.
- **RSI (14)**: Measures overbought (>70) or oversold (<30) conditions.
- **VWAP**: Acts as a dynamic support/resistance level.
- **ATR (14)**: Sets stop-loss distance (default: 1.5x ATR).
- **Volume**: Confirms ORB breakouts (1.5x average volume of opening range).
2. **Entry Conditions**:
- **Long**: Triggers on reversal (SMA50 cross + RSI < 30 + below VWAP + uptrend), breakout (EMA9 > EMA20 + above VWAP + uptrend), or ORB (break above opening range high + volume).
- **Short**: Triggers on reversal (SMA50 cross + RSI > 70 + above VWAP + downtrend), breakout (EMA9 < EMA20 + below VWAP + downtrend), or ORB (break below opening range low + volume).
3. **Risk Management**:
- Risks 5% of equity per trade (based on the initial capital set in the strategy tester).
- Stop-loss: Based on lowest low/highest high over 7 bars ± 1.5x ATR.
- Targets: Two exits at 1:1 and 1:2 risk:reward (50% of position at each).
- Break-even: Stop moves to entry price after the first target is hit.
4. **Backtesting Settings**:
- Commission: Hardcoded at 0.1% per trade (realistic for most brokers).
- Slippage: Hardcoded at 2 ticks (realistic for most markets).
- Tested on datasets yielding 100+ trades (e.g., 2-min or 5-min charts over months).
#### How to Use It
- **Timeframe**: Works best on intraday (2-min, 5-min) or daily charts. Adjust `Opening Range Bars` (e.g., 15 bars = 30 min on 2-min chart) for your timeframe.
- **Settings**:
- Set your initial equity in the TradingView strategy tester’s "Properties" tab under "Initial Capital" (e.g., $10,000). The script automatically risks 5% of this equity per trade.
- Adjust `Stop Loss ATR Multiplier` or `Risk:Reward Targets` based on your risk tolerance.
- Note that commission (0.1%) and slippage (2 ticks) are fixed in the script for backtesting consistency.
- **Execution**: Enter on signal, monitor plotted stop (red) and targets (green/blue). The strategy supports pyramiding (up to 2 positions) for scaling into trends.
#### Backtesting Notes
Results are realistic with commission (0.1%) and slippage (2 ticks) included. For a sufficient sample, test on volatile instruments (e.g., stocks, forex) over 3-6 months on lower timeframes. The default 1.5x ATR stop may seem wide, but it’s justified to avoid premature exits in volatile markets—feel free to tweak it with justification. The script assumes an initial capital of $10,000 in the strategy tester for the 5% risk calculation (e.g., $500 risk per trade); adjust this in the "Properties" tab as needed.
This mashup isn’t just a random mix; it’s a deliberate fusion of complementary strategies, offering traders flexibility across market phases. Questions? Let me know!

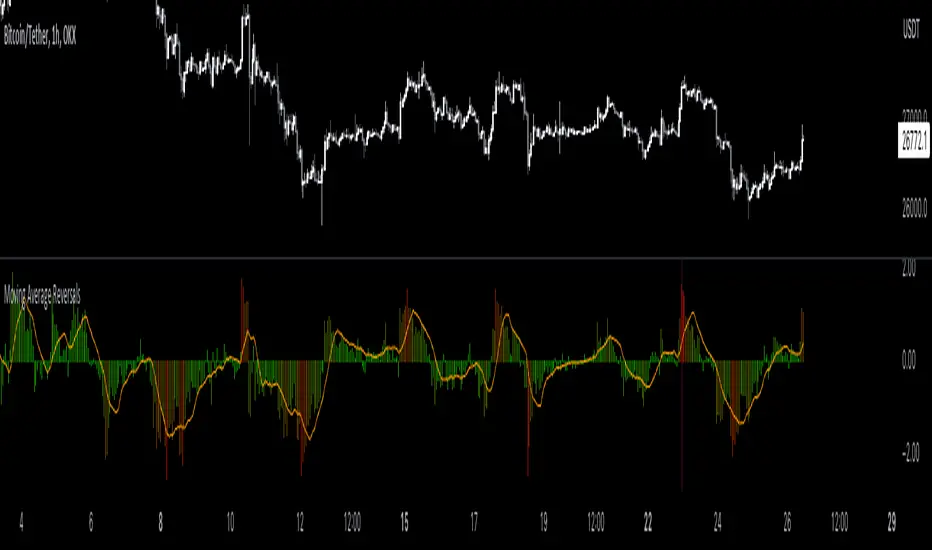
Moving Average Reversals [QuantVue]Moving Average Reversals
Description:
The Moving Average Reversals indicator gives a quick visual representation of when a stock gets extended up or down from a user selected moving average.
The color of the histogram dynamically changes as price becomes extended or within it’s normal trading range.
The indicator also highlights the largest extensions over the past year or 252 bars if using intraday.
Lastly a simple moving average of the extensions is calculated and used to confirm a change of character.
Settings:
🔹Use different MA types - EMA, SMA, HMA, WMA, VWMA
🔹Adjustable MA length
🔹Change distance measurement source - open, close, high, low, hl2, hlc3, ohlc4, hlcc4
🔹Extension highlighting
🔹Toggle MA extensions
Don't hesitate to reach out with any questions or concerns. We hope you enjoy!
Cheers.