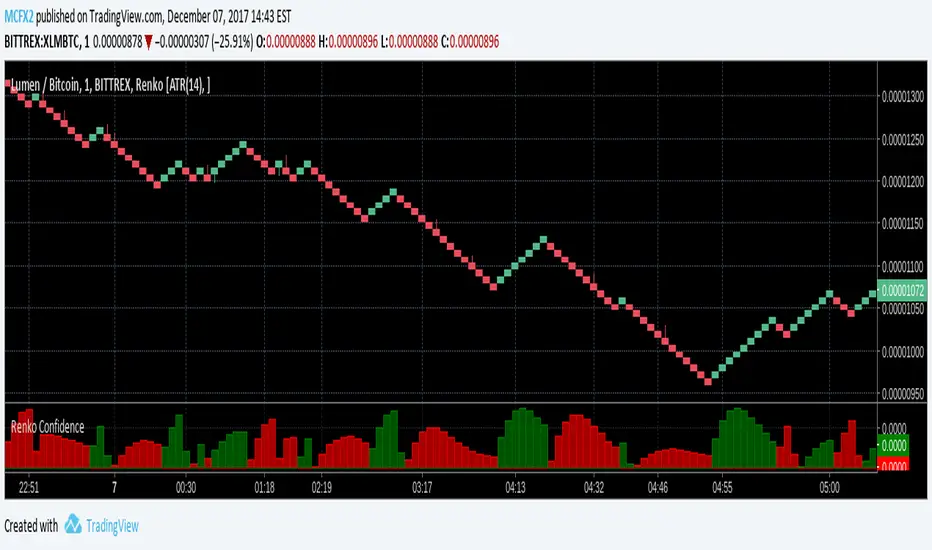
Renko ConfidenceProbably my simplest tool yet. Meant for use with Renko charts.
The height of the bar tells you how confident the indicator is a trend will continue, and the color gives the direction.
If the bar is small, or a different color than its corresponding renko bar, that is a sign of very low confidence. If confidence is high, you can use that to enter a trade earlier than the usual renko strategy would have you enter, as well as exit earlier.
ค้นหาในสคริปต์สำหรับ "renko"
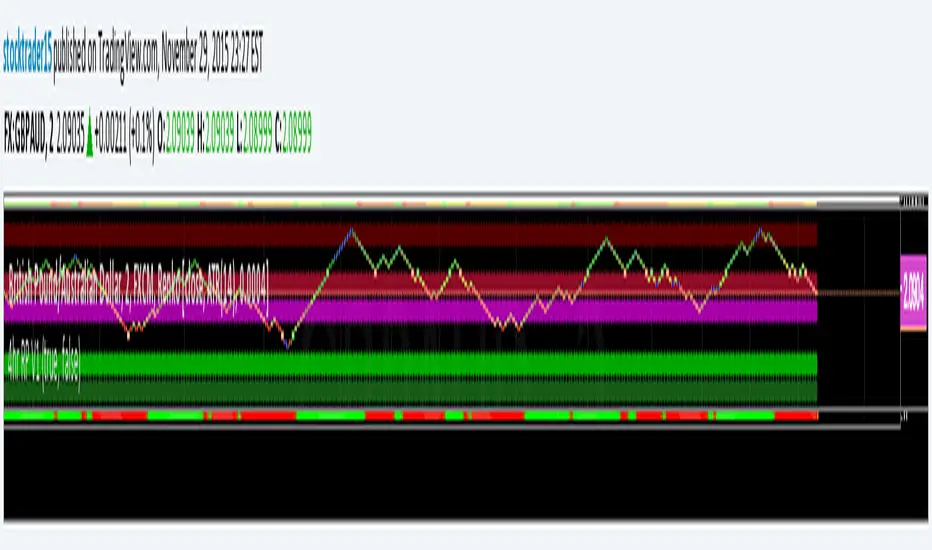
Renko EMA SystemMeant for Renko charts
Applies either an EMA and HMA to your renko charts
When prices crosses the slower, it enters you into position.
When price crosses the faster, it exits your position.
Meant to catch impulsive moves.

Renko AlertsAV alerts indicator to accompany our private Renko trading strategy. Uses custom Renko code (no security() calls) to eliminate repainting and signal erasure.

Renko Coded Candles [PUBLIC]Very simple free indicator. Colors the candlesticks based off of the Renko color for the given timeframe. Useful for those who like to use renko strategies in addition to candlestick-based strategies, so they dont have to switch charts as often.

Renko Entry Alerts Limit +0.08Simple renko 1 block reversal strategy Adds +0.08 to 1 block during pre a=market and after hours for more successful fills.

Renko WPR Color ChangerChanges color when williams percent R is between 0 and -20 or when between -80 and -100. Works with renko, HA and regular candles. Can change color.

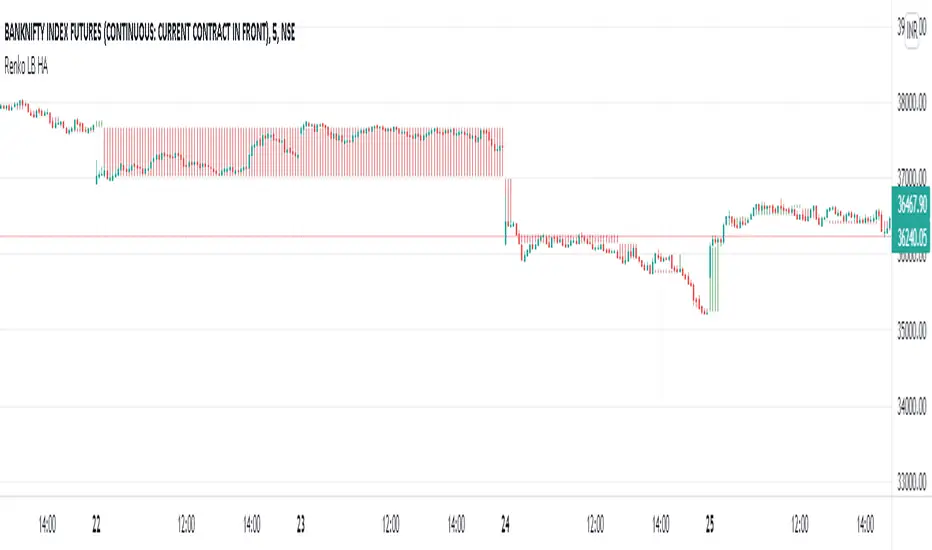
Renko LineBreak HeikinAshi background & MTFWe can have all the 3 types of candle plots (bar styles) over normal candles in the same chart.
We will have better picture on whats happening in specific chart candle type / bar style.
Option provided to turn off/on specific bar type.
Multi time frame is enabled.
Specific time frame can be chosen for individual bar style.
Renko XZThis is a renko based indicator
I just made it no repaint type. also the signals are based on max and min trend of the high ad low
alerts are included
you can control it by ATR size or better by multiplayer similar to super trend by logic
HTF control brick size but they are not important design by non security MTF


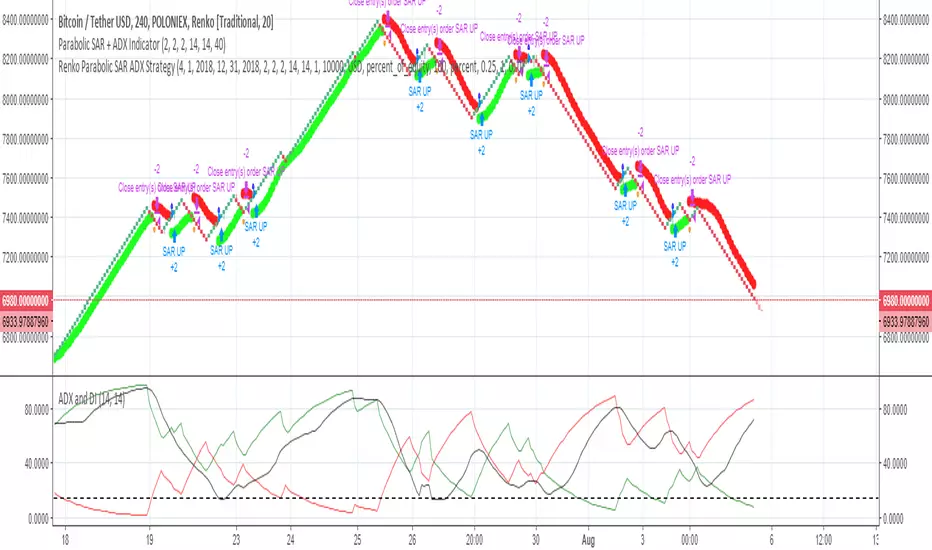
Renko Parabolic SAR + ADX Indicator (Need help on the alert)//This script is made using scripts by other authors. All credit goes to them. I am only copying snippets and making it work for me//
Problem Statement:
The script seems to work best using a fixed renko brick. The indicators do work but I have problems with the alert.
What often happens is, the signal appears (condition is met) BRIEFLY as the bar forms, it disappears a few seconds later, but the alert is still sent on the close of the bar.
I wish to receive these alerts on the close of a bar only if the condition is still met on the close of the bar
I am hoping someone can guide or fix the alertcondition such that it checks for the firmed signal before triggering the alert.
POLONIEX:BTCUSDT
[RENKO] [MAGIC] SLOW & FAST /w ALEART !!!!!!!!!! TEST previously created by vacalo69 !!!!!!!
NO LAG and NO REPAINT
On Renko chart with alert which works on Autoview
In backtest result $ value is equivalent to BTC
i have set the value as it shows in BTC with commission of 0.075%
This chart is BITMEX:LTCU18

Renko with custom sourceThe script allows you to set custom date source for Renko chart through Format dialog.

MM CHEATCODE V2The Best Renko system out there. The second coming to the original Cheatcode Algo we made
with options to use Tradition point calculations or ATR values for price measurement
- Select up to 3 tp levels
- ATR Risk calculator
- Strategy presets for easy setting selection for certain assets
- A trailing Ma for stint entries filters
- Volatility bands (BB, Kentler,Donchain)
- ATR super trend for added trend & trade filter
- MTF filter (up to 3)
- Added Session display as well as strict filter to only trade during that session(s) selected
- Full signal Alerts (meaning the full signal will send Entry, TP, Sl )
- added MM Capo volatility filter
Also Have Automation Version Available
How to use
You can use a setting preset in for the asset selected and the settings will automatically adjust but won't apply to your setting screen. (Tradingview limitations)
For the most part the buy signal will plot when the ATR moves in up/down direction
Filter your trades with the various trend detections indicators added when they all line up you have the best probability for the trade.
Renko is the best way to trade basic market structure and now with all the confirmation you need.
ALL Links below or PM us for access to this indicator Happy Trading

KTS 0.1a [BETA]VERY early release of KTS for those who have contributed to the early efforts of the upcoming Kawaii Trading Suite package.
When you first add this to a chart- nothing will happen. You need to enable the features you want in the indicator's settings menu. Many of these are based off of indicators i've already published (and are linked for in-depth description). The following features available:
Daily Support/Resistance levels
Hourly Support/Resistance levels
General Support/Resistance levels
The three above use the same algorithm but are designed for different timeframes.
Renko Bar Overlay (overlays a Renko chart on any timeframe you want)
Renko Signal Overlay (for those who want to know when renkos go green/red without the giant overlay)
The two above indicators use 1D renkos by default (since that's the shortest TV lets free accounts use) but you can use any timeframe you wish in settings.
Alt Sentiment Signal overlay (Simple up/down arrow when altcoin sentiment changes)
Witchcraft support/resistance clouds (can be toggled individually)
Planned but not-yet-finished features include:
Ichimokou Clouds
Golden Cross signal
Plus many more things I haven't posted anywhere else yet. Be aware that beyond this point, anyone wishing to try this product will have to pay a reasonable fee. Please do not message me asking for access to private indicators if you have no intention of paying for them.

The Quantum Leap: Renko + ML(Note: This indicator uses the BackQuant & SuperTrend which takes a 4-5 seconds to load)
This strategy uses the following indicators (please see source code)
Synthetic Renko: Ignores time and focuses purely on price movement to detect clear trend reversals (Red-to-Green).
ATR (Average True Range): Measures volatility to calculate the Renko brick sizes and SuperTrend sensitivity.
Adaptive SuperTrend: A trend filter that uses volatility clustering to confirm if the market is currently in a "Bearish" state.
RSI (Relative Strength Index): A momentum gauge ensuring the asset is "Oversold" (exhausted) before we consider a setup.
Monthly Pivots: Horizontal support lines based on last month's data acting as price "floors" (S1, S2, S3).
SMA (Simple Moving Average): A 100-bar average ensuring we are strictly buying below the long-term mean (deep value).
BackQuant (KNN): A Machine Learning engine that compares current data to historical patterns to predict immediate momentum.
This is a sophisticated, multi-stage strategy script. It combines "Old School" price action (Renko) with "New School" Machine Learning (KNN and Clustering).
Here is the high-level summary of how we will break this down:
Topic 1: The "Bottom Hunter" Setup. How the script uses Renko bricks and aggressive filtering (SuperTrend, SMA, RSI, Pivots) to find a potential market bottom.
Topic 2: The ML Engine (BackQuant & SuperTrend). How the script uses K-Nearest Neighbors (KNN) to predict momentum and Volatility Clustering to adjust the SuperTrend.
Topic 3: The "Leap" Execution. How the script synchronizes the Setup (Topic 1) with the ML Trigger (Topic 2) using a time window.
Topic 1: The "Bottom Hunter" Setup
This script is designed as a Mean Reversion strategy (often called "catching a falling knife" or "bottom fishing"). It is trying to find the exact moment a downtrend stops and reverses.
Most strategies buy when price is above the 200 SMA or above the SuperTrend. This script does the exact opposite.
The Logic:
Renko Bricks: It simulates Renko bricks internally (without changing your chart view). It waits for a specific pattern: A Red Brick followed immediately by a Green Brick (a reversal).
The "Bearish" Filters: To generate a "WATCH" signal, the following must be true:
Price < SuperTrend: The market must officially be in a downtrend.
Price < SMA: Long-term trend is down.
Price < Monthly Pivot: Price is deeply discounted.
RSI < Threshold: The asset is oversold (exhausted).
Recommended Settings for daily signals for Stocks :
Confirmation : 10. (How many bars after Renko Buy signal the AI has to identify a bullish move).
Percentage : 2 (This is the Renko bar size. This represents 2% move.)
SMA: 100 (Signal must be found below 100 SMA)
Price must be below: PIVOT (This is the monthly Pivot levels)

ST15 Renko S/R V1I use this as part of a larger Renko scalping system to help find key S/R usually when placing TPs. I enjoy using it with 2 pip ATR renkos, but I think with a little tweaking it could work with many different trading styles. For 2 or 5 pip atr renkos it is as simple as putting it up on the chart. Hope it helps, thank you!!

Psychlogical TP Levels Indicator V 1This indicator works based on the Average True Range and Renko Charts.
The Renko charts are a perfect way to observe the market trend without noise.
From the image below, you can see that as long as the market is bullish, the Renko chart remains green, and when the market turns from bullish to bearish, the Renko chart also changes its direction. As can be seen in the image below
This indicator allows you to view the clear trend in the market.
Inside the indicator's settings, you can change the ATR Period you want. By default, it is set to 14.
Applying the indicator to charts will plot areas of two colours in a separate window. You have to pay attention to when the indicator changes its colour.
An important thing you need to understand is The psychological indicator is not a buy/sell indicator. It means you’ll not use it for opening a buy/sell trade. You’ll use it for Taking Profit levels only.
Here is how you can use the indicator to decide the take profit levels.
You can open your buy trades with any strategy you use. When you open your trade, you should pay attention to the colour or Psychological Indicator. Now, as the market goes up, you should wait for the indicator to turn from green to red, and when that happens, this will signal to close the trade.
Similarly, for short positions, you can open your sell trades with any strategy you use. When you open your trade, you should pay attention to the colour or Psychological Indicator. Now, as the market goes down, you should wait for the indicator to turn from red to green, and when that happens, this will signal to close the trade. Please check the image below.

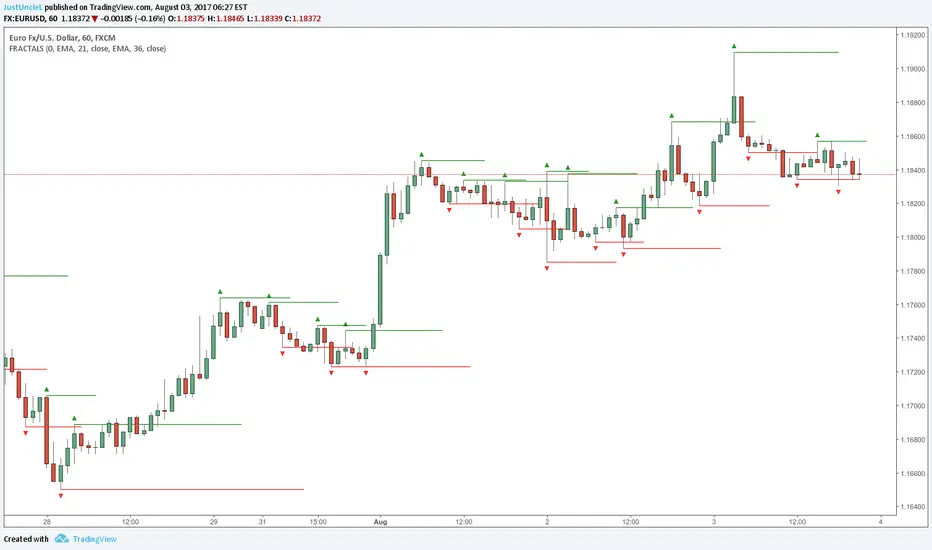
Fractals and Levels by JustUncleLEven though there are a many other Fractal and Level indicators, this indicator has some unique features. The indicator will display Fractals, fractal levels and HH/LL points, they will only be drawn after they have completed. Also the indicator has options to :
Show Ideal Fractals Only.
Use Renko Style Fractals, where open/close values are used instead of high/low to find Fractals. This is used to show the correct Fractals when Renko Wicks are enabled.
Has an optional Filter to only display Fractals that are above/below a MA Ribbon.
References:
This code is based on Fractal Levels V8 by RicardoSantos
This is a Renko Chart with "Renko Style Fractals" enabled, notice that the wicks are ignored and only the true Bricks are used for Fractals:
ST15 CM inspired 4hr renko Pivots
Standard pivot points do not work with ATR Renko charts, but I really enjoy using pivot points to find strong s/r, so I started to look at scripts that could provide the same results as floor trader pivots but on a renko chart. I found a script written by CM that I was able to tweak a little and I got it work with ATR renkos. The only issue now is he only wrote the script to look for 1hr pivot points so I am now in the process off writing versions that can do the 240 1d 1w and 1m pivot points as well. Here is the 4hr :) enjoy! Thank you CM :)
Brick IndicatorBrick Indicator :-
A wonderful book written by "Prashant Shah" named "The profitable trading with renko chart" has been mentioned many technical indicator in this book. But today we are going to tell about an indicator who does a lot of amazing work inside the Renko chart. The Indicator name is "Brick Indicator" works on very simple calculations. Inside it, it is seen how much Brick Bullish was and how Brick was Bearish. Which shows whether the trend is upwards or downwards. At the same time, inside it we use the line of EMA. So that we can catch the trend quickly.
Brick Line Formula: - Numbers of periods bullish candles - Numbers of periods bearish candles
With this line, we put the line of EMA, so that the signals of the market get even better.

MATRIX Rises on the wavesJust one more go at a zigzag , this time with the aid of renko emulator.
Apenas mais uma vez em zigue-zague, desta vez com a ajuda do emulador renko.
Surfe nas ondas do MATRIX

Alex: ConsUD Alert indicatorCustom strategy that was developed for a Backtest-Rookies development service customer. Published for verification, testing and acceptance.
If you are interested in development services send me a message or visit the backtest-rookies (.com) webiste for more information
Consecutive Up/Down Days - Custom Indicator
The indicator builds upon the built-in consecutive up/down days strategy script but with some additional features:
The strategy has been converted to an indicator
Alerts have been added for entries
Position Simulation: Entry signals only happen once per long / short direction.
Plot real high / low candle data (the script is assumed to run on Renko candles)
Plot real simulated entry price at the open of the bar following an entry signal
Plot an EMA
