Webhook Starter Kit [HullBuster]
Introduction
This is an open source strategy which provides a framework for webhook enabled projects. It is designed to work out-of-the-box on any instrument triggering on an intraday bar interval. This is a full featured script with an emphasis on actual trading at a brokerage through the TradingView alert mechanism and without requiring browser plugins.
The source code is written in a self documenting style with clearly defined sections. The sections “communicate” with each other through state variables making it easy for the strategy to evolve and improve. This is an excellent place for Pine Language beginners to start their strategy building journey. The script exhibits many Pine Language features which will certainly ad power to your script building abilities.
This script employs a basic trend follow strategy utilizing a forward pyramiding technique. Trend detection is implemented through the use of two higher time frame series. The market entry setup is a Simple Moving Average crossover. Positions exit by passing through conditional take profit logic. The script creates ten indicators including a Zscore oscillator to measure support and resistance levels. The indicator parameters are exposed through 47 strategy inputs segregated into seven sections. All of the inputs are equipped with detailed tool tips to help you get started.
To improve the transition from simulation to execution, strategy.entry and strategy.exit calls show enhanced message text with embedded keywords that are combined with the TradingView placeholders at alert time. Thereby, enabling a single JSON message to generate multiple execution events. This is genius stuff from the Pine Language development team. Really excellent work!
This document provides a sample alert message that can be applied to this script with relatively little modification. Without altering the code, the strategy inputs can alter the behavior to generate thousands of orders or simply a few dozen. It can be applied to crypto, stocks or forex instruments. A good way to look at this script is as a webhook lab that can aid in the development of your own endpoint processor, impress your co-workers and have hours of fun.
By no means is a webhook required or even necessary to benefit from this script. The setups, exits, trend detection, pyramids and DCA algorithms can be easily replaced with more sophisticated versions. The modular design of the script logic allows you to incrementally learn and advance this script into a functional trading system that you can be proud of.
Design
This is a trend following strategy that enters long above the trend line and short below. There are five trend lines that are visible by default but can be turned off in Section 7. Identified, in frequency order, as follows:
1. - EMA in the chart time frame. Intended to track price pressure. Configured in Section 3.
2. - ALMA in the higher time frame specified in Section 2 Signal Line Period.
3. - Linear Regression in the higher time frame specified in Section 2 Signal Line Period.
4. - Linear Regression in the higher time frame specified in Section 2 Signal Line Period.
5. - DEMA in the higher time frame specified in Section 2 Trend Line Period.
The Blue, Green and Orange lines are signal lines are on the same time frame. The time frame selected should be at least five times greater than the chart time frame. The Purple line represents the trend line for which prices above the line suggest a rising market and prices below a falling market. The time frame selected for the trend should be at least five times greater than the signal lines.
Three oscillators are created as follows:
1. Stochastic - In the chart time frame. Used to enter forward pyramids.
2. Stochastic - In the Trend period. Used to detect exit conditions.
3. Zscore - In the Signal period. Used to detect exit conditions.
The Stochastics are configured identically other than the time frame. The period is set in Section 2.
Two Simple Moving Averages provide the trade entry conditions in the form of a crossover. Crossing up is a long entry and down is a short. This is in fact the same setup you get when you select a basic strategy from the Pine editor. The crossovers are configured in Section 3. You can see where the crosses are occurring by enabling Show Entry Regions in Section 7.
The script has the capacity for pyramids and DCA. Forward pyramids are enabled by setting the Pyramid properties tab with a non zero value. In this case add on trades will enter the market on dips above the position open price. This process will continue until the trade exits. Downward pyramids are available in Crypto and Range mode only. In this case add on trades are placed below the entry price in the drawdown space until the stop is hit. To enable downward pyramids set the Pyramid Minimum Span In Section 1 to a non zero value.
This implementation of Dollar Cost Averaging (DCA) triggers off consecutive losses. Each loss in a run increments a sequence number. The position size is increased as a multiple of this sequence. When the position eventually closes at a profit the sequence is reset. DCA is enabled by setting the Maximum DCA Increments In Section 1 to a non zero value.
It should be noted that the pyramid and DCA features are implemented using a rudimentary design and as such do not perform with the precision of my invite only scripts. They are intended as a feature to stress test your webhook endpoint. As is, you will need to buttress the logic for it to be part of an automated trading system. It is for this reason that I did not apply a Martingale algorithm to this pyramid implementation. But, hey, it’s an open source script so there is plenty of room for learning and your own experimentation.
How does it work
The overall behavior of the script is governed by the Trading Mode selection in Section 1. It is the very first input so you should think about what behavior you intend for this strategy at the onset of the configuration. As previously discussed, this script is designed to be a trend follower. The trend being defined as where the purple line is predominately heading. In BiDir mode, SMA crossovers above the purple line will open long positions and crosses below the line will open short. If pyramiding is enabled add on trades will accumulate on dips above the entry price. The value applied to the Minimum Profit input in Section 1 establishes the threshold for a profitable exit. This is not a hard number exit. The conditional exit logic must be satisfied in order to permit the trade to close. This is where the effort put into the indicator calibration is realized. There are four ways the trade can exit at a profit:
1. Natural exit. When the blue line crosses the green line the trade will close. For a long position the blue line must cross under the green line (downward). For a short the blue must cross over the green (upward).
2. Alma / Linear Regression event. The distance the blue line is from the green and the relative speed the cross is experiencing determines this event. The activation thresholds are set in Section 6 and relies on the period and length set in Section 2. A long position will exit on an upward thrust which exceeds the activation threshold. A short will exit on a downward thrust.
3. Exponential event. The distance the yellow line is from the blue and the relative speed the cross is experiencing determines this event. The activation thresholds are set in Section 3 and relies on the period and length set in the same section.
4. Stochastic event. The purple line stochastic is used to measure overbought and over sold levels with regard to position exits. Signal line positions combined with a reading over 80 signals a long profit exit. Similarly, readings below 20 signal a short profit exit.
Another, optional, way to exit a position is by Bale Out. You can enable this feature in Section 1. This is a handy way to reduce the risk when carrying a large pyramid stack. Instead of waiting for the entire position to recover we exit early (bale out) as soon as the profit value has doubled.
There are lots of ways to implement a bale out but the method I used here provides a succinct example. Feel free to improve on it if you like. To see where the Bale Outs occur, enable Show Bale Outs in Section 7. Red labels are rendered below each exit point on the chart.
There are seven selectable Trading Modes available from the drop down in Section 1:
1. Long - Uses the strategy.risk.allow_entry_in to execute long only trades. You will still see shorts on the chart.
2. Short - Uses the strategy.risk.allow_entry_in to execute short only trades. You will still see long trades on the chart.
3. BiDir - This mode is for margin trading with a stop. If a long position was initiated above the trend line and the price has now fallen below the trend, the position will be reversed after the stop is hit. Forward pyramiding is available in this mode if you set the Pyramiding value in the Properties tab. DCA can also be activated.
4. Flip Flop - This is a bidirectional trading mode that automatically reverses on a trend line crossover. This is distinctively different from BiDir since you will get a reversal even without a stop which is advantageous in non-margin trading.
5. Crypto - This mode is for crypto trading where you are buying the coins outright. In this case you likely want to accumulate coins on a crash. Especially, when all the news outlets are talking about the end of Bitcoin and you see nice deep valleys on the chart. Certainly, under these conditions, the market will be well below the purple line. No margin so you can’t go short. Downward pyramids are enabled for Crypto mode when two conditions are met. First the Pyramiding value in the Properties tab must be non zero. Second the Pyramid Minimum Span in Section 1 must be non zero.
6. Range - This is a counter trend trading mode. Longs are entered below the purple trend line and shorts above. Useful when you want to test your webhook in a market where the trend line is bisecting the signal line series. Remember that this strategy is a trend follower. It’s going to get chopped out in a range bound market. By turning on the Range mode you will at least see profitable trades while stuck in the range. However, when the market eventually picks a direction, this mode will sustain losses. This range trading mode is a rudimentary implementation that will need a lot of improvement if you want to create a reliable switch hitter (trend/range combo).
7. No Trade. Useful when setting up the trend lines and the entry and exit is not important.
Once in the trade, long or short, the script tests the exit condition on every bar. If not a profitable exit then it checks if a pyramid is required. As mentioned earlier, the entry setups are quite primitive. Although they can easily be replaced by more sophisticated algorithms, what I really wanted to show is the diminished role of the position entry in the overall life of the trade. Professional traders spend much more time on the management of the trade beyond the market entry. While your trade entry is important, you can get in almost anywhere and still land a profitable exit.
If DCA is enabled, the size of the position will increase in response to consecutive losses. The number of times the position can increase is limited by the number set in Maximum DCA Increments of Section 1. Once the position breaks the losing streak the trade size will return the default quantity set in the Properties tab. It should be noted that the Initial Capital amount set in the Properties tab does not affect the simulation in the same way as a real account. In reality, running out of money will certainly halt trading. In fact, your account would be frozen long before the last penny was committed to a trade. On the other hand, TradingView will keep running the simulation until the current bar even if your funds have been technically depleted.
Entry and exit use the strategy.entry and strategy.exit calls respectfully. The alert_message parameter has special keywords that the endpoint expects to properly calculate position size and message sequence. The alert message will embed these keywords in the JSON object through the {{strategy.order.alert_message}} placeholder. You should use whatever keywords are expected from the endpoint you intend to webhook in to.
Webhook Integration
The TradingView alerts dialog provides a way to connect your script to an external system which could actually execute your trade. This is a fantastic feature that enables you to separate the data feed and technical analysis from the execution and reporting systems. Using this feature it is possible to create a fully automated trading system entirely on the cloud. Of course, there is some work to get it all going in a reliable fashion. Being a strategy type script place holders such as {{strategy.position_size}} can be embedded in the alert message text. There are more than 10 variables which can write internal script values into the message for delivery to the specified endpoint.
Entry and exit use the strategy.entry and strategy.exit calls respectfully. The alert_message parameter has special keywords that my endpoint expects to properly calculate position size and message sequence. The alert message will embed these keywords in the JSON object through the {{strategy.order.alert_message}} placeholder. You should use whatever keywords are expected from the endpoint you intend to webhook in to.
Here is an excerpt of the fields I use in my webhook signal:
"broker_id": "kraken",
"account_id": "XXX XXXX XXXX XXXX",
"symbol_id": "XMRUSD",
"action": "{{strategy.order.action}}",
"strategy": "{{strategy.order.id}}",
"lots": "{{strategy.order.contracts}}",
"price": "{{strategy.order.price}}",
"comment": "{{strategy.order.alert_message}}",
"timestamp": "{{time}}"
Though TradingView does a great job in dispatching your alert this feature does come with a few idiosyncrasies. Namely, a single transaction call in your script may cause multiple transmissions to the endpoint. If you are using placeholders each message describes part of the transaction sequence. A good example is closing a pyramid stack. Although the script makes a single strategy.close() call, the endpoint actually receives a close message for each pyramid trade. The broker, on the other hand, only requires a single close. The incongruity of this situation is exacerbated by the possibility of messages being received out of sequence. Depending on the type of order designated in the message, a close or a reversal. This could have a disastrous effect on your live account. This broker simulator has no idea what is actually going on at your real account. Its just doing the job of running the simulation and sending out the computed results. If your TradingView simulation falls out of alignment with the actual trading account lots of really bad things could happen. Like your script thinks your are currently long but the account is actually short. Reversals from this point forward will always be wrong with no one the wiser. Human intervention will be required to restore congruence. But how does anyone find out this is occurring? In closed systems engineering this is known as entropy. In practice your webhook logic should be robust enough to detect these conditions. Be generous with the placeholder usage and give the webhook code plenty of information to compare states. Both issuer and receiver. Don’t blindly commit incoming signals without verifying system integrity.
Setup
The following steps provide a very brief set of instructions that will get you started on your first configuration. After you’ve gone through the process a couple of times, you won’t need these anymore. It’s really a simple script after all. I have several example configurations that I used to create the performance charts shown. I can share them with you if you like. Of course, if you’ve modified the code then these steps are probably obsolete.
There are 47 inputs divided into seven sections. For the most part, the configuration process is designed to flow from top to bottom. Handy, tool tips are available on every field to help get you through the initial setup.
Step 1. Input the Base Currency and Order Size in the Properties tab. Set the Pyramiding value to zero.
Step 2. Select the Trading Mode you intend to test with from the drop down in Section 1. I usually select No Trade until I’ve setup all of the trend lines, profit and stop levels.
Step 3. Put in your Minimum Profit and Stop Loss in the first section. This is in pips or currency basis points (chart right side scale). Remember that the profit is taken as a conditional exit not a fixed limit. The actual profit taken will almost always be greater than the amount specified. The stop loss, on the other hand, is indeed a hard number which is executed by the TradingView broker simulator when the threshold is breached.
Step 4. Apply the appropriate value to the Tick Scalar field in Section 1. This value is used to remove the pipette from the price. You can enable the Summary Report in Section 7 to see the TradingView minimum tick size of the current chart.
Step 5. Apply the appropriate Price Normalizer value in Section 1. This value is used to normalize the instrument price for differential calculations. Basically, we want to increase the magnitude to significant digits to make the numbers more meaningful in comparisons. Though I have used many normalization techniques, I have always found this method to provide a simple and lightweight solution for less demanding applications. Most of the time the default value will be sufficient. The Tick Scalar and Price Normalizer value work together within a single calculation so changing either will affect all delta result values.
Step 6. Turn on the trend line plots in Section 7. Then configure Section 2. Try to get the plots to show you what’s really happening not what you want to happen. The most important is the purple trend line. Select an interval and length that seem to identify where prices tend to go during non-consolidation periods. Remember that a natural exit is when the blue crosses the green line.
Step 7. Enable Show Event Regions in Section 7. Then adjust Section 6. Blue background fills are spikes and red fills are plunging prices. These measurements should be hard to come by so you should see relatively few fills on the chart if you’ve set this up as intended. Section 6 includes the Zscore oscillator the state of which combines with the signal lines to detect statistically significant price movement. The Zscore is a zero based calculation with positive and negative magnitude readings. You want to input a reasonably large number slightly below the maximum amplitude seen on the chart. Both rise and fall inputs are entered as a positive real number. You can easily use my code to create a separate indicator if you want to see it in action. The default value is sufficient for most configurations.
Step 8. Turn off Show Event Regions and enable Show Entry Regions in Section 7. Then adjust Section 3. This section contains two parts. The entry setup crossovers and EMA events. Adjust the crossovers first. That is the Fast Cross Length and Slow Cross Length. The frequency of your trades will be shown as blue and red fills. There should be a lot. Then turn off Show Event Regions and enable Display EMA Peaks. Adjust all the fields that have the word EMA. This is actually the yellow line on the chart. The blue and red fills should show much less than the crossovers but more than event fills shown in Step 7.
Step 9. Change the Trading Mode to BiDir if you selected No Trades previously. Look on the chart and see where the trades are occurring. Make adjustments to the Minimum Profit and Stop Offset in Section 1 if necessary. Wider profits and stops reduce the trade frequency.
Step 10. Go to Section 4 and 5 and make fine tuning adjustments to the long and short side.
Example Settings
To reproduce the performance shown on the chart please use the following configuration: (Bitcoin on the Kraken exchange)
1. Select XBTUSD Kraken as the chart symbol.
2. On the properties tab set the Order Size to: 0.01 Bitcoin
3. On the properties tab set the Pyramiding to: 12
4. In Section 1: Select “Crypto” for the Trading Model
5. In Section 1: Input 2000 for the Minimum Profit
6. In Section 1: Input 0 for the Stop Offset (No Stop)
7. In Section 1: Input 10 for the Tick Scalar
8. In Section 1: Input 1000 for the Price Normalizer
9. In Section 1: Input 2000 for the Pyramid Minimum Span
10. In Section 1: Check mark the Position Bale Out
11. In Section 2: Input 60 for the Signal Line Period
12. In Section 2: Input 1440 for the Trend Line Period
13. In Section 2: Input 5 for the Fast Alma Length
14. In Section 2: Input 22 for the Fast LinReg Length
15. In Section 2: Input 100 for the Slow LinReg Length
16. In Section 2: Input 90 for the Trend Line Length
17. In Section 2: Input 14 Stochastic Length
18. In Section 3: Input 9 Fast Cross Length
19. In Section 3: Input 24 Slow Cross Length
20. In Section 3: Input 8 Fast EMA Length
21. In Section 3: Input 10 Fast EMA Rise NetChg
22. In Section 3: Input 1 Fast EMA Rise ROC
23. In Section 3: Input 10 Fast EMA Fall NetChg
24. In Section 3: Input 1 Fast EMA Fall ROC
25. In Section 4: Check mark the Long Natural Exit
26. In Section 4: Check mark the Long Signal Exit
27. In Section 4: Check mark the Long Price Event Exit
28. In Section 4: Check mark the Long Stochastic Exit
29. In Section 5: Check mark the Short Natural Exit
30. In Section 5: Check mark the Short Signal Exit
31. In Section 5: Check mark the Short Price Event Exit
32. In Section 5: Check mark the Short Stochastic Exit
33. In Section 6: Input 120 Rise Event NetChg
34. In Section 6: Input 1 Rise Event ROC
35. In Section 6: Input 5 Min Above Zero ZScore
36. In Section 6: Input 120 Fall Event NetChg
37. In Section 6: Input 1 Fall Event ROC
38. In Section 6: Input 5 Min Below Zero ZScore
In this configuration we are trading in long only mode and have enabled downward pyramiding. The purple trend line is based on the day (1440) period. The length is set at 90 days so it’s going to take a while for the trend line to alter course should this symbol decide to node dive for a prolonged amount of time. Your trades will still go long under those circumstances. Since downward accumulation is enabled, your position size will grow on the way down.
The performance example is Bitcoin so we assume the trader is buying coins outright. That being the case we don’t need a stop since we will never receive a margin call. New buy signals will be generated when the price exceeds the magnitude and speed defined by the Event Net Change and Rate of Change.
Feel free to PM me with any questions related to this script. Thank you and happy trading!
CFTC RULE 4.41
These results are based on simulated or hypothetical performance results that have certain inherent limitations. Unlike the results shown in an actual performance record, these results do not represent actual trading. Also, because these trades have not actually been executed, these results may have under-or over-compensated for the impact, if any, of certain market factors, such as lack of liquidity. Simulated or hypothetical trading programs in general are also subject to the fact that they are designed with the benefit of hindsight. No representation is being made that any account will or is likely to achieve profits or losses similar to these being shown.
ค้นหาในสคริปต์สำหรับ "range"

MarketGod for Tradingview(strategy)Fully Open Source Tv Market God Strategy. Good Luck
Strategy Description
MarketGod can be applied to any market, with any time-frame associated to it. The signals relay the alert at the close of the period, and the painted alert is then available to users to see on the chart or even set notifications for via tradingview's alert system. We recommend that users implement marketgod on their preferred time frames for trading, which for us is the 1h, 4h, 6h, 1D and above TFs.
MarketGod Versioning
The versions included with this release are the following
MarketGod v1
MarketGod v2
MarketGod v3
MarketGod v4
MarketGod v5
MarketGod v6
MarketGod v7
MarketGod v8
MarketGodx²
Ichimoku God
Suggested Uses
• MarketGod will inevitably produce false positives. We've taken steps to reduce this but we highly suggest you add this as a component of your strategy, not an end all be all
• That said, please do not feel the need to fire a trade based solely on a marketgod signal, or to every signal it fires.
• MarketGod users should backtest their strategy using OHLC candles for best results
• Heikin Ashi candles were recomended in the past, and we have eliminated the need for them, meaning that traditional candlestick inputs will yield the highest results.
• MarketGod will always give stronger alerts on higher TF's. If the 1-Day has fired a given signal and the 30 min or similar fire the opposite signal, know that the overall trend is still likely downward. Same concept applies to all timeframes on this tool.
Adjusting the Filter Settings
This tool has a noise filter for users to adjust.
The filter is a percentage based calculation, between significant points in time. The filter ranges between .5 and 25, with .5 increments
• For lower TFs ( IE Intraday), keep the filter set between .5-5
• Mid-TFs (4H,6H,12H,1D), the recommended range is between 5.5-10
• Higher TFs (3D and Higher), look for approx 11-20 range
Customizations
Customize the indicator by adjusting the colors in the style pane. Additionally, users can change the plots into labels with the price of close added to them, or a few other label text options, listed in the 'inputs' panel, below the filter adjustments. Users can also opt to turn the strategy orders as well, as this version will have them printed.
Strategy Performance Interpretation
Its important to understand the only metric that should be relevant is not the win %, as many may initially think. Alternatively, the only metric that matters in the end is your take home profit... meaning the profit one fees and taxes are accounted for. In our example here, the % brought back since the beginning of our window of 2018 is around 47% for $10,000 initial capital and 10% traded per position. Many are ignorant to the take home profit aspect as they focus solely on the winning %, which is ultimately incorrect approach to trading as a whole. as long as we maintain +30% (our goal minimum), the outcome being in the green, is our goal.

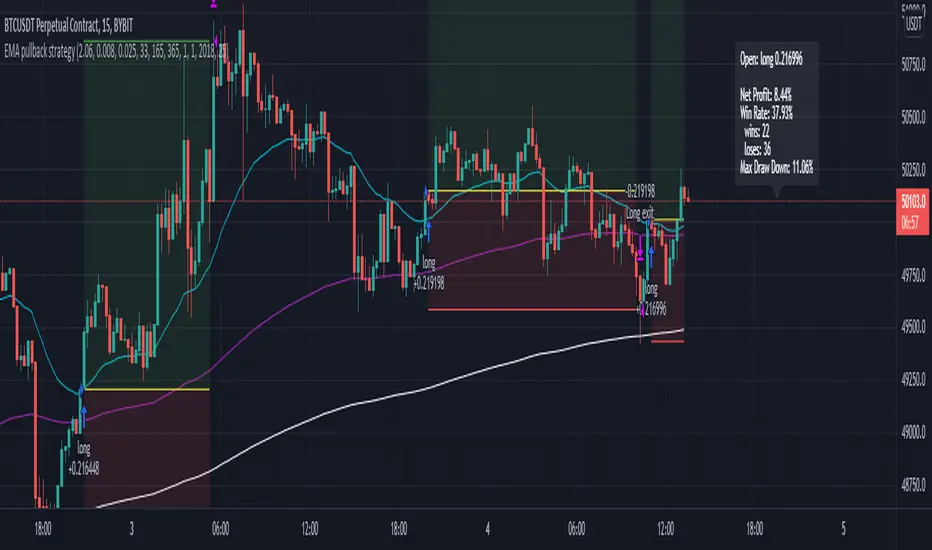
EMA pullback strategyA solid EMA pullback strategy for cryptos 15 min chart that uses EMA crossing as signal and pullback as stop loss.
EMA1: shortest period for finding crossing (I find period = 33 profitable for BTCUSD, you can adjust it for other cryptos)
EMA2: 5x period of EMA1, for filtering out some trend reversals
EMA3: 11x period of EMA1, for determining trend direction
Rules are:
Long:
close price > EMA3
EMA1 > EMA3
close price pullbacks below EMA1 and then crosses up EMA1, enter at the first close price above EMA1
lowest pullback close price < EMA2 at the cross up
Short:
close price < EMA3
EMA1 < EMA3
close price pullbacks above EMA1 and then crosses down EMA1, enter at the first close price below EMA1
highest pullback close price > EMA2 at the cross down
Stop-loss at lowest/highest pullback price for long/short
Take profit = 2x stop-loss
Risk management: risk range can be set in the inspector. If the risk is lower than the range, the trade is not taken. if the risk is higher than the range, the position size is adjusted to keep the risk within range.
The Lazy Trader - Index (ETF) Trend Following Robot50/150 moving average, index (ETF) trend following robot. Coded for people who cannot psychologically handle dollar-cost-averaging through bear markets and extreme drawdowns (although DCA can produce better results eventually), this robot helps you to avoid bear markets. Be a fair-weathered friend of Mr Market, and only take up his offer when the sun is shining! Designed for the lazy trader who really doesn't care...
Recommended Chart Settings:
Asset Class: ETF
Time Frame: Daily
Necessary ETF Macro Conditions:
a) Country must have healthy demographics, good ratio of young > old
b) Country population must be increasing
c) Country must be experiencing price-inflation
Default Robot Settings:
Slow Moving Average: 50 (integer) //adjust to suit your underlying index
Fast Moving Average: 150 (integer) //adjust to suit your underlying index
Bullish Slope Angle: 5 (degrees) //up angle of moving averages
Bearish Slope Angle: -5 (degrees) //down angle of moving averages
Average True Range: 14 (integer) //input for slope-angle formula
Risk: 100 (%) //100% risk means using all equity per trade
ETF Test Results (Default Settings):
SPY (1993 to 2020, 27 years), 332% profit, 20 trades, 6.4 profit factor, 7% drawdown
EWG (1996 to 2020, 24 years), 310% profit, 18 trades, 3.7 profit factor, 10% drawdown
EWH (1996 to 2020, 24 years), 4% loss, 26 trades, 0.9 profit factor, 36% drawdown
QQQ (1999 to 2020, 21 years), 232% profit, 17 trades, 3.6 profit factor, 2% drawdown
EEM (2003 to 2020, 17 years), 73% profit, 17 trades, 1.1 profit factor, 3% drawdown
GXC (2007 to 2020, 13 years), 18% profit, 14 trades, 1.3 profit factor, 26% drawdown
BKF (2009 to 2020, 11 years), 11% profit, 13 trades, 1.2 profit factor, 33% drawdown
A longer time in the markets is better, with the exception of EWH. 6 out of 7 tested ETFs were profitable, feel free to test on your favourite ETF (default settings) and comment below.
Risk Warning:
Not tested on commodities nor other financial products like currencies (code will not work), feel free to leave comments below.
Moving Average Slope Angle Formula:
Reproduced and modified from source:

MarketGodx for Tradingview - Strategy TestMarketGodx for Tradingview
Version = MarketGodx²
Indicator Description
MarketGodx weighs the probability of a given scenario and the outcome associated to prior events before sequentially weighing the impact of a probable move by the significance of the timeframe and its corresponding close sequence relative to other TFs, The indicator combines several components of classical technical analysis and then provides a Buy or Sell alert to traders, which is then acted upon by the user. There are modifications made to alerts to manipulate them in the alternating appearance as the visual above shows.
MarketGod can be applied to any market, with any time-frame associated to it. The signals relay the alert at the close of the period, and the painted alert is then available to users to see on the chart or even set notifications for via tradingview's alert system. We recommend that users implement marketgod on their preferred time frames for trading, which for us is the 1h, 4h, 6h, 1D and above TFs.
Indicator Components
Gann Trend Analysis
Stochastic K
Stochastic D
KDJ Calculation
MACD
SlowRSI
Bollinger Band
Keltner Channels
Ichimoku Cloud
HHLL Trend Detector
MarketGod EMA , WMA , SMA , HullMA
Accumulation + Distribution
Suggested Uses
MarketGod will inevitably produce false positives. We've taken steps to reduce this but we highly suggest you add this as a component of your strategy, not an end all be all
That said, please do not feel the need to fire a trade based solely on a marketgod signal, or to every signal it fires.
MarketGod users should backtest their strategy using OHLC candles for best results
Heikin Ashi candles were recomended in the past, and we have eliminated the need for them, meaning that traditional candlestick inputs will yield the highest results.
MarketGod will always give stronger alerts on higher TF's. If the 1-Day has fired a given signal and the 30 min or similar fire the opposite signal, know that the overall trend is still likely downward. Same concept applies to all timeframes on this tool.
Adjusting the Filter Settings
This tool has a noise filter for users to adjust.
The filter is a percentage based calculation, between significant points in time. The filter ranges between .5 and 25, with .5 increments
For lower TFs (IE Intraday), keep the filter set between .5-5
Mid-TFs (4H,6H,12H,1D), the recommended range is between 5.5-10
Higher TFs (3D and Higher), look for approx 11-20 range
Customizations
Customize the indicator by adjusting the colors in the style pane. Additionally, users can change the plots into labels with the price of close added to them, or a few other label text options, listed in the 'inputs' panel, below the filter adjustments. Users can also opt to turn the strategy orders as well, as this version will have them printed.
Strategy Performance Interpretation
Its important to understand the only metric that should be relevant is not the win %, as many may initially think. Alternatively, the only metric that matters in the end is your take home profit... meaning the profit one fees and taxes are accounted for. In our example here, the % brought back since the beginning of our window of 2018 is around 47% for $10,000 initial capital and 10% traded per position. Many are ignorant to the take home profit aspect as they focus solely on the winning %, which is ultimately incorrect approach to trading as a whole. as long as we maintain +30% (our goal minimum), the outcome being in the green, is our goal.
Access MarketGod for Tradingview
Learn more about how to access this tool by following the links in our signature below.

DMT Autobot StrategyDMT its a Modified homemade Trend Reversal Indicator base on Volatility & Average true range
You have to have a defined trading plan and you also have to believe it. For this, it is necessary to have coordination and harmony between the conscious and subconscious part of the individual, That is why it is so difficult for most retail traders to be profitable
ĐΜŦ is designed to identify spots in the market that offer some of the most suitable buy and sell scalping trading opportunities plus swing trading over runs.
ĐΜŦ is comprised of three inputs, which are helping to identify the volatility of a security. To determine the level of volatility there are three ranges included in the equation
Input 1 - Current Day's Range
Input 2 - How High has the security risen from the previous day's close
Input 3 - How low has the security dropped from the previous day's close
One of the greatest challenges for new traders is avoiding drawdowns on their account. Drawdowns are what kills a trader's ability to consistently earn over the long haul and creates enormous emotional pain and turmoil.
Drawdowns are a result of two factors:
(1) over-leverage and
(2) extremely volatile stocks. One could argue that if you get to number 1 right, the volatility is irrelevant; however, these two elements are not always mutually exclusive.
HOW TO USE
Buy and sell signals for entry
and 1 take profit levels
1 adjustable stop loss level for each direction.
easy to set up with Autobot service and alert system trading

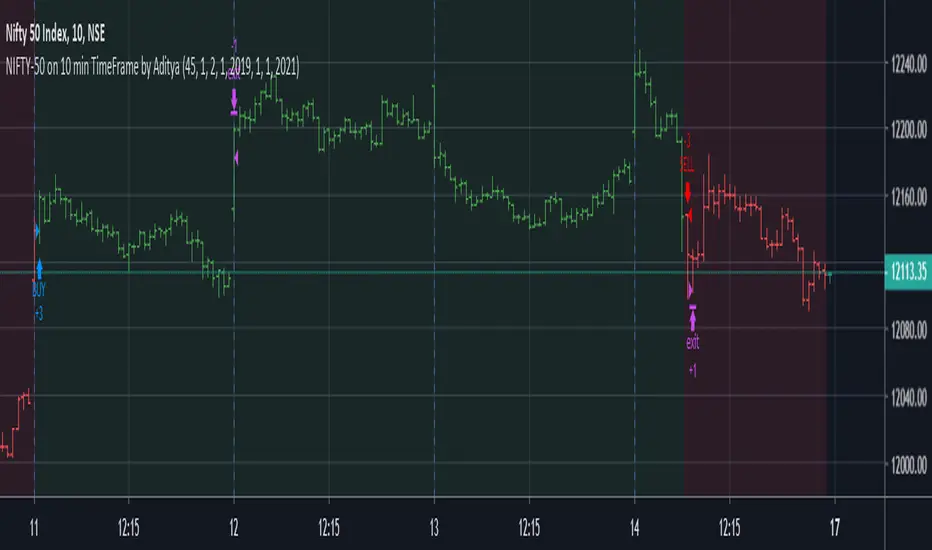
NIFTY-50 on 10 min TimeFrame by Aditya
I have developed this strategy for NIFTY-50 Index on which is traded National Stock of Exchange(India). It is non-repainting indicator and uses @version=4
This script uses hourly and daily price data.
The results will be very different depending on the chart and time-frame of your choice and date range of your choice.
The default contract quantity is set to 2 .You can adjust as per your risk management.
I have found that taking partial profit (1 contract) and continuing the with remaining (1 contract) keeps you in trade until next trend reversal.
It has following usage setting:
1. Enable/Disable take partial profit.
2. Partial profit points.(45 points gives better results)
3. No. of contracts for partial profit booking.
4. Date Range (From and To) to check for different date range.
4. Enable/Disable Bar Color.
5. Enable/Disable Background Color.
Thanks © allanster for script"How To Set Backtest Range" for Date Range functionality .
I have tested this indicator on 10 minutes time-frame on National Stock of Exchange(India) which gives good results and the time period is almost 1 year
from 21/01/2019 to 14/02/2020.
Points=5632.
No. of trades=202
Profit Factor=1.9
Sharpe Ratio=0.626
The NIFTY-50 contract size is 75.
This strategy gives better results on Index as this is optimized for Indexes. You can always try on other instruments or you can private message me.
Use proper risk management.
This is a premium indicator so send me a private message in order to access this script. This script is for information and educational purpose.
Voss Strategy (Filter + Trend Indicator) [Bitduke]Created strategy based on Voss Predictive Filter, implemented by TradingView user e2e4mfck.
Voss Predictive Filter
This is a relatively new filter from John F. Ehlers’ article, “A Peek Into The Future .” Ehlers describes the calculation of a new filter that could help signal cyclical turning points in markets.
But filter has a negative group delay and while an indicator based on it cannot actually see into the future, it may provide the trader with signals in advance of other indicators.
In mentioned article he tested filter on SPY and at one point in time "it went into a trend mode in January 2019, and the cycle signal failed miserably, signaling a short position during the runup. <...> The only way to minimize the impact of this condition is to employ an additional trend detector."
Thus I've added another Ehlers' based trend based indicator Instantaneous Trendline (thanks to LazyBear for implementation) to minimize the impact of the trend mode and got a good results on XBTUSD pair 4h.
Backtest :
> Range: 2016 - 2020
> XBTUSD
> 4h
> ~20% drawdown
> Sharpe (0.361, not too impressive)
I think it can be improved with Risk Management system and experimenting with various trend following indicators.

Pivot Reversal Strategy - FIGS & DATES 2.0Simple Pivot Reversal Strategy with some adding settings.
Date Range: To test over specific market conditions.
Initial Capitol: $10K - This is a more realistic representation of funds used this strategy (for me anyway). The default of $100K can give different results (usually better) than when using a smaller balance.
Order Size: 100% Equity - These trend following strategies typically used this way, going all in each direction.
Commission: .075% - It's always disheartening to think you've found a ridiculously good setting, and then realize you forgot to add the commission.
All of these settings can be changed, but it's easier for me (and more fool proof) to have them set as default.

EOS iWin IndicatorWelcome to the EOS IWIN Indicator!
This Indicator identifies possible buy and sell points when trading EOS.
Setup:
Time Range: 12hr
How to use:
Long = buy
Close Long = sell
* this is a tool not intended to be used as financial advice or to make any investment decisions.
* invest at your own risk

Bitcoin iWin Indicator & StrategyWelcome to the IWIN LS!
This is a trend identification indicator.
Setup:
Chart Historical Price must be set to "bars"
Time Range: 12hr
How to use:
Long = buy
Close Long = sell
* this is a tool not intended to be used as financial advice or to make any investment decisions.
* invest at your own risk

IWIN Long & Short strategyWelcome to the IWIN LS!
This is a trend identification indicator.
Setup:
Chart Historical Price must be set to "bars"
Time Range: 8hr
How to use:
Long = buy
Close Long = sell
Short = short
Close Short = cover
* this is a tool not intended to be used as financial advice or to make any investment decisions.
* invest at your own risk

half log strategytime range: change the period to match the best win rate
tax: no trade if the amplitude of middle area is smaller than tax
max_order: the max_order in the middle area
SB_Compliment_RSI StrategyThe strategy modifies the original rsi strategy with the addition of compliment si (i.e. 100-rsi).
Strategy Idea: Previous rsi high and low value is recorded when the rsi crosses overBought(70) and OverSold(30) values.
Now when the rsi crosses above the overSold range, the rsi is matched with the compliment of previous high rsi value. If the compliment i.e.(100-prev_rsi_high) is less than or equal to rsi then long position is taken.
For short position, when the rsi crosses below the overBought range, the rsi is matched with the compliment of previous low rsi value. If compliment i.e.(100-prev_rsi_low) is greater than or equal to rsi.
Below s the code for the indicator present in the chart.
//@version=3
study(title="SB_Compliment_Relative Strength Index", shorttitle="RSI")
src = close, len = input(14, minval=1, title="Length")
up = rma(max(change(src), 0), len)
down = rma(-min(change(src), 0), len)
rsi = down == 0 ? 100 : up == 0 ? 0 : 100 - (100 / (1 + up / down))
plot(rsi, color=purple)
plot(100-rsi, color=orange)
band1 = hline(70)
band0 = hline(30)
fill(band1, band0, color=purple, transp=90)
The code also has switch code also which means it will enter the overBrought or overSold block one after the other.
Future modifications: Currently the value of rsi tracked is the one in which it crosses the overSold or OverBought range and not the highest/lowest value when the value is above/below OverBought/OverSold range.
Comment the perfect combination of indicators for it and will try to incorporate those indicators into it in the next version.
Message if you think of any modifications/ enhancements/ any opportunities. :)
Donations/Tips... :) -
BTC: 1BjswGcRR6c23pka7qh5t5k56j46cuyyy2
ETH: 0x64fed71c9d6c931639c7ba4671aeb6b05e6b3781
LTC: LKT2ykQ8QSzzfTDB6Tnsf12xwYPjgq95h4

GIX Analizor strategiiGIX Analyzer – Intelligent Time Filters + X Strategy
This script combines the X Strategy with an advanced system for filtering trades based on time intervals. The strategy allows:
Filtering by preset trading hours (active sessions )
Filtering by a fully customizable time interval (hour + minute, Romania time )
Filtering by calendar range (Start Date → End Date)
Simultaneous activation of both time-filter modes for maximum control
Trading only within valid time ranges, while keeping all logic unchanged
This indicator provides high flexibility for testing and optimizing trading entries based on hours, minutes, and calendar periods—while preserving the simplicity and efficiency of any strategy

YCGH Ultimate Stocks Breakout Sniper📈 YCGH Ultimate Stocks Breakout Sniper
Overview
A sophisticated momentum-based breakout strategy designed to capture high-probability directional moves during volatility expansion phases. This system identifies breakout opportunities when price decisively breaks through established ranges, combining multiple technical filters to enhance signal quality and minimize false breakouts.
🎯 Strategy Features
Core Methodology:
Proprietary breakout detection algorithm
Multi-layered confirmation filters for signal validation
Adaptive trailing stops for profit protection
Systematic risk management with daily drawdown controls
Key Components:
✅ Volatility Expansion Filter - Only trades during periods of elevated market volatility to avoid choppy, range-bound conditions
✅ Optional Trend Alignment - Configurable trend filter (EMA/SMA/RMA/WMA) to align entries with broader market direction
✅ ROC Momentum Filter - Daily rate-of-change filter to capture strong momentum days (optional)
✅ Comprehensive Exit Strategy:
Fixed stop-loss (default 2%)
Take-profit targets (default 9%)
Dynamic trailing stops (2% activation, 0.5% offset)
✅ Flexible Direction Trading:
Auto-detect mode: Long+Short for perpetuals, Long-only for spot/equities
Manual override options available
Suitable for both crypto and stock markets
📊 Market Applicability
Optimized for: Cryptocurrency perpetual contracts and equity markets (1H-4H timeframes)
Also effective on: Futures and high-liquidity spot markets
The strategy adapts to different market regimes through configurable volatility and trend filters, making it versatile across various trading instruments and timeframes.
⚙️ Risk Management
Position Sizing: Percentage-based allocation with leverage support
Intraday Loss Limit: Maximum 10% drawdown protection (configurable)
Realistic Cost Modeling: 0.025% commission + 1 tick slippage
No Pyramiding: Single position management for controlled risk exposure
📈 Performance Visualization
Includes a comprehensive monthly returns table displaying:
Year-by-year performance breakdown
Monthly profit/loss percentages
Visual color-coding (green for profits, red for losses)
Clean, modern design with transparent styling
🔐 Access & Pricing
This is a PROTECTED, invite-only strategy.
The source code is not open-source and requires paid access for usage.
How to Get Access:
📧 Email: brijamohanjha@gmail.com
Include in your email:
Your TradingView username
Markets/assets you plan to trade
Preferred timeframe
What You'll Receive:
Full strategy access with invite-only permissions
Complete parameter documentation
Setup and optimization guidance
Implementation support
⚠️ Important Disclosures
Backtesting Parameters:
Commission: 0.025% per trade
Slippage: 1 tick
Results reflect realistic trading conditions
Risk Warning:
Past performance does not guarantee future results. This strategy involves substantial risk and may not be suitable for all investors. Users should thoroughly understand the risks and customize parameters based on their risk tolerance and market conditions.
📞 Contact for Access
Email: brijamohanjha@gmail.com
For questions about functionality, pricing, optimization, or market-specific settings, please reach out via email.
Note: This is a premium, paid strategy. Access is granted manually after consultation and payment confirmation.

15m ORB Breakout NAS100 (5m Mgmt) v6 - OptimizedOpening Range Breakout Strategy
Buy and sell signals are given upon break of market session opening range. Best utilized for 30 minute NY opening range, managed on 5 min timeframe on NAS100. Tweak the settings for higher win rate on backtesting dashboard before implementing strategy.

维加斯双通道策略Vegas Channel Comprehensive Strategy Description
Strategy Overview
A comprehensive trading strategy based on the Vegas Dual Channel indicator, supporting dynamic position sizing and fund management. The strategy employs a multi-signal fusion mechanism including classic price crossover signals, breakout signals, and retest signals, combined with trend filtering, RSI+MACD filtering, and volume filtering to ensure signal reliability.
Core Features
Dynamic Position Sizing: Continue adding positions on same-direction signals, close all positions on opposite signals
Smart Take Profit/Stop Loss: ATR-based dynamic TP/SL, updated with each new signal
Fund Management: Supports dynamic total amount management for compound growth
Time Filtering: Configurable trading time ranges
Risk Control: Maximum order limit to prevent over-leveraging
Leverage Usage Instructions
Important: This strategy does not use TradingView's margin functionality
Setup Method
Total Amount = Actual Funds × Leverage Multiplier
Example: Have 100U actual funds, want to use 10x leverage → Set total amount to 100 × 10 = 1000U
Trading Amount Calculation
Each trade percentage is calculated based on leveraged amount
Example: Set 10% → Actually trade 100U margin × 10x leverage = 1000U trading amount
Maximum Orders Configuration
Must be used in conjunction with leveraged amount
Example: 1000U total amount, 10% per trade, maximum 10 orders = maximum use of 1000U
Note: Do not exceed 100% of total amount to avoid over-leveraging
Parameter Configuration Recommendations
Leverage Configuration Examples
Actual funds 100U, 5x leverage, total amount setting 500U, 10% per trade, 50U per trade, recommended maximum orders 10
Actual funds 100U, 10x leverage, total amount setting 1000U, 10% per trade, 100U per trade, recommended maximum orders 10
Actual funds 100U, 20x leverage, total amount setting 2000U, 5% per trade, 100U per trade, recommended maximum orders 20
Risk Control
Conservative: 5-10x leverage, 10% per trade, maximum 5-8 orders
Aggressive: 10-20x leverage, 5-10% per trade, maximum 10-15 orders
Extreme: 20x+ leverage, 2-5% per trade, maximum 20+ orders
Strategy Advantages
Signal Reliability: Multiple filtering mechanisms reduce false signals
Capital Efficiency: Dynamic fund management for compound growth
Risk Controllable: Maximum order limits prevent liquidation
Flexible Configuration: Supports various leverage and fund allocation schemes
Time Control: Configurable trading hours to avoid high-risk periods
Usage Notes
Ensure total amount is set correctly (actual funds × leverage multiplier)
Maximum orders should not exceed the range allowed by total funds
Recommend starting with conservative configuration and gradually adjusting parameters
Regularly monitor strategy performance and adjust parameters timely
维加斯通道综合策略说明
策略概述
基于维加斯双通道指标的综合交易策略,支持动态加仓和资金管理。策略采用多信号融合机制,包括经典价穿信号、突破信号和回踩信号,结合趋势过滤、RSI+MACD过滤和成交量过滤,确保信号的可靠性。
核心功能
动态加仓:同向信号继续加仓,反向信号全部平仓
智能止盈止损:基于ATR的动态止盈止损,每次新信号更新
资金管理:支持动态总金额管理,实现复利增长
时间过滤:可设置交易时间范围
风险控制:最大订单数限制,防止过度加仓
杠杆使用说明
重要:本策略不使用TradingView的保证金功能
设置方法
总资金 = 实际资金 × 杠杆倍数
示例:实际有100U,想使用10倍杠杆 → 总资金设置为 100 × 10 = 1000U
交易金额计算
每笔交易百分比基于杠杆后的金额计算
示例:设置10% → 实际交易 100U保证金 × 10倍杠杆 = 1000U交易金额
最大订单数配置
必须配合杠杆后的金额使用
示例:1000U总资金,10%单笔,最大10单 = 最多使用1000U
注意:不要超过总资金的100%,避免过度杠杆
参数配置建议
杠杆配置示例
实际资金100U,5倍杠杆,总资金设置500U,单笔百分比10%,单笔金额50U,建议最大订单数10单
实际资金100U,10倍杠杆,总资金设置1000U,单笔百分比10%,单笔金额100U,建议最大订单数10单
实际资金100U,20倍杠杆,总资金设置2000U,单笔百分比5%,单笔金额100U,建议最大订单数20单
风险控制
保守型:5-10倍杠杆,10%单笔,最大5-8单
激进型:10-20倍杠杆,5-10%单笔,最大10-15单
极限型:20倍以上杠杆,2-5%单笔,最大20单以上
策略优势
信号可靠性:多重过滤机制,减少假信号
资金效率:动态资金管理,实现复利增长
风险可控:最大订单数限制,防止爆仓
灵活配置:支持多种杠杆和资金配置方案
时间控制:可设置交易时间,避开高风险时段
使用注意事项
确保总资金设置正确(实际资金×杠杆倍数)
最大订单数不要超过总资金允许的范围
建议从保守配置开始,逐步调整参数
定期监控策略表现,及时调整参数

Trend MasterOverview
The Strategy is a trend-following trading system designed for forex, stocks, or other markets on TradingView. It uses pivot points to identify support and resistance levels, combined with a 200-period Exponential Moving Average (EMA) to filter trades. The strategy enters long or short positions based on trend reversals during specific trading sessions (London or New York). It incorporates robust risk management, including position sizing based on risk percentage or fixed amount, trailing stop-losses, breakeven moves, and weekly/monthly profit/loss limits to prevent overtrading.
This script is ideal for traders who want a semi-automated approach with visual aids like colored session backgrounds, support/resistance lines, and a performance dashboard. It supports backtesting from a custom start date and can limit trades to one per session for discipline. Alerts are built-in for entries, exits, and stop-loss adjustments, making it compatible with automated trading bots.
Key Benefits:
Trend Reversal Detection: Spots higher highs/lows and lower highs/lows to confirm trend changes.
Session Filtering: Trades only during high-liquidity sessions to avoid choppy markets.
Risk Control: Automatically calculates position sizes to risk only a set percentage or dollar amount per trade.
Performance Tracking: Displays a table of weekly or monthly P&L (profit and loss) with color-coded heatmaps for easy review.
Customizable: Adjust trade direction, risk levels, take-profit ratios, and more via inputs.
The strategy uses a 1:1.2 risk-reward ratio by default but can be tweaked.
How It Works
Trend Identification:
The script calculates pivot highs and lows using left (4) and right (2) bars to detect swing points.
It identifies patterns like Higher Highs (HH), Higher Lows (HL), Lower Highs (LH), and Lower Lows (LL) to determine the trend direction (uptrend if above resistance, downtrend if below support).
Support (green dotted lines) and resistance (red dotted lines) are drawn dynamically and update on trend changes.
Bars are colored blue (uptrend) or black (downtrend) for visual clarity.
Entry Signals:
Long Entry: Price closes above the 200 EMA, trend shifts from down to up (e.g., breaking resistance), during an active session (London or NY), and no trade has been taken that session (if enabled).
Short Entry: Price closes below the 200 EMA, trend shifts from up to down (e.g., breaking support), during an active session, and no prior trade that session.
Trades can be restricted to "Long Only," "Short Only," or "Both."
Entries are filtered by a start date (e.g., from January 2022) and optional month-specific testing.
Position Sizing and Risk:
Risk per trade: Either a fixed dollar amount (e.g., $500) or percentage of equity (e.g., 1%).
Quantity is calculated as: Risk Amount / (Entry Price - Stop-Loss Price).
This ensures you never risk more than intended, regardless of market volatility.
Stop-Loss (SL) and Take-Profit (TP):
SL for Longs: Set below the recent support level, adjustable by a "reduce value" (e.g., tighten by 0-90%) and gap (e.g., add a buffer).
SL for Shorts: Set above the recent resistance level, with similar adjustments.
TP: Based on risk-reward ratio (default 1.2:1), so if SL is 100 pips away, TP is 120 pips in profit.
Visual boxes show SL (red) and TP (green) on the chart for the next 4 bars after entry.
Trade Management:
Trailing SL: Automatically moves SL to the new support (longs) or resistance (shorts) if it tightens the stop without increasing risk.
Breakeven Move: If enabled, SL moves to entry price once profit reaches a set ratio of initial risk (default 1:1). For example, if risk was 1%, SL moves to breakeven at 1% profit.
One Trade Per Session: Prevents multiple entries in the same London or NY session to avoid overtrading.
Sessions include optional weekend inclusion and are highlighted (blue for London, green for NY).
Risk Limits (Weekly/Monthly):
Monitors P&L for the current week or month.
Stops trading if losses hit a limit (e.g., -3%) or profits reach a target (e.g., +7%).
Resets at the start of each new week/month.
Alerts notify when limits are hit.
Exits:
Trades exit at TP, SL, or manually via alerts.
No time-based exits; relies on price action.
Performance Dashboard:
A customizable table (position, size, colors) shows P&L percentages for each week/month in a grid.
Rows = Years, Columns = Weeks (1-52) or Months (1-12).
Color scaling: Green for profits (darker for bigger wins), red for losses (darker for bigger losses).
Yearly totals in the last column.
Helps visualize strategy performance over time without manual calculations.
Input Parameters Explained
Here's a breakdown of the main inputs for easy customization:
Trade Direction: "Both" (default), "Long Only," or "Short Only" – Controls allowed trade types.
Test Only Selected Month: If true, backtests only the specified month from the start year.
Start Year/Month: Sets the backtest start date (default: Jan 2022).
Include Weekends: If true, sessions can include weekends (rarely useful for forex).
Only One Trade Per Session: Limits to one entry per London/NY session (default: true).
Risk Management Time Frame: "Weekly" or "Monthly" – For P&L limits.
Enable Limits: Toggle weekly/monthly stop trading on loss/profit thresholds.
Loss Limit (%)/Profit Target (%): Stops trading if P&L hits these (e.g., -3% loss or +7% profit).
London/New York Session: Enable/disable, with time ranges (e.g., London: 0800-1300 UTC).
Left/Right Bars: For pivot detection (default: 4 left, 2 right) – Higher values smooth signals.
Support/Resistance: Toggle lines, colors, style, width.
Change Bar Color: Colors bars based on trend.
TP RR: Take-profit risk-reward (default: 1.2).
Stoploss Reduce Value: Tightens SL (negative values widen it, 0-0.9 range).
Stoploss Gap: Adds a buffer to SL (e.g., 0.1% away from support).
Move to Breakeven: Enables SL move to entry at a profit ratio (default: true, 1:1).
Use Risk Amount $: If true, risks fixed $ (e.g., 500); else, % of equity (default: 1%).
EMA 3: The slow EMA period (default: 200) for trend filter.
Performance Display: Toggle table, location (e.g., Bottom Right), size, colors, scaling for heatmaps.
Setup and Usage Tips
Add to Chart: Copy the script into TradingView's Pine Editor, compile, and add to your chart.
Backtesting: Use the Strategy Tester tab. Adjust inputs and test on historical data.
Live Trading: Connect alerts to a broker or bot (e.g., via webhook). The script sends JSON-formatted alerts for entry, exit, SL moves, and limits.
Best Markets: Works well on crypto pairs like SOLUSD or RUNEUSD on 4H timeframes.
Risk Warning: This is not financial advice. Always use demo accounts first. Past performance doesn't guarantee future results. Commission is set to 0.05% by default – adjust for your broker.
Customization: Experiment with EMA length or RR ratio for your style.

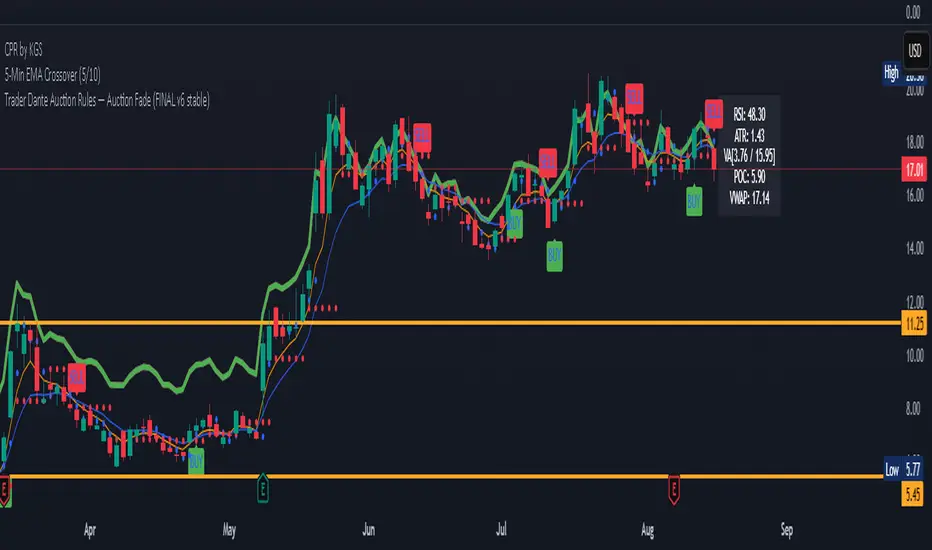
Auction Market Theory: Value Area & VWAP Fade - DashboardAn "Auction Market Theory" dashboard is a visual summary of the market's state according to the principles of Auction Market Theory. It consolidates key metrics like the Value Area (VA), Point of Control (POC), and Volume-Weighted Average Price (VWAP) into a single, easy-to-read panel on your chart.
What a Dashboard Shows
The purpose of the dashboard is to give traders a quick, real-time snapshot of the market's auction process. It helps you answer critical questions like:
Where is the market's "fair value"? This is shown by the Value Area (VA) range.
Where is the most volume concentrated? This is the Point of Control (POC), the price that acts as a gravitational center.
How are market participants currently positioned? The VWAP provides a measure of the average price paid, weighted by volume. Price trading above VWAP suggests a bullish volume bias, while price below suggests a bearish bias.
Is the market in a state of balance or imbalance? The relationship between the current price and these key levels helps to quickly determine if the market is accepting a price range (balance) or rejecting it (imbalance/trend).
How to Interpret the Dashboard
Value Area (VA) & Point of Control (POC)
These metrics are derived from a volume profile and are the foundation of the auction theory dashboard. The dashboard displays the VA's low and high, as well as the POC. These levels define the market's "accepted" price range for a given period.
VWAP
VWAP acts as a real-time moving average that is more responsive to volume than a standard moving average. It's often used as an intraday anchor. When price is significantly stretched from the VWAP (and its standard deviation bands), it's a signal of a potential over-extension and a target for a mean-reversion trade.
Dashboard's Role in Trading
The dashboard is not an entry signal itself, but a contextual tool. It provides the framework for your trading decisions. For a "fade the edge" strategy, you would use the dashboard to:
Identify the edges: See the exact price levels of the VA and VWAP bands.
Wait for the stretch: Look for price to move beyond those edges.
Confirm the reversal: Only then would you look at other indicators (like RSI or volume spikes) for an entry signal.
Manage the trade: Use the POC as a potential take-profit target, as price has a high probability of returning to this point of volume consensus.
Estrategia de NY ORB por CPThis strategy marks the New York market opening range during the first 15 minutes and confirms a buy or sell entry once the price returns and retests that range. It’s designed to capture trades of 60 points or more after the range has been retested. I suggest complementing the strategy with an indicator that highlights FVGs (Fair Value Gaps) or order blocks to better understand what price is doing and where it’s heading.
esta estrategia te marca el rango de apertura del mercado de ny de los primeros 15 minutos y te confirma entrada en venta o compra una vez que el precio regrese y retestee el rango. esta diseñada para tener trades de 60 puntos o mas una vez que el rango sea retesteado. sugiero acompañar la estrategia con algun indicador que marque fvg o order blocks para tener una mejor de lo que el precio esta haciendo y hacia donde se dirige.

MACD Liquidity Tracker Strategy [Quant Trading]MACD Liquidity Tracker Strategy
Overview
The MACD Liquidity Tracker Strategy is an enhanced trading system that transforms the traditional MACD indicator into a comprehensive momentum-based strategy with advanced visual signals and risk management. This strategy builds upon the original MACD Liquidity Tracker System indicator by TheNeWSystemLqtyTrckr , converting it into a fully automated trading strategy with improved parameters and additional features.
What Makes This Strategy Original
This strategy significantly enhances the basic MACD approach by introducing:
Four distinct system types for different market conditions and trading styles
Advanced color-coded histogram visualization with four dynamic colors showing momentum strength and direction
Integrated trend filtering using 9 different moving average types
Comprehensive risk management with customizable stop-loss and take-profit levels
Multiple alert systems for entry signals, exits, and trend conditions
Flexible signal display options with customizable entry markers
How It Works
Core MACD Calculation
The strategy uses a fully customizable MACD configuration with traditional default parameters:
Fast MA : 12 periods (customizable, minimum 1, no maximum limit)
Slow MA : 26 periods (customizable, minimum 1, no maximum limit)
Signal Line : 9 periods (customizable, now properly implemented and used)
Cryptocurrency Optimization : The strategy's flexible parameter system allows for significant optimization across different crypto assets. Traditional MACD settings (12/26/9) often generate excessive noise and false signals in volatile crypto markets. By using slower, more smoothed parameters, traders can capture meaningful momentum shifts while filtering out market noise.
Example - DOGE Optimization (45/80/290 settings) :
• Performance : Optimized parameters yielding exceptional backtesting results with 29,800% PnL
• Why it works : DOGE's high volatility and social sentiment-driven price action benefits from heavily smoothed indicators
• Timeframes : Particularly effective on 30-minute and 4-hour charts for swing trading
• Logic : The very slow parameters filter out noise and capture only the most significant trend changes
Other Optimizable Cryptocurrencies : This parameter flexibility makes the strategy highly effective for major altcoins including SUI, SEI, LINK, Solana (SOL) , and many others. Each crypto asset can benefit from custom parameter tuning based on its unique volatility profile and trading characteristics.
Four Trading System Types
1. Normal System (Default)
Long signals : When MACD line is above the signal line
Short signals : When MACD line is below the signal line
Best for : Swing trading and capturing longer-term trends in stable markets
Logic : Traditional MACD crossover approach using the signal line
2. Fast System
Long signals : Bright Blue OR Dark Magenta (transparent) histogram colors
Short signals : Dark Blue (transparent) OR Bright Magenta histogram colors
Best for : Scalping and high-volatility markets (crypto, forex)
Logic : Leverages early momentum shifts based on histogram color changes
3. Safe System
Long signals : Only Bright Blue histogram color (strongest bullish momentum)
Short signals : All other colors (Dark Blue, Bright Magenta, Dark Magenta)
Best for : Risk-averse traders and choppy markets
Logic : Prioritizes only the strongest bullish signals while treating everything else as bearish
4. Crossover System
Long signals : MACD line crosses above signal line
Short signals : MACD line crosses below signal line
Best for : Precise timing entries with traditional MACD methodology
Logic : Pure crossover signals for more precise entry timing
Color-Coded Histogram Logic
The strategy uses four distinct colors to visualize momentum:
🔹 Bright Blue : MACD > 0 and rising (strong bullish momentum)
🔹 Dark Blue (Transparent) : MACD > 0 but falling (weakening bullish momentum)
🔹 Bright Magenta : MACD < 0 and falling (strong bearish momentum)
🔹 Dark Magenta (Transparent) : MACD < 0 but rising (weakening bearish momentum)
Trend Filter Integration
The strategy includes an advanced trend filter using 9 different moving average types:
SMA (Simple Moving Average)
EMA (Exponential Moving Average) - Default
WMA (Weighted Moving Average)
HMA (Hull Moving Average)
RMA (Running Moving Average)
LSMA (Least Squares Moving Average)
DEMA (Double Exponential Moving Average)
TEMA (Triple Exponential Moving Average)
VIDYA (Variable Index Dynamic Average)
Default Settings : 50-period EMA for trend identification
Visual Signal System
Entry Markers : Blue triangles (▲) below candles for long entries, Magenta triangles (▼) above candles for short entries
Candle Coloring : Price candles change color based on active signals (Blue = Long, Magenta = Short)
Signal Text : Optional "Long" or "Short" text inside entry triangles (toggleable)
Trend MA : Gray line plotted on main chart for trend reference
Parameter Optimization Examples
DOGE Trading Success (Optimized Parameters) :
Using 45/80/290 MACD settings with 50-period EMA trend filter has shown exceptional results on DOGE:
Performance : Backtesting results showing 29,800% PnL demonstrate the power of proper parameter optimization
Reasoning : DOGE's meme-driven volatility and social sentiment spikes create significant noise with traditional MACD settings
Solution : Very slow parameters (45/80/290) filter out social media-driven price spikes while capturing only major momentum shifts
Optimal Timeframes : 30-minute and 4-hour charts for swing trading opportunities
Result : Exceptionally clean signals with minimal false entries during DOGE's characteristic pump-and-dump cycles
Multi-Crypto Adaptability :
The same optimization principles apply to other major cryptocurrencies:
SUI : Benefits from smoothed parameters due to newer coin volatility patterns
SEI : Requires adjustment for its unique DeFi-related price movements
LINK : Oracle news events create price spikes that benefit from noise filtering
Solana (SOL) : Network congestion events and ecosystem developments need smoothed detection
General Rule : Higher volatility coins typically benefit from very slow MACD parameters (40-50 / 70-90 / 250-300 ranges)
Key Input Parameters
System Type : Choose between Fast, Normal, Safe, or Crossover (Default: Normal)
MACD Fast MA : 12 periods default (no maximum limit, consider 40-50 for crypto optimization)
MACD Slow MA : 26 periods default (no maximum limit, consider 70-90 for crypto optimization)
MACD Signal MA : 9 periods default (now properly utilized, consider 250-300 for crypto optimization)
Trend MA Type : EMA default (9 options available)
Trend MA Length : 50 periods default (no maximum limit)
Signal Display : Both, Long Only, Short Only, or None
Show Signal Text : True/False toggle for entry marker text
Trading Applications
Recommended Use Cases
Momentum Trading : Capitalize on strong directional moves using the color-coded system
Trend Following : Combine MACD signals with trend MA filter for higher probability trades
Scalping : Use "Fast" system type for quick entries in volatile markets
Swing Trading : Use "Normal" or "Safe" system types for longer-term positions
Cryptocurrency Trading : Optimize parameters for individual crypto assets (e.g., 45/80/290 for DOGE, custom settings for SUI, SEI, LINK, SOL)
Market Suitability
Volatile Markets : Forex, crypto, indices (recommend "Fast" system or smoothed parameters)
Stable Markets : Stocks, ETFs (recommend "Normal" or "Safe" system)
All Timeframes : Effective from 1-minute charts to daily charts
Crypto Optimization : Each major cryptocurrency (DOGE, SUI, SEI, LINK, SOL, etc.) can benefit from custom parameter tuning. Consider slower MACD parameters for noise reduction in volatile crypto markets
Alert System
The strategy provides comprehensive alerts for:
Entry Signals : Long and short entry triangle appearances
Exit Signals : Position exit notifications
Color Changes : Individual histogram color alerts
Trend Conditions : Price above/below trend MA alerts
Strategy Parameters
Default Settings
Initial Capital : $1,000
Position Size : 100% of equity
Commission : 0.1%
Slippage : 3 points
Date Range : January 1, 2018 to December 31, 2069
Risk Management (Optional)
Stop Loss : Disabled by default (customizable percentage-based)
Take Profit : Disabled by default (customizable percentage-based)
Short Trades : Disabled by default (can be enabled)
Important Notes and Limitations
Backtesting Considerations
Uses realistic commission (0.1%) and slippage (3 points)
Default position sizing uses 100% equity - adjust based on risk tolerance
Stop-loss and take-profit are disabled by default to show raw strategy performance
Strategy does not use lookahead bias or future data
Risk Warnings
Past performance does not guarantee future results
MACD-based strategies may produce false signals in ranging markets
Consider combining with additional confluences like support/resistance levels
Test thoroughly on demo accounts before live trading
Adjust position sizing based on your risk management requirements
Technical Limitations
Strategy does not work on non-standard chart types (Heikin Ashi, Renko, etc.)
Signals are based on close prices and may not reflect intraday price action
Multiple rapid signals in volatile conditions may result in overtrading
Credits and Attribution
This strategy is based on the original "MACD Liquidity Tracker System" indicator created by TheNeWSystemLqtyTrckr . This strategy version includes significant enhancements:
Complete strategy implementation with entry/exit logic
Addition of the "Crossover" system type
Proper implementation and utilization of the MACD signal line
Enhanced risk management features
Improved parameter flexibility with no artificial maximum limits
Additional alert systems for comprehensive trade management
The original indicator's core color logic and visual system have been preserved while expanding functionality for automated trading applications.

Daily Bias on 5 minutes Reversal StrategyThis strategy combines higher-timeframe bias (daily and 1-hour) with 5-minute reversal signals to identify intraday trades. It aims to capitalize on false breakouts of the previous day's high/low, with strict risk management (Strict position sizing, max risk cap, and R:R enforcement), Avoids Over-Trading (1 trade/day rule prevents chasing), SL buffer adapts to volatility.
#1. This strategy does not utilize indicators. We will use the daily (D) price range and look for breakout attempts and rejections at the extreme points on the lower time frame (1h). If rejection occurs, it establishes our bias (bullish or bearish). For final confirmation, we move to the 5-minute timeframe to observe attempts to retest that daily price range. If significant rejection occurs again, that becomes our entry point.
#2. When rejection occurs, the 1-hour candle may form a new extreme point (low/high). Therefore, we will no longer use the daily price range as our trade exit point but instead the new extreme level established after the breakout attempt and price rejection.
To prevent premature trade exits, we also add an SL buffer using ATR while still capping the maximum acceptable risk per trade (as a percentage). Take profit is calculated using a risk-to-reward ratio, with a default setting of 1.5x.
#3. Key Input Parameters
a. Timeframes :
1. Daily TF ((Anchor for daily high/low (default: D).)
2. 1H Bias TF (Bias confirmation timeframe (default: 60))
3. Execution TF (Entry signal timeframe (default: 5, should match chart).
b. Trade Management
1. SL Buffer ATR Multiplier (Buffer beyond swing low/high (default: 6.0))
2. Min ATR Threshold (Minimum buffer size (default: 1.0))
3. Risk Reward Ratio (TP distance multiplier (default: 1.5))
4. Max Risk Allowed (Max risk % of entry (default: 3.0%))
Lookback Bars for SL Bars for swing low/high (default: 60))
c. Break Thresholds
1. 1H Candle Break Threshold (ATR multiplier for 1H break (default: 0.75))
2. 5M Candle Break Threshold (ATR multiplier for 5M break (default: 0.5))
