EMA/SMA Ribbon Pro (AUTO HTF + Labels)This indicator is a multi-timeframe (MTF) moving average ribbon that dynamically adjusts to the next highest timeframe. It provides a visual representation of market trends by stacking multiple EMAs and SMAs with customizable color fills and labels.
Features
✅ Multi-Timeframe (MTF) Support: Automatically detects the next highest time frame or allows for manual selection
✅ Customizable Moving Averages: Supports EMA and SMA with different lengths for flexible configuration
✅ Ribbon Visualization: Smooth color transitions between different moving averages for better trend identification
✅ Crossover Labels: Detects bullish and bearish EMA/SMA crossovers and marks them on the chart
✅ Price Labels & Timeframe Display: Displays moving average values to the right of the price axis with customizable label padding and colors
How It Works
Select the HTF mode: Manual or automatic
Choose EMA/SMA lengths to create different ribbons
Enable/disable price labels for each moving average
Customize colors and transparency for ribbons and labels
Crossover labels appear when faster moving averages cross slower ones and vice versa
Use Cases
📌 Trend Identification: Identify bullish and bearish trends using multiple EMAs and SMAs
📌 Support & Resistance Zones: MAs can act as dynamic support and resistance levels
📌 Reversal & Confirmation Signals: Watch for MTF crossovers to confirm trend changes
Customization
🔹 Standard EMA Lengths: 6, 8, 13, 21, 34, 48, 100, 200, 300, 400
🔹 SMA Lengths: 48, 100, 200
🔹 Color Adjustments: Set custom colors for bullish/bearish ribbons
🔹 Crossovers: Enable/disable custom crossover pairs (e.g., 100/200 EMA, 200 EMA/SMA).
This indicator is perfect for traders who rely on multi-timeframe confluence while seeking to enhance their market analysis and decision-making process.
As always, by combining EMA/SMA Ribbon with other tools, traders ensure that they are not relying on a single indicator. This layered approach can reduce the likelihood of false signals and improve overall trading accuracy.
As always, be sure to use any indicator with price action and volume indicators for better trade confirmation!
ค้นหาในสคริปต์สำหรับ "mtf"

Enhanced Buy/Sell Pressure, Volume, and Trend Bar analysisEnhanced Buy/Sell Pressure, Volume, and Trend Bar Analysis Indicator
Overview
This indicator is designed to help traders identify buy and sell pressure, volume changes, and overall trend direction in the market. It combines multiple concepts like price action, volume, and trend analysis, candlestick anaysis to provide a comprehensive view of market dynamics. The visual elements are intuitive, making it suitable for traders at different levels. This indicator works together with Enhanced Pressure MTF Screener which is a screener based of this indicator to make it easier to see Bullish/Bearish pressures and trend across multiple timeframes.
Image below: is the Enhanced Buy/Sell Pressure, Volume, and Trend Bar Analysis with the Enhanced Pressure MTF Screener indicator both active together.
Key Features
1.Buy/Sell Pressure Identification
Buy Pressure: Calculated based on price movement where the close price is higher than the opening price.
Sell Pressure: Calculated when the closing price is equal to or lower than the opening price.These pressures help you understand whether buyers or sellers are more dominant for each bar.
2.Volume Analysis
Normalized Volume: Volume data is normalized, making it easier to compare volume levels over different periods.
Volume Histogram: The volume is also presented as a histogram for easy visualization, showing whether the current volume is higher or lower compared to the average.
3.Simplified Coloring Option
You can choose to simplify the coloring of bars to reflect the dominant pressure: green for bullish pressure and red for bearish pressure. This makes it visually easier to identify who is in control. When simplified coloring is disabled, the bars' colors will represent the combined effect of buy and sell pressure.
4.Heikin-Ashi Candles for Pressure Calculation
The indicator includes an option to use Heikin-Ashi candles instead of traditional candles to calculate buy and sell pressure. Heikin-Ashi candles are known for smoothing out price action and providing a clearer trend representation.
5.Trend Background Coloring
This feature uses exponential moving averages (EMAs) to determine the trend:
Short-Term EMA vs. Long-Term EMA: When the short-term EMA is above the long-term EMA, the trend is considered bullish, and vice versa.
The background color changes based on the identified trend: green for an uptrend and red for a downtrend. This feature helps visualize the overall market direction at a glance.
6.Signals for Key Price Actions
The indicator plots various symbols to signal important price movements:
Bullish Close (▲): Indicates a strong upward movement where the close price crosses above the open.
Bearish Close (▼): Indicates a downward movement where the close price falls below the open.
Higher High (•): Highlights new highs compared to previous bars, useful for confirming an uptrend.
Lower Low (•): Highlights lower lows compared to previous bars, which can indicate a downtrend or bearish pressure.
Calculations Explained
1.Buy and Sell Pressure Calculation
The buy pressure is determined by the price range (high - low) if the closing price is above the opening price, indicating an increase in value.
The sell pressure is similarly calculated when the closing price is equal to or below the opening price.
The indicator uses the Average True Range (ATR) for normalization. Normalizing helps you compare pressure across different periods, regardless of market volatility.
2.Volume Normalization
Volume Normalization: To make volume comparable across different periods, the indicator normalizes it using the Simple Moving Average (SMA) of volume over a user-defined length.
Volume Histogram: The histogram provides a clear representation of volume changes compared to the average, making it easier to spot unusual activity that may indicate market shifts.
3.Combined Pressure Calculation
The indicator calculates a combined pressure value by subtracting sell pressure from buy pressure.
When combined pressure is positive, buying is dominant, and when negative, selling is dominant. This helps in visually understanding the ongoing momentum.
4.Trend Calculation
The indicator uses two EMAs to determine the trend:
Short-Term EMA (default 14-period) to capture recent price movements.
Long-Term EMA (default 50-period) to provide a broader trend perspective.
By comparing these EMAs on a higher timeframe, the indicator can identify whether the trend is up or down, making it easier for traders to align their trades with the larger market movement.
Inputs and Customization
The indicator provides several options for customization, allowing you to adjust it to your preferences:
SMA Length: Determines the lookback period for moving averages and volume normalization. A longer length provides more smoothing, whereas a shorter length makes the indicator more responsive.
Buy/Sell/Volume Colors: Customize the colors used to represent buying, selling, and volume to suit your preferences.
Heikin Ashi Option: Toggle between using Heikin Ashi or traditional OHLC (Open-High-Low-Close) candles for pressure calculations.
Trend Timeframe and EMA Periods: You can choose different timeframes and EMA periods for trend analysis to suit your trading strategy.
How to Use This Indicator
Identifying Market Momentum: Use the buy/sell pressure columns to see which side (buyers or sellers) is in control. Positive pressure combined with green color indicates strong buying, while red indicates selling.
Volume Confirmation: Check the volume area plot and histogram. High volume coupled with strong pressure is a sign of conviction, meaning the current move has backing from market participants.
Trend Identification: The trend background color helps identify the overall trend direction. Trade in the direction of the trend (e.g., take long positions during a green background).
Signal Indicators: The plotted symbols like "Bullish Close" and "Bearish Close" provide visual signals of key price actions, useful for timing entry or exit points.
Practical use Example
Scenario: The market is consolidating, and you see alternating green and red bars.
Action: Wait for a consistent sequence of green bars (buy pressure) along with a green background (uptrend) to consider going long, although you can go long without having a green background, the background adds confirmation layer.
Scenario: The market has several bearish closes (red ▼ symbols) accompanied by increasing volume.
Action: This could indicate strong selling pressure. If the background also turns red, it might be a good time to exit long positions or consider shorting.
Higher timeframe pressure and volume: Another way to use the indicator is to check buy/sell volume and pressure of the higher timeframe say weekly or daily or any timeframe you consider higher, once you’ve identified or feel confident in which direction the bar is going along with the full picture of trend, you can go to the lower timeframe and wait for it to sync with the higher timeframe to consider a long or a short. It is also easier to see when markets sync up by also applying the Enhanced Pressure MTF Screener which works in companion to this indicator.
Visual Cues and Interpretation
Combined Pressure Plot: The green and red column plot at the bottom of the chart represents the dominance between buying and selling. Tall green bars signify strong buying, while tall red bars indicate selling dominance.
Trend Background: Helps visualize the overall direction without manually drawing trend lines. When the background turns green, it generally indicates that the shorter-term moving average has crossed above the longer-term average—a sign of a bullish trend.
To Summarize shortly
The Enhanced Buy/Sell Pressure, Volume, and Trend Bar Analysis Indicator is an advanced but simple tool designed to help traders visually understand market dynamics. It combines different aspects of market analysis of candle pressure from buyers and sellers, volume confirmation, and trend identification into a single view, which can assist both new and experienced traders in making informed trading decisions.
This indicator:
Saves time by simplifying market analysis.
Provides clear visual cues for buy/sell pressure, volume, and trend.
Offers customizable settings to suit individual trading styles.
Always, I am happy to share my creations with you all for free. If you guys have cool ideas you would like to share, or suggestions for improvements the comment is below and I hope this overview gave an idea of how to use the indicator :D

UFO + Realtime Divergences (UO x MFI)UFO + Realtime Divergences (UO x MFI) + Alerts
The UFO is a hybrid of two powerful oscillators - the Ultimate Oscillator (UO) and the Money Flow Index (MFI)
Features of the UFO include:
- Optional divergence lines drawn directly onto the oscillator in realtime.
- Configurable alerts to notify you when divergences occur, as well as centerline crossovers.
- Configurable lookback periods to fine tune the divergences drawn in order to suit different trading styles and timeframes.
- Background colouring option to indicate when the oscillator has crossed its centerline.
- Alternate timeframe feature allows you to configure the oscillator to use data from a different timeframe than the chart it is loaded on.
- 2x MTF triple-timeframe Stochastic RSI overbought and oversold confluence signals painted at the top of the panel for use as a confluence for reversal entry trades.
The core calculations of the UFO+ combine the factory settings of the Ultimate Oscillator and Money Flow Index, taking an average of their combined values for its output eg:
UO_Value + MFI_Value / 2
The result is a powerful oscillator capable of detecting high quality divergences, including on very low timeframes and highly volatile markets, it benefits from the higher weighting of the most recent price action provided by the Ultimate Oscillators calculations, as well as the calculation of the MFI, which incorporates volume data. The UFO and its incorporated 2x triple-timeframe MTF Stoch RSI overbought and oversold signals makes it well adapted for low timeframe scalping and regular divergence trades in particular.
The Ultimate Oscillator (UO)
Tradingview describes the Ultimate Oscillator as follows:
“The Ultimate Oscillator indicator (UO) is a technical analysis tool used to measure momentum across three varying timeframes. The problem with many momentum oscillators is that after a rapid advance or decline in price, they can form false divergence trading signals. For example, after a rapid rise in price, a bearish divergence signal may present itself, however price continues to rise. The Ultimate Oscillator attempts to correct this by using multiple timeframes in its calculation as opposed to just one timeframe which is what is used in most other momentum oscillators.”
You can read more about the UO and its calculations here
The Money Flow Index ( MFI )
Investopedia describes the True Strength Indicator as follows:
“The Money Flow Index ( MFI ) is a technical oscillator that uses price and volume data for identifying overbought or oversold signals in an asset. It can also be used to spot divergences which warn of a trend change in price. The oscillator moves between 0 and 100. Unlike conventional oscillators such as the Relative Strength Index ( RSI ), the Money Flow Index incorporates both price and volume data, as opposed to just price. For this reason, some analysts call MFI the volume-weighted RSI .”
You can read more about the MFI and its calculations here
The Stochastic RSI (relating to the built-in MTF Stoch RSI feature)
The popular oscillator has been described as follows:
“The Stochastic RSI is an indicator used in technical analysis that ranges between zero and one (or zero and 100 on some charting platforms) and is created by applying the Stochastic oscillator formula to a set of relative strength index ( RSI ) values rather than to standard price data. Using RSI values within the Stochastic formula gives traders an idea of whether the current RSI value is overbought or oversold. The Stochastic RSI oscillator was developed to take advantage of both momentum indicators in order to create a more sensitive indicator that is attuned to a specific security's historical performance rather than a generalized analysis of price change.”
You can read more about the Stochastic RSI and its calculations here
How do traders use overbought and oversold levels in their trading?
The oversold level, that is when the Stochastic RSI is above the 80 level is typically interpreted as being 'overbought', and below the 20 level is typically considered 'oversold'. Traders will often use the Stochastic RSI at an overbought level as a confluence for entry into a short position, and the Stochastic RSI at an oversold level as a confluence for an entry into a long position. These levels do not mean that price will necessarily reverse at those levels in a reliable way, however. This is why this version of the Stoch RSI employs the triple timeframe overbought and oversold confluence, in an attempt to add a more confluence and reliability to this usage of the Stoch RSI .
What are divergences?
Divergence is when the price of an asset is moving in the opposite direction of a technical indicator, such as an oscillator, or is moving contrary to other data. Divergence warns that the current price trend may be weakening, and in some cases may lead to the price changing direction.
There are 4 main types of divergence, which are split into 2 categories;
regular divergences and hidden divergences. Regular divergences indicate possible trend reversals, and hidden divergences indicate possible trend continuation.
Regular bullish divergence: An indication of a potential trend reversal, from the current downtrend, to an uptrend.
Regular bearish divergence: An indication of a potential trend reversal, from the current uptrend, to a downtrend.
Hidden bullish divergence: An indication of a potential uptrend continuation.
Hidden bearish divergence: An indication of a potential downtrend continuation.
How do traders use divergences in their trading?
A divergence is considered a leading indicator in technical analysis , meaning it has the ability to indicate a potential price move in the short term future.
Hidden bullish and hidden bearish divergences, which indicate a potential continuation of the current trend are sometimes considered a good place for traders to begin, since trend continuation occurs more frequently than reversals, or trend changes.
When trading regular bullish divergences and regular bearish divergences, which are indications of a trend reversal, the probability of it doing so may increase when these occur at a strong support or resistance level . A common mistake new traders make is to get into a regular divergence trade too early, assuming it will immediately reverse, but these can continue to form for some time before the trend eventually changes, by using forms of support or resistance as an added confluence, such as when price reaches a moving average, the success rate when trading these patterns may increase.
Typically, traders will manually draw lines across the swing highs and swing lows of both the price chart and the oscillator to see whether they appear to present a divergence, this indicator will draw them for you, quickly and clearly, and can notify you when they occur.
Setting alerts.
With this indicator you can set alerts to notify you when any/all of the above types of divergences occur, on any chart timeframe you choose.
Configurable pivot period.
You can adjust the default pivot lookback values to suit your prefered trading style and timeframe. If you like to trade a shorter time frame, lowering the default lookback values will make the divergences drawn more sensitive to short term price action.
Disclaimer: This script includes code from the stock UO and MFI by Tradingview as well as the Divergence for Many Indicators v4 by LonesomeTheBlue.

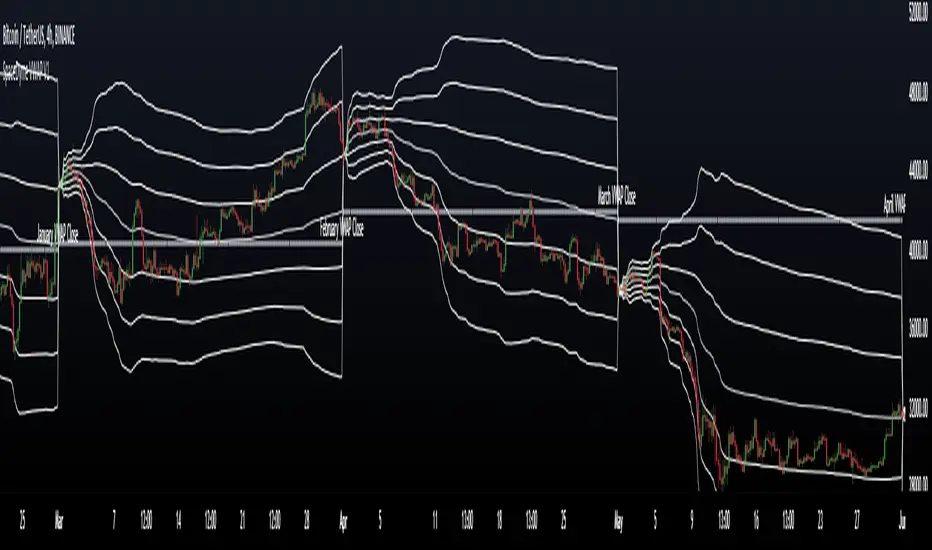
VWAP Suite█ OVERVIEW
This indicator is an attempt to bring all VWAP functionalities under one umbrella suite, the existing VWAPs are great and this was made to provide all functionalities. (pending more updates as well)
█ FEATURES
Multiple VWAPs MTF
Individual Band configuration
Previous vwap closes
Date tracking of previous closes
MTF Options
Enabling the other VWAPS with any timeframe will allow the user to use the "VWAP Anchor" setting to choose what HTF Vwap to be displayed
"Prev Close"
This setting enables all historical closes to be displayed with extension
"Track Dates"
Can be used to keep date information of 2 previous closes and further back
█ HOW TO USE IT
The indicator is quite straight forward in its application, as you would expect of a normal VWAP.
At the top of the settings pane the indicator has some functionality that would control the VWAPs globally, e.g. disabling show bands disables all bands for all the VWAPs.
Each VWAP has individual settings that can be controlled such as coloring, which bands enabled, previous closes, labelling...
█ SUGGESTION
My suggestion for clarity is to use 1 VWAP with bands, and a 2nd with no bands + Previous close enabled at a higher timeframe
█ LIMITATIONS OF PINE (Please read)
I see many users going on different indicators with MTF in mind and trying to use it for LTF data e.g. 1hour chart, and selecting 5min in chart settings.
This is not recommended by the team themselves and should be noted for use always use HTF: www.tradingview.com
To understand how to use VWAP please refer to some education that can be found for free online
Heres an example of a trader using the tool himself: www.youtube.com
█ Future Updates:
Previous Close Line extensions
Previous Highs and Lows of VWAP mapped out for users
Suggestions Welcome!
Adaptive Ehlers Deviation Scaled Moving Average (AEDSMA)AEDSMA INTRODUCTION
This indicator is a functional enhancement to “Ehlers Deviation Scaled Moving Average (EDSMA / DSMA)”. I’ve used Volume Breakout and Volatility for dynamic length adaption and further Slope too for trend evaluation.
EDSMA was originally developed by John F. Ehlers (Stocks & Commodities V. 36:8: The Deviation-Scaled Moving Average).
IDEA PLACEMENT
I’ve traded almost every kind of market with different volatility conditions using Moving Averages. It was too much of a hassle to select and use different MA length depending upon market trend. So, the journey started with adapting Moving Averages with another parameter and that’s how “MZ SAMA ” came into being where Slope was used to adapt Adaptive Moving Average with trend change. The problem was still pretty much the same as SAMA might not be effective on every market condition. Hence, I worked on Volume to adapt Moving Averages accordingly. I cane up with “MZ RVSI ” which I used in “MZ DVAMA ” to adapt dynamic length in Adaptive Moving Average and also used “MZ RVSI " alongside Slope as confirmation of trend changes.
Meanwhile, I started using DVAMA methodology on different types on Moving Averages that allow dynamic length for example Hull Moving Average, Linear Regression Curve, SMA, WMA, TMA and many more. All of my tested Mas showed too much flexibility because of volume based Adaptive length.
I came across a script of “Adaptive Hull Moving Average” which pretty much used the similar methodology as DVAMA but when I looked into its depth, its volume oscillator wasn’t working at all and only volatility based dynamic length was used. It was an interesting idea so, I decided to use Volume and Volatility alongside for better results but was nearly impossible to achieve what I wanted using only Hull Moving Average.
I had been using EDSMA in “MA MTF Cross Strategy” and “MZ SRSI Strategy V1.0” previously. It was the perfect choice when comparing to usage of slope on it. DSMA works perfectly as support and resistance as its Deviation Scaled. So, I tried using it to adapt dynamic length based on Volume and Volatility and I wasn’t disappointed. It worked like a charm when I adapted dynamic length between 50 and 255.
DYNAMIC LENGTH BENEFITS
Dynamic length adaption methodology works in a way of adapting Relatively Lower Length leading toward overfitting if trend is supported by Volume and Volatility . Similarly, adapting Relatively Higher Length leading toward underfitting if trend isn’t supported by Volume and Volatility .
Dynamic length adaption makes Moving Average to work better for both Bull and Bear-runs avoiding almost every fake break-in and breakouts. Hence, adaptive MA becomes more reliable for breakout trading.
MA would be more useful as it would adapt almost every chart based on its Volume and Volatility data.
DYNAMIC COLORS AND TREND CORRELATION
I’ve used dynamic coloring to identify trends with more detail which are as follows:
Lime Color: Strong Uptrend supported by Volume and Volatility or whatever you’ve chosen from both of them.
Fuchsia Color: Weak uptrend only supported by Slope or whatever you’ve selected.
Red Color: Strong Downtrend supported by Volume and Volatility or whatever you’ve chosen from both of them.
Grey Color: Weak Downtrend only supported by Slope or whatever you’ve selected.
Yellow Color: Possible reversal indication by Slope if enabled. Market is either sideways, consolidating or showing choppiness during that period.
SIGNALS
Green Circle: Market good for long with support of Volume and Volatility or whatever you’ve chosen from both of them.
Red Circle: Market good to short with support from Volume and Volatility or whatever you’ve chosen from both of them.
Yellow Cross: Market either touched top or bottom ATR band and can act as good TP or SL.
EDSMA EVELOPE/BANDS: I’ve included ATR based bands to the Adaptive EDSMA which act as good support/resistance despite from main Adaptive EDSMA Curve.
DEFAULT SETTINGS
I’ve set default Minimum length to 50 and Maximum length to 255 which I’ve found works best for almost all timeframes but you can change this delta to adapt your timeframe accordingly with more precision.
Dynamic length adoption is enabled based on both Volume and Volatility but only one or none of them can also be selected.
Trend signals are enabled based on Slope and Volume but Volatility can be enabled for more precise confirmations.
In “ RVSI ” settings TFS Volume Oscillator is set to default but others work good too especially Volume Zone Oscillator. For more details about Volume Breakout you can check “MZ RVSI Indicator".
ATR breakout is set to be positive if period 14 exceeds period 46 but can be changed if more adaption with volatility is required.
EDSMA super smoother filter length is set to 20 which can be increased to 50 or more for better smoothing but this will also change slope results accordingly.
EDSMA super smoother filter poles are set to 2 because found better results with 2 instead of 3.
FURTHER ENHANCEMENTS
So far, I’ve seen better results with Volume Breakout and Volatility but other parameters such as Linear Slope of Particular MA, MACD, “MZ SRSI ”, a Conditional Uptrend MA or simply KDJ can also be used for dynamic length adaption.
I haven't yet gotten used to pine script arrays so, defining and using conditional operators is pretty much lazy programming for me. Would be great redefining everything through truth matrix instead of using if-else conditions.

Precise_SignalThis signal combines a portion of Chris Moody's 2014 SlingShot and my 2017 MTF Indicators. Both of our prior scripts over indicated Buy and Sell Points. This signal indicates a buy or sell point much less than our prior scripts did but with absolute precision.
I would say it is 100% accurate, but that is because I am yet to find a timeframe and symbol where the Buy signal failed to see the equity move up or the Sell signal failed to see the equity move down over the next 5 bars. I have tested 2000 charts so far. To be safe, I would rather state this indicator is accurate nearly 100% of the time.
The indicator is made up of 2 main portions and both of them have to agree on a buy or sell in order to indicate such with a vertical green or maroon bar beneath the chart. If there is a failure to agree, nothing is signaled.
Indicator 1 combines a stochastic of a 3 hour chart and a daily chart to determine when the stochastics are in agreement on direction. When there is agreement, both of them MUST cross from a buy state to a sell state and vice versa at exactly the same time. This is difficult to achieve and it is already rare for this occurrence to produce a signal. When a signal is produce it is combine with Chris Moody's 2014 SlingShot Indicator which conservatively determines Buy and Sell signals based on EMAs and market direction. Signals from his SlingShot are infrequent.
BUY Signal
When my MTF signals Buy at the same time that the SlingShot signals a Buy, a vertical green bar will appear in the window containing this script. The vertical bar is based on the close price of the equity and is only final when the close price is final. A BUY signal means the equity will move up potentially as early as the next bar and achieve a higher value from the close price on the signal bar.
SELL Signal
Likewise, a sell signal from the MTF at the same time as a sell signal from the SlingShot will create a maroon bar in the window containing this script. The vertical bar is based on the close price of the equity and is only final when the close price is final. A SELL signal means the equity will move down potentially as early as the next bar and achieve a lower value from the close price on the signal bar.
The default values for this script are hard-coded into this script. You can edit any of the value you would like to play with other timeframes, stochastic, and moving average lengths.
I have played with these values and have hard-coded the ones that are most accurate. Please let me know if you find others that work.
Hopefully this becomes an extra tool in your technical trading toolkit.

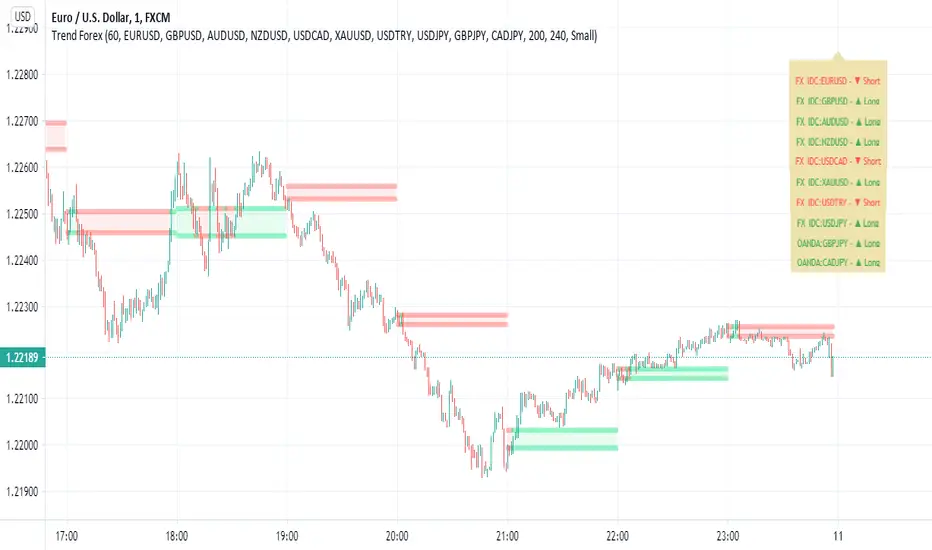
Trend Forexby request of a friend I just made this fast
using screen script taken from
this is a helper for those who play forex
it set on 1 hour non repainting candles MTF
we use it on 1-5 min chart.
you can play with the MTF to be 30 min or lower /higher etc
control of xcreen is by F for height (set to 240 min) you can change to other
its just for fast screening of things you like to see faster/ i suggest to attach to it other indicator if you plan to use it to make decision better
30 min mtf candles on 1 min chart
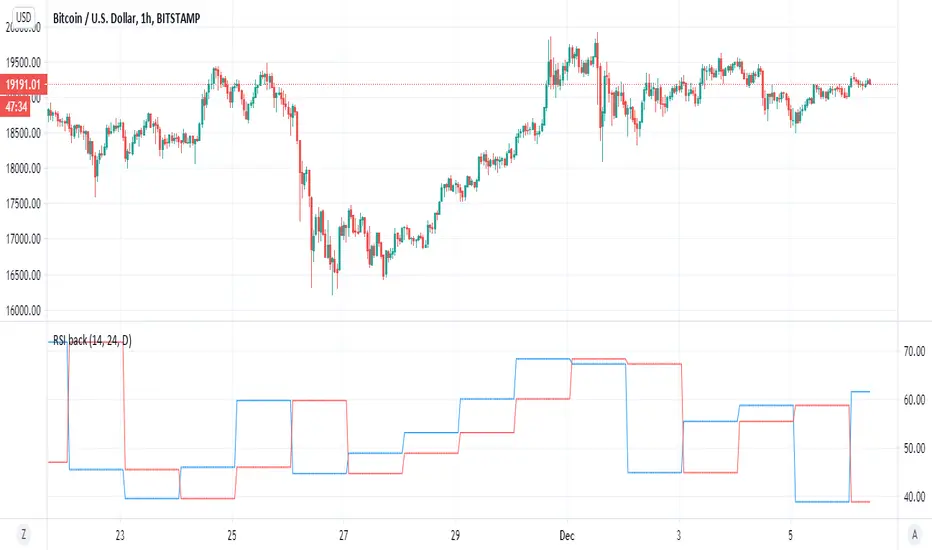
RSI backsimple indicator that based on difference between current RSI and past RSI (historic)
so lets say if take 1 hour chart then in a day there are 24 hour
so our RSI back if we put close will be the rsi of 24 hour before and this we compare it to the current rsi
if the current is above the past one then the signal is bullish , and vice versa. (similar logic to system of buy that based on close yesterday compare open of today)
so to this logic we can add no security MTF to make it nicer
blue line is current MTF RSI , red line is historic RSI based on the number of candles we choose
when blue over red is bullish ,red over blue is bearish
same on 4 hour mTF '1 hour chart and 24 candle back
Candles Trend 1ok so i republish this indicator again. first version had some repaint issue so it been removed
here the script does not suppuse to have this issue
so it basic 1 day MTF candles over 1 week MTF candles
blue color is bullish , orange is berrish
the signal and alert are produced by the crossing of the daily over the weekly close (in the case of the weekly it non security type of MTF.
for stocks I use 1 week over 1 month MTF on lower TF
Security issuesource of code of no repaint by Duyck
source of code fix by i Think Quansium ( please correct me if i am wrong) ,great reading I have to say
please read what he suggest . i try his way but sadly it did not work as i wish . that why i change to this soulution
docs.google.com
Here i just took the great work of this two folks (amazing geniuses)
and try to combine them so the non repaint, no security source of the close MTF will look exact as the repaint one.
so this soultion try to create realible source with no security that look exact as the repaint source with the security
all thanks to the above authors
I just put here so maybe someone in the TV comunity move forward the issue how to fix the security issue
and by that we can create great indicators if it fix
so the no repaint named no security (red color)
repaint is green color
as you see they aligh very nice with no different
sadly if I try to put barmerge on this solution does not work (need to find why??)
so maybe you have better solutions?
I hope thios would help coders to make better MTF until TV fix the issue with security

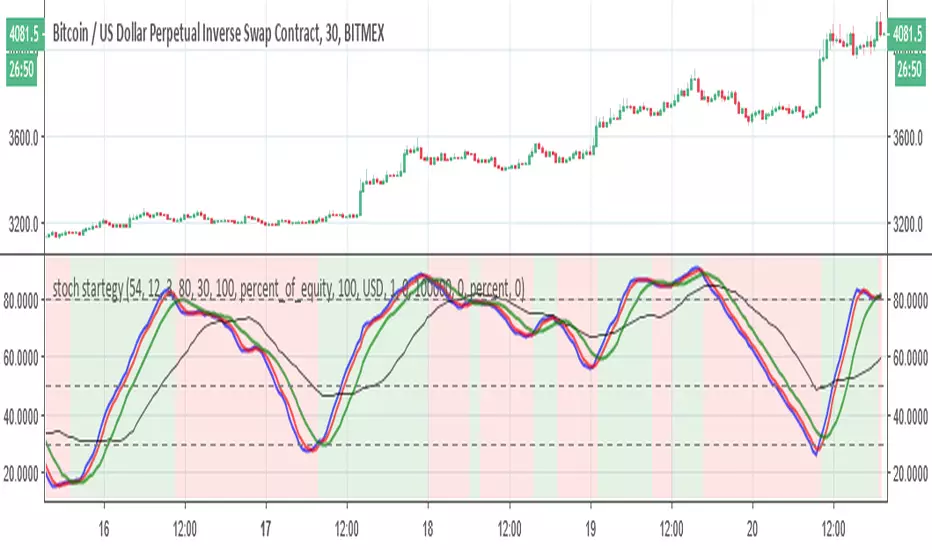
stoch startegyStoch strategy that try to buy in uptrend and to sell in low trend
the bearish and bullish zones are based on regular K stoch over MTF D (3X or timeX3) and vice versa .
The buy and sell rule based on conditions
2- when mtf stochastic cross above 50 and current is rising, buy
3- when mtf stochastic cross bellow 50 and current isfalling, sell
the main script was written by
03.freeman
I just change some settings to improve it
VolumeS as stochv1just to show a concept . I use volume S to make it as stoch and add to it MTF function
B=buy
S=sell
D=down
if you do not like the MTF fuction just remove it from code or put the time frame of graph to be exact as MTF one
I did not add alert as it just a concept idea , to make it more complex it easy if you add more indicators to it and then compare the signals
have fun

Accurate Swing Trading + Support Resistance MTF (EN)Swing trading setup based on volume and support restistance. use buy main signal for large trend change and for swing trade use buy

Liqudity Magnets [Zofesu]Liquidity Magnets is a high-precision institutional-grade tool designed to identify where large market participants place their orders. Instead of looking at basic support and resistance, this indicator focuses on Liquidation Levels and Stop-Loss cluster s, which act as "magnets" for price action.
🧠 The Concept
Markets move from one pocket of liquidity to another. Retail traders often place their stop-losses just above or below recent Swing Highs/Lows. Professional players and algorithms target these areas to fill their large orders (Stop-hunting) .
This indicator uses a Multi-Timeframe (MTF) approach to detect these critical zones based on leverage psychology:
🧲 Yellow Lines (4%) : Near-term liquidity/stop-loss clusters. Common targets for intraday sweeps.
💰 Red/Green Lines (10%): Major liquidation zones. These represent areas where high-leverage positions (10x) face forced liquidations, often leading to massive trend exhaustion and reversals.
🛠️ How it works
📊 MTF Liquidity Projection: The indicator automatically projects levels from a higher timeframe (Default: 4h) to ensure you are looking at significant market structure.
🎯 Filtered Stop-Run Signals (▲/▼): Grey triangles appear only when the price successfully "sweeps" a high/low AND penetrates deep enough into the liquidity pool. This filters out market noise.
🌑 Stealth Bar Coloring: Candles turn black/dark when a sweep is in progress, providing a clear visual cue that the market is currently "hunting" liquidity.
⚙️ Settings Guide
🕒 Select TF: Choose the anchor timeframe for magnets (Recommended: 240 for 4h).
🔍 Lookback: Sets the period for detecting the most relevant Swing Highs and Lows.
📏 Line Length: Controls how many bars the magnet lines extend into the future.
📈 Signal Sensitivity %: * 0%: Shows every minor sweep.
100%: Only triggers if price reaches the 4% magnet line exactly.
🎨 Color Settings: Fully customizable colors to fit any chart theme (Dark/Light).
💡 Trading Strategy
For the best results, look for the "Sweep & Reject" play:
1. Price enters a Magnet Line (Yellow or Red/Green).
2. A Stop-Run Triangle appears.
3. Wait for the price to reject the level and close back inside the previous range.
⚠️ Note
This script uses dark bar-coloring for sweep detection. If you are using a Dark Theme, ensure your candle borders are visible or adjust the Barcolor settings in the script inputs. On TF-H4 you can also use H1, you will see the channel in which the price moves and hits the lines, it is recommended to watch green and red there. Good use on titles like gold, silver - significant movements. Experiment.
For any questions or setup assistance, feel free to check my profile signature or better send me a private message here on TV!

Volume Weighted Intra Bar LR KurtosisThis indicator analyzes market character by decomposing total
Excess Kurtosis ("Fat Tails") of a SINGLE BAR into four distinct,
interpretable components based on a Linear Regression model.
Key Features:
1. **Intra-Bar LR Kurtosis Decomposition:** For each bar on the chart,
the indicator analyzes the underlying price action on a smaller
timeframe ('Intra-Bar Timeframe'). It fits a Linear Regression
line through the intra-bar data to decompose the 4th Moment:
- **Trend Kurtosis (Gold):** Peakedness of the regression line
itself. High values indicate the price path within the bar
moves in sudden jumps, steps, or gaps (discontinuous path).
- **Residual Kurtosis (Red):** Excess Kurtosis of the noise
around the regression line. Captures "Hidden Tail Risk" or
extreme outliers within the bar relative to the trend.
- **Within-Bar Kurtosis (Blue):** Fat tails derived from the
microstructure of individual intra-bar candles.
- **Interaction Variance (Dark Grey):** The comovement of variance
and mean deviations (volatility clustering relative to trend).
- **Interaction Skewness (Darker Grey):** The comovement of skewness
and mean deviations (asymmetry relative to trend).
2. **Visual Decomposition Logic:** Total Excess Kurtosis is the
primary metric displayed. Since statistical moments are additive,
this indicator calculates the *exact* Total Kurtosis and partitions
the columns based on the Law of Total Moments.
3. **Dual Display Modes:** The indicator offers two modes to
visualize this decomposition:
- **Absolute Mode:** Plots the *total* kurtosis as a
stacked column chart. Stacking logic groups components to
ensure visual clarity of the magnitude.
- **Relative Mode:** Plots the direct *contribution ratio*
(proportion) of each component relative to the total sum,
ideal for identifying the dominant driver (Trend vs. Noise).
4. **Calculation Options:**
- **Normalization:** An optional 'Normalize' setting
transforms inputs into logarithmic space, analyzing the
kurtosis of *returns* rather than absolute prices.
- **Volume Weighting:** An option (`Volume weighted`) applies
volume weighting to all regression and moment calculations,
emphasizing high-participation moves.
5. **Kurtosis Cycle Analysis:**
- **Pivot Detection:** Includes a built-in pivot detector
that identifies significant turning points (peaks/valleys) in
the *total* kurtosis line. (Note: This is only visible
in 'Absolute Mode').
- **Flexible Pivot Algorithms:** Supports various underlying
mathematical models for pivot detection provided by the
core library.
6. **Note on Confirmation (Lag):** Pivot signals are confirmed
using a lookback method. A pivot is only plotted *after*
the `Pivot Right Bars` input has passed, which introduces
an inherent lag.
7. **Multi-Timeframe (MTF) Capability:**
- **MTF Analysis Lines:** The entire intra-bar analysis can be
run on a higher timeframe (using the `Timeframe` input),
with standard options to handle gaps (`Fill Gaps`) and
prevent repainting (`Wait for...`).
- **Limitation:** The Pivot detection (`Calculate Pivots`) is
**disabled** if a Higher Timeframe (HTF) is selected.
8. **Integrated Alerts:** Includes comprehensive alerts for:
- Kurtosis magnitude (High Positive / High Negative).
- Character changes (Trend Jumps vs. Noise Outliers).
- Total Kurtosis pivot (High/Low) detection.
**Caution: Real-Time Data Behavior (Intra-Bar Repainting)**
This indicator uses high-resolution intra-bar data. As a result, the
values on the **current, unclosed bar** (the real-time bar) will
update dynamically as new intra-bar data arrives. This behavior is
normal and necessary for this type of analysis. Signals should only
be considered final **after the main chart bar has closed.**
---
**DISCLAIMER**
1. **For Informational/Educational Use Only:** This indicator is
provided for informational and educational purposes only. It does
not constitute financial, investment, or trading advice, nor is
it a recommendation to buy or sell any asset.
2. **Use at Your Own Risk:** All trading decisions you make based on
the information or signals generated by this indicator are made
solely at your own risk.
3. **No Guarantee of Performance:** Past performance is not an
indicator of future results. The author makes no guarantee
regarding the accuracy of the signals or future profitability.
4. **No Liability:** The author shall not be held liable for any
financial losses or damages incurred directly or indirectly from
the use of this indicator.
5. **Signals Are Not Recommendations:** The alerts and visual signals
(e.g., crossovers) generated by this tool are not direct
recommendations to buy or sell. They are technical observations
for your own analysis and consideration.

Volume Weighted Intra Bar KurtosisThis indicator analyzes market sentiment by providing a detailed
view of Excess Kurtosis ("Fat Tails"). It uses data from a lower,
intra-bar timeframe to separate the total kurtosis of a single bar
into distinct, interpretable components.
Key Features:
1. **Intra-Bar Kurtosis Decomposition:** For each bar on the chart,
the indicator analyzes the underlying price action on a smaller
timeframe ('Intra-Bar Timeframe'). Unlike Variance, the Fourth
Central Moment (Kurtosis) decomposes into three parts:
- **Between-Bar Kurtosis (Gold):** Peakedness of the price
path *between* the intra-bar candles. High values indicate
that the macro movement happened in jumps or gaps rather
than a smooth progression.
- **Within-Bar Kurtosis (Blue):** Fat tails derived from the
microstructure (extreme wicks) *inside* the intra-bar candles.
- **Interaction Variance (Dark Grey):** The comovement of variance
and mean deviations (volatility clustering relative to trend).
- **Interaction Skewness (Darker Grey):** The comovement of skewness
and mean deviations (asymmetry relative to trend).
2. **Visual Decomposition Logic:** Total Excess Kurtosis is the
primary metric displayed. Since Kurtosis coefficients are not
linearly additive, this indicator calculates the *exact* Total
Kurtosis and partitions the columns based on the additive
Fourth Moment Decomposition (`M4Tot = M4Btw + M4Wtn + M4Int`).
3. **Dual Display Modes:** The indicator offers two modes to
visualize this information:
- **Absolute Mode:** Plots the *total* kurtosis as a
stacked column chart, showing the *absolute magnitude* of
tail risk and the contribution of each component.
- **Relative Mode:** Plots the components as a 100% stacked
column chart (scaled from 0 to 1), focusing purely on the
*energy ratio* of the components.
4. **Calculation Options:**
- **Normalization:** An optional 'Normalize' setting
calculates an **Exponential Regression Curve** (log-space),
making the analysis suitable for comparing assets with
different scales (e.g., BTC vs EURUSD).
- **Volume Weighting:** An option (`Volume weighted`) applies
volume weighting to all mean and moment calculations.
5. **Kurtosis Cycle Analysis:**
- **Pivot Detection:** Includes a built-in pivot detector
that identifies significant turning points (peaks/valleys) in
the *total* kurtosis line. (Note: This is only visible
in 'Absolute Mode').
- **Flexible Pivot Algorithms:** Supports various underlying
mathematical models for pivot detection provided by the
core library.
6. **Note on Confirmation (Lag):** Pivot signals are confirmed
using a lookback method. A pivot is only plotted *after*
the `Pivot Right Bars` input has passed, which introduces
an inherent lag.
7. **Multi-Timeframe (MTF) Capability:**
- **MTF Analysis Lines:** The entire intra-bar analysis can be
run on a higher timeframe (using the `Timeframe` input),
with standard options to handle gaps (`Fill Gaps`) and
prevent repainting (`Wait for...`).
- **Limitation:** The Pivot detection (`Calculate Pivots`) is
**disabled** if a Higher Timeframe (HTF) is selected.
8. **Integrated Alerts:** Includes alerts for:
- Kurtosis magnitude (High Positive / High Negative).
- Kurtosis character changes/emerging/fading.
- Total Kurtosis pivot (High/Low) detection.
**Caution: Real-Time Data Behavior (Intra-Bar Repainting)**
This indicator uses high-resolution intra-bar data. As a result, the
values on the **current, unclosed bar** (the real-time bar) will
update dynamically as new intra-bar data arrives. This behavior is
normal and necessary for this type of analysis. Signals should only
be considered final **after the main chart bar has closed.**
---
**DISCLAIMER**
1. **For Informational/Educational Use Only:** This indicator is
provided for informational and educational purposes only. It does
not constitute financial, investment, or trading advice, nor is
it a recommendation to buy or sell any asset.
2. **Use at Your Own Risk:** All trading decisions you make based on
the information or signals generated by this indicator are made
solely at your own risk.
3. **No Guarantee of Performance:** Past performance is not an
indicator of future results. The author makes no guarantee
regarding the accuracy of the signals or future profitability.
4. **No Liability:** The author shall not be held liable for any
financial losses or damages incurred directly or indirectly from
the use of this indicator.
5. **Signals Are Not Recommendations:** The alerts and visual signals
(e.g., crossovers) generated by this tool are not direct
recommendations to buy or sell. They are technical observations
for your own analysis and consideration.

Smart SafeZone Stops [MarkitTick]💡 This script represents a sophisticated evolution of volatility-based trailing stop methodologies. It is designed to assist traders in managing trend-following positions by dynamically adjusting stop-loss levels based on market noise, directional momentum, and volume flows. Unlike static trailing stops that move by a fixed percentage or simple ATR multiples, this tool calculates the "safe zone" by analyzing how far price has penetrated against the trend over a specific lookback period, offering a granular approach to risk management that adapts to changing market conditions.
✨ Originality and Utility
The primary utility of this indicator lies in its ability to filter out market noise while remaining tight enough to protect profits during strong trends. While the classic SafeZone concept (popularized by Dr. Alexander Elder) is effective, this script introduces several modern enhancements that increase its robustness:
● Dynamic ADX Integration Standard SafeZone stops use a fixed multiplier. This script integrates the Average Directional Index (ADX) to gauge trend strength. When the trend is strong, the stop tightens (Aggressive Multiplier) to lock in profits rapidly. When the trend is weak or choppy, the stop widens (Conservative Multiplier) to prevent premature shakeouts. ● Volume-Weighted Noise Price movement on low volume is often considered "noise," while high-volume movement signifies conviction. This script optionally weights the noise calculation by Relative Volume. A downward spike on low volume will affect the stop level less than a downward spike on high volume.
● 3-Day Smoothing Mechanism To prevent the stop line from becoming too jagged or reacting to single-bar anomalies, the script applies a 3-day smoothing algorithm. It utilizes the "worst-case" scenario of the last three calculated stop levels, ensuring the stop only moves when the trend structure genuinely shifts.
🔬 Methodology and Concepts
The underlying logic operates on a "Ratchet" mechanism, meaning the stop line can only move in the direction of the trade (up for longs, down for shorts) and never retraces until a trend reversal occurs.
● Directional Noise Calculation The script separates market noise into two components: Downside Penetration (for Longs): The distance the price dips below the previous bar's low. Upside Penetration (for Shorts): The distance the price spikes above the previous bar's high. The average of these penetrations is calculated over the Noise Lookback Period .
● The SafeZone Formula The raw stop level is derived as follows: Long Stop = Previous Low - (Average Downside Noise × Multiplier) Short Stop = Previous High + (Average Upside Noise × Multiplier)
● Adaptive Multiplier Logic If Dynamic ADX is enabled: If ADX > Strong Threshold: Use Aggressive Multiplier (e.g., 1.5x). If ADX < Weak Threshold: Use Conservative Multiplier (e.g., 3.5x). Otherwise: Use the Base Safety Coefficient.
● Exhaustion Detection The script calculates the distance between the current Close price and the Active Stop. If this distance exceeds a specific multiple of the ATR (Average True Range), it flags a "Mean Reversion" or "Exhaustion" warning, suggesting price has extended too far from equilibrium.
🎨 Visual Guide
The indicator plots distinct visual elements to guide decision-making without cluttering the chart excessively.
● Trailing Stop Lines Green Line (Solid): Represents the SafeZone Long Stop. This line appears below price during an uptrend. As long as price closes above this line, the bullish bias is intact. Red Line (Solid): Represents the SafeZone Short Stop. This line appears above price during a downtrend. A close above this line signals a potential short exit or reversal.
● Trend Signals Green Triangle (Below Bar): Marks the "Bull Start." This occurs when the price crosses above the Trend Filter EMA and the trend logic flips to bullish. Red Triangle (Above Bar): Marks the "Bear Start." Indicates the start of a downtrend sequence.
● Exhaustion Warnings Yellow Labels (⚠️): These appear when price has extended significantly away from the stop line (based on the ATR Exhaustion Multiplier). This is not an immediate sell signal but a warning that the trend may be overextended and a pullback is probable.
● MTF Consensus Cloud Background Color: If enabled, the chart background changes color to reflect the Higher Timeframe (HTF) trend. Green Background: Current trend matches HTF Uptrend. Red Background: Current trend matches HTF Downtrend. Gray Background: Trends are mismatched (Consolidation/Conflict).
● Quantitative Dashboard A table located in the top-right corner displays real-time statistics: Trend: Current state (BULLISH/BEARISH). Age: Number of bars since the trend began. Stop Price: Exact price level of the trailing stop. Risk %: The percentage distance from the current Close to the Stop. If this exceeds 3%, the text turns red to highlight elevated risk. Active Mult: The current multiplier being used (Dynamic or Fixed). ADX State: Shows if the trend is Strong, Weak, or Normal.
📖 How to Use
1. Entry Timing Wait for a Trend Switch signal (Triangle). For a long entry (Green Triangle), ensure the price is above the Trend Baseline (EMA). Ideally, look for confluence with the MTF Cloud (Green Background).
2. Position Management Once in a trade, use the Trailing Stop Line as your hard exit or invalidation point. Do not manually move the stop away from price; the script automatically "ratchets" the stop tighter as the trend progresses.
3. Taking Profits Use the "Exhaustion Warnings" (⚠️) as opportunities to scale out of positions. When price moves parabolically away from the stop line, the probability of a snap-back increases.
4. Managing Chop If the dashboard shows "ADX State: WEAK," expect the stop line to remain wider. This allows the asset "room to breathe" without stopping you out on random volatility.
⚙️ Inputs and Settings
The script is highly customizable to fit different asset classes (Crypto, Forex, Stocks).
● Trend Definitions Trend Filter (EMA Length): Determines the baseline trend bias (Default: 22). Price must be above this EMA to initiate a long calculation.
● Noise Calculation Noise Lookback Period: The number of bars used to calculate average penetration (Default: 10). Base Safety Coefficient: The standard multiplier applied to the noise average (Default: 2.5). Higher values = wider stops. Use Volume Weighting: Enables the volume-adjustment logic. Use 3-Day Smoothing: Recommended keeping this TRUE to avoid stop-hunts.
● Dynamic Multiplier (ADX) Enable Dynamic ADX: Toggles the adaptive multiplier. Strong/Weak Thresholds: The ADX levels that trigger aggressive or conservative multipliers.
● Multi-Timeframe Consensus Higher Timeframe: Select the TF for the cloud background (e.g., Daily or Weekly).
● Exhaustion Warning ATR Multiplier: Defines how far price must be from the stop to trigger a warning (Default: 3.0).
🔍 Deconstruction of the Underlying Scientific and Academic Framework
The "Smart SafeZone" indicator is grounded in the statistical analysis of market noise versus signal.
● Theory of Noise Penetration Conventional stops often use Standard Deviation (Bollinger Bands) or Average True Range (Keltner Channels/Chandelier Stops). While effective, these measures assume volatility is symmetrical. This script adopts the view that directional volatility matters more. In an uptrend, upside volatility is "good" signal, while downside volatility is "noise." By explicitly calculating the average downside penetration (Low - Low), the script isolates the specific counter-trend force acting on the asset. ● Volume-Weighted Price Analysis (VWPA) The inclusion of volume weighting draws upon Dow Theory principles, which state that volume must confirm the trend. Math: Penetration × (Volume / AverageVolume) This formula asserts that a price drop on low volume is statistically less significant than a drop on high volume. By dampening the impact of low-volume moves, the stop becomes more resistant to liquidity vacuums and algorithmic stop-hunts.
● Trend Efficiency (ADX) The integration of J. Welles Wilder’s ADX (Average Directional Index) adds a dimension of Trend Efficiency. High ADX values indicate a highly efficient trend with little retracement. Mathematically, this justifies a lower standard deviation (or noise multiplier) for the stop, as the probability of a deep retracement without a trend change is lower in high-momentum environments.
⚠️ Disclaimer
All provided scripts and indicators are strictly for educational exploration and must not be interpreted as financial advice or a recommendation to execute trades. I expressly disclaim all liability for any financial losses or damages that may result, directly or indirectly, from the reliance on or application of these tools. Market participation carries inherent risk where past performance never guarantees future returns, leaving all investment decisions and due diligence solely at your own discretion.

Volume Weighted LR KurtosisThis indicator analyzes market character by decomposing total
Excess Kurtosis ("Fat Tails") into four distinct, interpretable
components based on a Linear Regression model.
Key Features:
1. **Four-Component Kurtosis Decomposition:** The indicator
separates market tail risk based on the 'Estimate Bar Statistics' option.
It leverages the Law of Total Moments to provide an additive
breakdown of the 4th Statistical Moment:
- **Trend Kurtosis (Gold):** Peakedness of the regression line
itself. High values indicate the trend moves in sudden jumps,
steps, or gaps (discontinuous path).
- **Residual Kurtosis (Red):** Excess Kurtosis of the noise
around the regression line. This captures the "Hidden Tail Risk"
(extreme outliers relative to the trend).
- **Within-Bar Kurtosis (Blue):** Fat tails derived from the
microstructure of individual bars (requires 'Estimate Bar Statistics').
- **Interaction Variance (Dark Grey):** The comovement of variance
and mean deviations (volatility clustering relative to trend).
- **Interaction Skewness (Darker Grey):** The comovement of skewness
and mean deviations (asymmetry relative to trend).
2. **Visual Decomposition Logic:** Total Excess Kurtosis is the
primary metric displayed. Since statistical moments are additive,
this indicator calculates the *exact* Total Kurtosis and partitions
the area to visualize the contribution (weight) of each
structural source to the overall tail risk.
3. **Dual Display Modes:** The indicator offers two modes to
visualize this decomposition:
- **Absolute Mode:** Displays the *total* kurtosis as a
stacked area chart, allowing to see the magnitude of tail risk.
Stacking logic groups components to ensure visual clarity.
- **Relative Mode:** Displays the direct *contribution ratio*
(proportion) of each component relative to the total sum,
ideal for identifying the dominant driver of the risk.
4. **Calculation Options:**
- **Normalization:** An optional 'Normalize' setting
transforms inputs into logarithmic space, analyzing the
kurtosis of *returns* rather than absolute prices.
- **Volume Weighting:** An option (`Volume weighted`) applies
volume weighting to all regression and moment calculations,
emphasizing high-participation moves.
5. **Kurtosis Cycle Analysis:**
- **Pivot Detection:** Includes a built-in pivot detector
that identifies significant turning points (peaks/valleys) in
the *total* kurtosis line. This helps identify extremes in
market fragility or structural changes.
- **Flexible Pivot Algorithms:** Supports various underlying
mathematical models for pivot detection provided by the
core library.
6. **Note on Confirmation (Lag):** Pivot signals are confirmed
using a lookback method. A pivot is only plotted *after*
the `Pivot Right Bars` input has passed, which introduces
an inherent lag.
7. **Multi-Timeframe (MTF) Capability:**
- **MTF Kurtosis Lines:** The kurtosis lines can be
calculated on a higher timeframe, with standard options
to handle gaps (`Fill Gaps`) and prevent repainting
(`Wait for...`).
- **Limitation:** The Pivot detection (`Calculate Pivots`) is
**disabled** if a Higher Timeframe (HTF) is selected.
8. **Integrated Alerts:** Includes comprehensive alerts for:
- Kurtosis magnitude (High Positive / High Negative).
- Kurtosis character changes/emerging/fading.
- Total Kurtosis pivot (High/Low) detection.
---
**DISCLAIMER**
1. **For Informational/Educational Use Only:** This indicator is
provided for informational and educational purposes only. It does
not constitute financial, investment, or trading advice, nor is
it a recommendation to buy or sell any asset.
2. **Use at Your Own Risk:** All trading decisions you make based on
the information or signals generated by this indicator are made
solely at your own risk.
3. **No Guarantee of Performance:** Past performance is not an
indicator of future results. The author makes no guarantee
regarding the accuracy of the signals or future profitability.
4. **No Liability:** The author shall not be held liable for any
financial losses or damages incurred directly or indirectly from
the use of this indicator.
5. **Signals Are Not Recommendations:** The alerts and visual signals
(e.g., crossovers) generated by this tool are not direct
recommendations to buy or sell. They are technical observations
for your own analysis and consideration.

Volume Weighted KurtosisThis indicator analyzes market sentiment by decomposing total
Excess Kurtosis ("Fat Tails") into distinct, interpretable components:
"Between-Bar" (Trend Path) and "Within-Bar" (Microstructure).
Key Features:
1. **Moment-Based Kurtosis Decomposition:** The indicator
separates kurtosis based on the 'Estimate Bar Statistics' option.
It leverages the additive property of the Fourth Central Moment
(Cumulants) to ensure mathematical rigor:
- **Standard Mode (`Estimate Bar Statistics` = OFF):** Calculates
simple kurtosis of the selected `Source`.
- **Decomposition Mode (`Estimate Bar Statistics` = ON):** The
indicator uses a statistical model ('Estimator') to
calculate *within-bar* kurtosis.
This separates the tail risk into:
- **Between-Bar Kurtosis (Gold):** Peakedness of the price
path itself. High values indicate the trend moves in jumps
or gaps rather than a smooth progression.
- **Within-Bar Kurtosis (Blue):** Fat tails within the
microstructure. High values imply significant outliers
inside the bars (e.g., extreme wicks).
- **Interaction Variance (Dark Grey):** The comovement of variance
and mean deviations (volatility clustering relative to trend).
- **Interaction Skewness (Darker Grey):** The comovement of skewness
and mean deviations (asymmetry relative to trend).
2. **Visual Decomposition Logic:** Total Excess Kurtosis is the
primary metric displayed. Since Kurtosis coefficients are not
linearly additive, this indicator calculates the *exact* Total
Kurtosis and partitions the area/ratios based on the additive
Fourth Moment Decomposition (`M4Tot = M4Btw + M4Wtn + M4Int`). This
ensures the displayed total kurtosis remains mathematically accurate.
3. **Dual Display Modes:** The indicator offers two modes to
visualize this decomposition:
- **Absolute Mode:** Displays the *Total Kurtosis* as the main
line, with the background filled by the stacked components.
Shows the *magnitude* of the tail risk.
- **Relative Mode:** Displays the **Contribution Ratios**
of each component (-1.0 to 1.0). This isolates the
*structure/quality* of the risk (e.g., "Is the risk
driven by the trend jumps or by the candle instability?").
4. **Calculation Options:**
- **Normalization:** An optional 'Normalize' setting
transforms inputs into logarithmic space, analyzing the
kurtosis of *returns* rather than absolute prices.
(Essential for correct statistical properties).
- **Volume Weighting:** An option (`Volume weighted`) applies
volume weighting to all moment calculations, emphasizing
high-participation moves.
5. **Kurtosis Cycle Analysis:**
- **Pivot Detection:** Includes a built-in pivot detector
that identifies significant turning points (peaks/valleys) in
the *Total Kurtosis* line. (Note: This is only visible
in 'Absolute Mode').
- **Flexible Pivot Algorithms:** Supports various underlying
mathematical models for pivot detection provided by the
core library.
6. **Note on Confirmation (Lag):** Pivot signals are confirmed
using a lookback method. A pivot is only plotted *after*
the `Pivot Right Bars` input has passed, which introduces
an inherent lag.
7. **Multi-Timeframe (MTF) Capability:**
- **MTF Kurtosis Lines:** The kurtosis lines can be
calculated on a higher timeframe, with standard options
to handle gaps (`Fill Gaps`) and prevent repainting
(`Wait for...`).
- **Limitation:** The Pivot detection (`Calculate Pivots`) is
**disabled** if a Higher Timeframe (HTF) is selected.
8. **Integrated Alerts:** Includes comprehensive alerts for:
- Kurtosis magnitude (High Positive / High Negative).
- Character changes (Inter-Bar vs. Intra-Bar dominance).
- Total Kurtosis pivot (High/Low) detection.
---
**DISCLAIMER**
1. **For Informational/Educational Use Only:** This indicator is
provided for informational and educational purposes only. It does
not constitute financial, investment, or trading advice, nor is
it a recommendation to buy or sell any asset.
2. **Use at Your Own Risk:** All trading decisions you make based on
the information or signals generated by this indicator are made
solely at your own risk.
3. **No Guarantee of Performance:** Past performance is not an
indicator of future results. The author makes no guarantee
regarding the accuracy of the signals or future profitability.
4. **No Liability:** The author shall not be held liable for any
financial losses or damages incurred directly or indirectly from
the use of this indicator.
5. **Signals Are Not Recommendations:** The alerts and visual signals
(e.g., crossovers) generated by this tool are not direct
recommendations to buy or sell. They are technical observations
for your own analysis and consideration.

Volume Weighted Intra Bar LR SkewnessThis indicator analyzes market character by decomposing total
skewness (asymmetry) of a SINGLE BAR into four distinct,
interpretable components based on a Linear Regression model.
Key Features:
1. **Intra-Bar LR Skewness Decomposition:** For each bar on the chart,
the indicator analyzes the underlying price action on a smaller
timeframe ('Intra-Bar Timeframe'). It fits a Linear Regression
line through the intra-bar data to decompose the 3rd Moment:
- **Trend Skewness (Green/Red):** Asymmetry originating from
the slope of the intra-bar regression line. Indicates if the
price path within the bar is geometrically trend-driven.
- **Residual Skewness (Yellow):** Asymmetry of the noise
around the regression line. Captures "Tail Risk" or sudden
shocks within the bar that deviate from the main path.
- **Within-Bar Skewness (Blue):** Asymmetry derived from the
microstructure of individual intra-bar candles.
- **Interaction Skewness (Dark Grey):** Asymmetry caused by
the correlation between price levels and volatility within
the bar (e.g., volatility expanding as price drops).
2. **Visual Decomposition Logic:** Total Skewness is the
primary metric displayed. Since statistical moments are additive,
this indicator calculates the *exact* Total Skewness and partitions
the columns based on the Law of Total Moments.
3. **Dual Display Modes:** The indicator offers two modes to
visualize this decomposition:
- **Absolute Mode:** Plots the *total* skewness as a
stacked column chart. Stacking logic groups components with
the same sign to ensure visual clarity.
- **Relative Mode:** Plots the direct *contribution ratio*
(proportion) of each component relative to the total sum,
ideal for identifying the dominant driver (Trend vs. Noise).
4. **Calculation Options:**
- **Normalization:** An optional 'Normalize' setting
transforms inputs into logarithmic space, analyzing the
skewness of *returns* rather than absolute prices.
- **Volume Weighting:** An option (`Volume weighted`) applies
volume weighting to all regression and moment calculations,
emphasizing high-participation moves.
5. **Skewness Cycle Analysis:**
- **Pivot Detection:** Includes a built-in pivot detector
that identifies significant turning points (peaks/valleys) in
the *total* skewness line. (Note: This is only visible
in 'Absolute Mode').
- **Flexible Pivot Algorithms:** Supports various underlying
mathematical models for pivot detection provided by the
core library.
6. **Note on Confirmation (Lag):** Pivot signals are confirmed
using a lookback method. A pivot is only plotted *after*
the `Pivot Right Bars` input has passed, which introduces
an inherent lag.
7. **Multi-Timeframe (MTF) Capability:**
- **MTF Analysis Lines:** The entire intra-bar analysis can be
run on a higher timeframe (using the `Timeframe` input),
with standard options to handle gaps (`Fill Gaps`) and
prevent repainting (`Wait for...`).
- **Limitation:** The Pivot detection (`Calculate Pivots`) is
**disabled** if a Higher Timeframe (HTF) is selected.
8. **Integrated Alerts:** Includes comprehensive alerts for:
- Skewness magnitude (High Positive / High Negative).
- Character changes (Trend vs. Noise dominance).
- Total Skewness pivot (High/Low) detection.
**Caution: Real-Time Data Behavior (Intra-Bar Repainting)**
This indicator uses high-resolution intra-bar data. As a result, the
values on the **current, unclosed bar** (the real-time bar) will
update dynamically as new intra-bar data arrives. This behavior is
normal and necessary for this type of analysis. Signals should only
be considered final **after the main chart bar has closed.**
---
**DISCLAIMER**
1. **For Informational/Educational Use Only:** This indicator is
provided for informational and educational purposes only. It does
not constitute financial, investment, or trading advice, nor is
it a recommendation to buy or sell any asset.
2. **Use at Your Own Risk:** All trading decisions you make based on
the information or signals generated by this indicator are made
solely at your own risk.
3. **No Guarantee of Performance:** Past performance is not an
indicator of future results. The author makes no guarantee
regarding the accuracy of the signals or future profitability.
4. **No Liability:** The author shall not be held liable for any
financial losses or damages incurred directly or indirectly from
the use of this indicator.
5. **Signals Are Not Recommendations:** The alerts and visual signals
(e.g., crossovers) generated by this tool are not direct
recommendations to buy or sell. They are technical observations
for your own analysis and consideration.

Volume Weighted Intra Bar SkewnessThis indicator analyzes market sentiment by providing a detailed
view of skewness (asymmetry). It uses data from a lower, intra-bar
timeframe to separate the total skewness of a single bar into
distinct, interpretable components.
Key Features:
1. **Intra-Bar Skewness Decomposition:** For each bar on the chart,
the indicator analyzes the underlying price action on a smaller
timeframe ('Intra-Bar Timeframe'). Unlike Variance, the Third
Central Moment (Skewness) decomposes into three parts:
- **Between-Bar Skewness (Gold):** Asymmetry of the price
path *between* the intra-bar candles. Indicates if the macro
movements within the bar accelerated in one direction.
- **Within-Bar Skewness (Blue):** Asymmetry of the
microstructure (wicks vs. tails) *inside* the intra-bar candles.
- **Interaction Skewness (Grey):** The component arising from
the comovement of local means and local variances (e.g.,
does volatility increase when price drops?).
2. **Visual Decomposition Logic:** Total Skewness is the
primary metric displayed. Since Skewness coefficients are not
linearly additive, this indicator calculates the *exact* Total
Skewness and partitions the columns based on the additive
Third Moment Decomposition (`M3Tot = M3Btw + M3Wtn + M3Int`).
3. **Dual Display Modes:** The indicator offers two modes to
visualize this information:
- **Absolute Mode:** Plots the *total* skewness as a
stacked column chart, showing the *absolute magnitude* of
asymmetry and the contribution of each component.
- **Relative Mode:** Plots the components as a 100% stacked
column chart (scaled from 0 to 1), focusing purely on the
*energy ratio* of the components.
4. **Calculation Options:**
- **Normalization:** An optional 'Normalize' setting
calculates an **Exponential Regression Curve** (log-space),
making the analysis suitable for comparing assets with
different scales (e.g., BTC vs EURUSD).
- **Volume Weighting:** An option (`Volume weighted`) applies
volume weighting to all mean and moment calculations.
5. **Skewness Cycle Analysis:**
- **Pivot Detection:** Includes a built-in pivot detector
that identifies significant turning points (highs and lows) in
the *total* skewness line. (Note: This is only visible
in 'Absolute Mode').
- **Flexible Pivot Algorithms:** Supports various underlying
mathematical models for pivot detection provided by the
core library.
6. **Note on Confirmation (Lag):** Pivot signals are confirmed
using a lookback method. A pivot is only plotted *after*
the `Pivot Right Bars` input has passed, which introduces
an inherent lag.
7. **Multi-Timeframe (MTF) Capability:**
- **MTF Analysis Lines:** The entire intra-bar analysis can be
run on a higher timeframe (using the `Timeframe` input),
with standard options to handle gaps (`Fill Gaps`) and
prevent repainting (`Wait for...`).
- **Limitation:** The Pivot detection (`Calculate Pivots`) is
**disabled** if a Higher Timeframe (HTF) is selected.
8. **Integrated Alerts:** Includes alerts for:
- Skewness magnitude (High Positive / High Negative).
- Skewness character changes/emerging/fading.
- Total Skewness pivot (High/Low) detection.
**Caution: Real-Time Data Behavior (Intra-Bar Repainting)**
This indicator uses high-resolution intra-bar data. As a result, the
values on the **current, unclosed bar** (the real-time bar) will
update dynamically as new intra-bar data arrives. This behavior is
normal and necessary for this type of analysis. Signals should only
be considered final **after the main chart bar has closed.**
---
**DISCLAIMER**
1. **For Informational/Educational Use Only:** This indicator is
provided for informational and educational purposes only. It does
not constitute financial, investment, or trading advice, nor is
it a recommendation to buy or sell any asset.
2. **Use at Your Own Risk:** All trading decisions you make based on
the information or signals generated by this indicator are made
solely at your own risk.
3. **No Guarantee of Performance:** Past performance is not an
indicator of future results. The author makes no guarantee
regarding the accuracy of the signals or future profitability.
4. **No Liability:** The author shall not be held liable for any
financial losses or damages incurred directly or indirectly from
the use of this indicator.
5. **Signals Are Not Recommendations:** The alerts and visual signals
(e.g., crossovers) generated by this tool are not direct
recommendations to buy or sell. They are technical observations
for your own analysis and consideration.

Volume Weighted LR SkewnessThis indicator analyzes market character by decomposing total
skewness (asymmetry) into four distinct, interpretable components
based on a Linear Regression model.
Key Features:
1. **Four-Component Skewness Decomposition:** The indicator
separates market asymmetry based on the 'Estimate Bar Statistics' option.
It leverages the Law of Total Moments to provide an additive
breakdown of the 3rd Statistical Moment:
- **Trend Skewness (Green/Red):** Asymmetry originating from
the slope of the regression line itself. Indicates if the
trend path is geometrically skewed.
- **Residual Skewness (Yellow):** Asymmetry of the noise
around the regression line. Captures "Tail Risk" (e.g.,
sudden spikes against the trend).
- **Within-Bar Skewness (Blue):** Asymmetry derived from the
microstructure of individual bars (requires 'Estimate Bar Statistics').
- **Interaction Skewness (Dark Grey):** Asymmetry caused by the
correlation between price levels and volatility (e.g.,
volatility expanding as price moves in one direction).
*Dominance of this component indicates an unstable, emotional market.*
2. **Visual Decomposition Logic:** Total Skewness is the
primary metric displayed. Since statistical moments are additive,
this indicator calculates the *exact* Total Skewness and partitions
the area to visualize the contribution (weight) of each
structural source to the overall market bias.
3. **Dual Display Modes:** The indicator offers two modes to
visualize this decomposition:
- **Absolute Mode:** Displays the *total* skewness as a
stacked area chart, allowing to see the magnitude of tail risk.
Stacking logic groups components with the same sign to ensure
visual clarity.
- **Relative Mode:** Displays the direct *contribution ratio*
(proportion) of each component relative to the total sum,
ideal for identifying the dominant driver of asymmetry.
4. **Calculation Options:**
- **Normalization:** An optional 'Normalize' setting
transforms inputs into logarithmic space, analyzing the
skewness of *returns* rather than absolute prices.
- **Volume Weighting:** An option (`Volume weighted`) applies
volume weighting to all regression and moment calculations,
emphasizing high-participation moves.
5. **Skewness Cycle Analysis:**
- **Pivot Detection:** Includes a built-in pivot detector
that identifies significant turning points (peaks/valleys) in
the *total* skewness line. This helps identify extremes in
market sentiment or structural bias.
- **Flexible Pivot Algorithms:** Supports various underlying
mathematical models for pivot detection provided by the
core library.
6. **Note on Confirmation (Lag):** Pivot signals are confirmed
using a lookback method. A pivot is only plotted *after*
the `Pivot Right Bars` input has passed, which introduces
an inherent lag.
7. **Multi-Timeframe (MTF) Capability:**
- **MTF Skewness Lines:** The skewness lines can be
calculated on a higher timeframe, with standard options
to handle gaps (`Fill Gaps`) and prevent repainting
(`Wait for...`).
- **Limitation:** The Pivot detection (`Calculate Pivots`) is
**disabled** if a Higher Timeframe (HTF) is selected.
8. **Integrated Alerts:** Includes comprehensive alerts for:
- Skewness magnitude (High Positive / High Negative).
- Skewness character changes/emerging/fading.
- Total Skewness pivot (High/Low) detection.
---
**DISCLAIMER**
1. **For Informational/Educational Use Only:** This indicator is
provided for informational and educational purposes only. It does
not constitute financial, investment, or trading advice, nor is
it a recommendation to buy or sell any asset.
2. **Use at Your Own Risk:** All trading decisions you make based on
the information or signals generated by this indicator are made
solely at your own risk.
3. **No Guarantee of Performance:** Past performance is not an
indicator of future results. The author makes no guarantee
regarding the accuracy of the signals or future profitability.
4. **No Liability:** The author shall not be held liable for any
financial losses or damages incurred directly or indirectly from
the use of this indicator.
5. **Signals Are Not Recommendations:** The alerts and visual signals
(e.g., crossovers) generated by this tool are not direct
recommendations to buy or sell. They are technical observations
for your own analysis and consideration.

Volume Weighted SkewnessThis indicator analyzes market sentiment by decomposing total
skewness (asymmetry) into two distinct, interpretable components:
"Between-Bar" (Inter-Bar) and "Within-Bar" (Intra-Bar) skewness.
Key Features:
1. **Moment-Based Skewness decomposition:** The indicator
separates skewness based on the 'Estimate Bar Statistics' option.
It leverages the additive property of the Third Central Moment
to ensure mathematical rigor:
- **Standard Mode (`Estimate Bar Statistics` = OFF):** Calculates
simple skewness of the selected `Source`.
- **Decomposition Mode (`Estimate Bar Statistics` = ON):** The
indicator uses a statistical model ('Estimator') to
calculate *within-bar* skewness.
This separates the asymmetry into:
- **Between-Bar Skewness (Gold):** Asymmetry of the price
path itself. A positive value indicates that the trend
moves more aggressively upwards than downwards.
- **Within-Bar Skewness (Blue):** Asymmetry of the
microstructure (wicks vs. tails). A positive value implies
strong buying pressure within the bars (long tails).
2. **Visual Decomposition Logic:** Total Skewness is the
primary metric displayed. Since Skewness coefficients are not
linearly additive, this indicator calculates the *exact* Total
Skewness and partitions the area/ratios based on the additive
Third Moment Decomposition (`M3Tot = M3Btw + M3Wtn`). This
ensures the displayed total skewness remains mathematically accurate.
3. **Dual Display Modes:** The indicator offers two modes to
visualize this decomposition:
- **Absolute Mode:** Displays the *Total Skewness* as the main
line, with the background filled by the stacked components.
Shows the *magnitude* and direction of the tail risk.
- **Relative Mode:** Displays the **Contribution Ratios**
of each component (-1.0 to 1.0). This isolates the
*structure/quality* of the asymmetry (e.g., "Is the skewness
driven by the trend or by the candle shapes?").
4. **Calculation Options:**
- **Normalization:** An optional 'Normalize' setting
transforms inputs into logarithmic space, analyzing the
skewness of *returns* rather than absolute prices.
(Essential for correct statistical properties).
- **Volume Weighting:** An option (`Volume weighted`) applies
volume weighting to all moment calculations, emphasizing
high-participation moves.
5. **Skewness Cycle Analysis:**
- **Pivot Detection:** Includes a built-in pivot detector
that identifies significant turning points (peaks/valleys) in
the *Total Skewness* line. (Note: This is only visible
in 'Absolute Mode').
- **Flexible Pivot Algorithms:** Supports various underlying
mathematical models for pivot detection provided by the
core library.
6. **Note on Confirmation (Lag):** Pivot signals are confirmed
using a lookback method. A pivot is only plotted *after*
the `Pivot Right Bars` input has passed, which introduces
an inherent lag.
7. **Multi-Timeframe (MTF) Capability:**
- **MTF Skewness Lines:** The skewness lines can be
calculated on a higher timeframe, with standard options
to handle gaps (`Fill Gaps`) and prevent repainting
(`Wait for...`).
- **Limitation:** The Pivot detection (`Calculate Pivots`) is
**disabled** if a Higher Timeframe (HTF) is selected.
8. **Integrated Alerts:** Includes comprehensive alerts for:
- Skewness magnitude (High Positive / High Negative).
- Character changes (Inter-Bar vs. Intra-Bar dominance).
- Total Skewness pivot (High/Low) detection.
---
**DISCLAIMER**
1. **For Informational/Educational Use Only:** This indicator is
provided for informational and educational purposes only. It does
not constitute financial, investment, or trading advice, nor is
it a recommendation to buy or sell any asset.
2. **Use at Your Own Risk:** All trading decisions you make based on
the information or signals generated by this indicator are made
solely at your own risk.
3. **No Guarantee of Performance:** Past performance is not an
indicator of future results. The author makes no guarantee
regarding the accuracy of the signals or future profitability.
4. **No Liability:** The author shall not be held liable for any
financial losses or damages incurred directly or indirectly from
the use of this indicator.
5. **Signals Are Not Recommendations:** The alerts and visual signals
(e.g., crossovers) generated by this tool are not direct
recommendations to buy or sell. They are technical observations
for your own analysis and consideration.
