NY HIGH LOW BREAKNY HIGH LOW BREAK: A New York Session Breakout Strategy
The "NY HIGH LOW BREAK" indicator is a powerful TradingView script designed to identify and capitalize on breakout opportunities during the New York trading session. This strategy focuses on the initial price action of the New York market open, looking for clear breaches of the high or low established within the first 30 minutes. It's particularly suited for intraday traders who seek to capture momentum-driven moves.
Strategy Logic
The core of the "NY HIGH LOW BREAK" strategy revolves around these key components:
New York Session Opening Range Identification:
The script first identifies the opening range of the New York session. This is defined by the high and low prices established during the first 30 minutes of the New York trading session (from 7:01 AM GMT-4 to 7:31 AM GMT-4).
These crucial levels are then extended forward on the chart as horizontal lines, serving as potential support and resistance zones.
Breakout Signal Generation:
Long Signal: A buy signal is generated when the price breaks above the high of the New York opening range. Specifically, it looks for a candle whose open and close are both above the highLinePrice, and importantly, the previous candle's open was below and close was above the highLinePrice. This indicates a strong upward momentum confirming the breakout.
Short Signal: Conversely, a sell signal is generated when the price breaks below the low of the New York opening range. It looks for a candle whose open and close are both below the lowLinePrice, and the previous candle's open was above and close was below the lowLinePrice. This suggests strong downward momentum confirming the breakdown.
Supertrend Filter (Implicit/Future Enhancement):
While the supertrend and direction variables are present in the code, they are not actively used in the current signal generation logic. This suggests a potential future enhancement where the Supertrend indicator could be incorporated as a trend filter to confirm breakout directions, adding an extra layer of confluence to the signals. For example, only taking long breakouts when Supertrend indicates an uptrend, and short breakouts when Supertrend indicates a downtrend.
Second Candle Confirmation (Possible Future Enhancement):
The close_sec_candle function and openSEC, closeSEC variables indicate an attempt to capture the open and close of a "second candle" (30 minutes after the initial New York open). Currently, closeSEC is used in a specific condition for signal_way but not directly in the primary longSignal or shortSignal logic. This also suggests a potential future refinement where the price action of this second candle could be used for further confirmation or specific entry criteria.
Time-Based Filtering:
Signals are only considered valid within a specific trading window from 8:00 AM GMT-4 to 8:00 AM GMT-4 + 16 * 30 minutes (which is 480 minutes, or 8 hours) on 1-minute and 5-minute timeframes. This ensures that trades are taken during the most active and volatile periods of the New York session, avoiding late-session chop.
The script also highlights the New York session and lunch hours using background colors, providing visual context to the trading day.
Key Features
Automated New York Open Range Detection: The script automatically identifies and plots the high and low of the first 30 minutes of the New York trading session.
Clear Breakout Signals: Visually distinct "BUY" and "SELL" labels appear on the chart when a breakout occurs, making it easy to spot trading opportunities.
Timeframe Adaptability: While optimized for 1-minute and 5-minute timeframes for signal generation, the opening range lines can be displayed on various timeframes.
Customizable Risk-to-Reward (RR): The rr input allows users to define their preferred risk-to-reward ratio for potential trades, although it's not directly implemented in the current signal or trade management logic. This could be used by traders for manual trade management.
Visual Session and Lunch Highlights: The script colors the background to clearly delineate the New York trading session and the lunch break, helping traders understand the market context.
How to Use
Apply the Indicator: Add the "NY HIGH LOW BREAK" indicator to your chart on TradingView.
Select a Relevant Timeframe: For optimal signal generation, use 1-minute or 5-minute timeframes.
Observe the Opening Range: The green and red lines represent the high and low of the first 30 minutes of the New York session.
Look for Breakouts: Wait for price to decisively break above the green line (for a buy) or below the red line (for a sell).
Confirm Signals: The "BUY" or "SELL" labels will appear on the chart when the breakout conditions are met within the active trading window.
Implement Your Risk Management: Use your preferred risk management techniques, including stop-loss and take-profit levels, in conjunction with the signals generated. The rr input can guide your manual risk-to-reward calculations.
Potential Enhancements & Considerations
Supertrend Confirmation: Integrating the supertrend variable to filter signals would significantly enhance the strategy's robustness by aligning trades with the prevailing trend.
Stop-Loss and Take-Profit Automation: The rr input currently serves as a manual guide. Future versions could integrate automated stop-loss and take-profit placement based on this ratio, potentially using ATR for dynamic sizing.
Volume Confirmation: Adding a volume filter to confirm breakouts would ensure that only high-conviction moves are traded.
Backtesting and Optimization: Thorough backtesting across various assets and market conditions is crucial to determine the optimal settings and profitability of this strategy.
Session Times: The current session times are hardcoded. Making these user-definable inputs would allow for greater flexibility across different time zones and trading preferences.
The "NY HIGH LOW BREAK" is a straightforward yet effective strategy for capturing initial New York session momentum. By focusing on clear breakout levels, it aims to provide timely and actionable trading signals for intraday traders.
ค้นหาในสคริปต์สำหรับ "low"

Previous 2 Days High/LowCan you give me a summary of this indicator
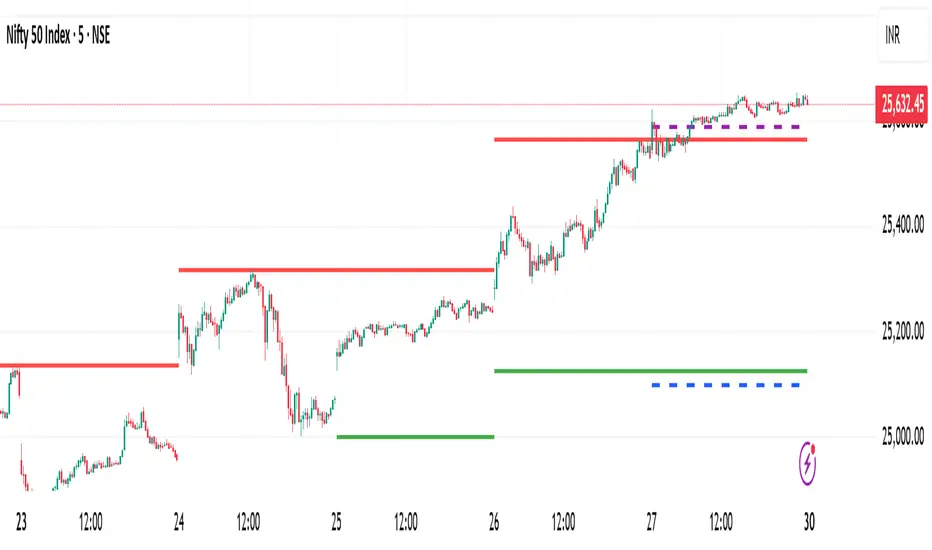
The "Previous 2 Days High/Low" indicator, written in Pine Script v5 for TradingView, plots horizontal lines representing the combined high and low prices of the previous two trading days on a chart. Here's a summary of its functionality, purpose, and key features:
Purpose
The indicator helps traders identify significant price levels by displaying the highest high and lowest low from the previous two days, which can act as potential support or resistance levels. These levels are plotted as lines that extend across the current trading day, making it easier to visualize key price zones for trading decisions.
Key Features
Calculates Combined High and Low:
Retrieves the high and low prices of the previous day and the day before using request.security on the daily timeframe ("D").
Computes the combined high as the maximum of the two days' highs and the combined low as the minimum of the two days' lows.
Dynamic Line Plotting:
Draws two horizontal lines:
Red Line: Represents the combined high, plotted at the highest price of the previous two days.
Green Line: Represents the combined low, plotted at the lowest price of the previous two days.
Lines are created at the start of a new trading day and extended to the right edge of the chart using line.set_x2, ensuring they span the entire current day.
Labels for Clarity:
Adds labels to the right of the chart, displaying the exact price values of the combined high ("Combined High: ") and combined low ("Combined Low: ").
Labels are updated to move with the lines, maintaining alignment at the current bar.
Clutter Prevention:
Deletes old lines and labels at the start of each new trading day to avoid overlapping or excessive objects on the chart.
Dynamic Requests:
Uses dynamic_requests=true in the indicator() function to allow request.security calls within conditional blocks (if ta.change(time("D"))), enabling daily data retrieval within the script's logic.
Previous Daily High/LowThe previous day’s high and low are critical price levels that traders use to identify potential support, resistance, and intraday trading opportunities. These levels represent the highest and lowest prices reached during the prior trading session and often act as reference points for future price action.
Why Are Previous Daily High/Low Important?
Support & Resistance Zones
The previous day’s low often acts as support (buyers defend this level).
The previous day’s high often acts as resistance (sellers defend this level).
Breakout Trading
A move above the previous high suggests bullish momentum.
A move below the previous low suggests bearish momentum.
Mean Reversion Trading
Traders fade moves toward these levels, expecting reversals.
Example: Buying near the previous low in an uptrend.
Institutional Order Flow
Market makers and algos often reference these levels for liquidity.
How to Use Previous Daily High/Low in Trading
1. Breakout Strategy
Long Entry: Price breaks & closes above previous high → bullish continuation.
Short Entry: Price breaks & closes below previous low → bearish continuation.
2. Reversal Strategy
Long at Previous Low: If price pulls back to the prior day’s low in an uptrend.
Short at Previous High: If price rallies to the prior day’s high in a downtrend.
3. Range-Bound Markets
Buy near previous low, sell near previous high if price oscillates between them.
Example Trade Setup
Scenario: Price opens near the previous day’s high.
Bullish Case: A breakout above it targets next resistance.
Bearish Case: Rejection at the high signals a pullback.

Previous Highs & Lows (Customizable)Previous Highs & Lows (Customizable)
This Pine Script indicator displays horizontal lines and labels for high, low, and midpoint levels across multiple timeframes. The indicator plots levels from the following periods:
Today's session high, low, and midpoint
Yesterday's high, low, and midpoint
Current week's high, low, and midpoint
Last week's high, low, and midpoint
Last month's high, low, and midpoint
Last quarter's high, low, and midpoint
Last year's high, low, and midpoint
Features
Individual Controls: Each timeframe has separate toggles for showing/hiding high/low levels and midpoint levels.
Custom Colors: Independent color selection for lines and labels for each timeframe group.
Display Options:
Adjustable line width (1-5 pixels)
Variable label text size (tiny, small, normal, large, huge)
Configurable label offset positioning
Organization: Settings are grouped by timeframe in a logical sequence from most recent (today) to least recent (last year).
Display Logic: Lines span the current trading day only. Labels are positioned to the right of the price action. The indicator automatically removes previous drawings to prevent chart clutter.

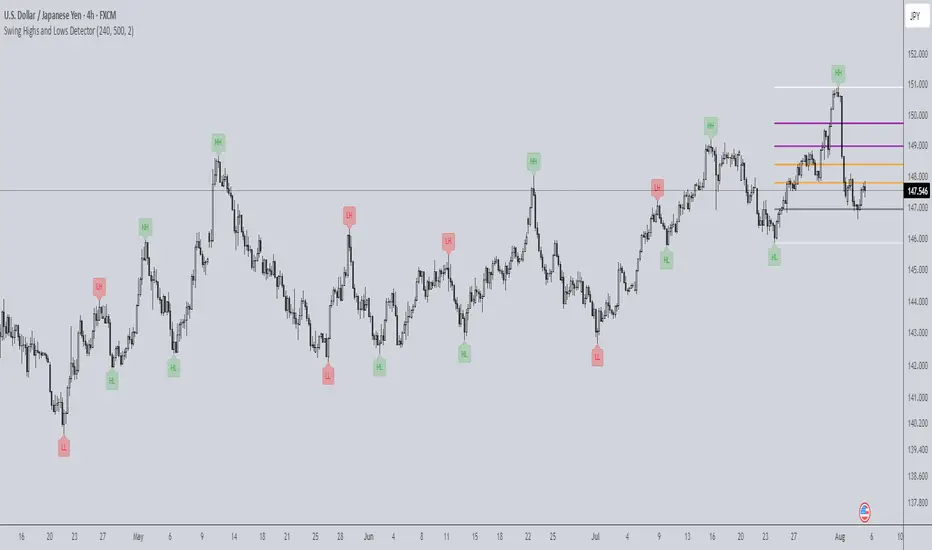
Swing Highs and Lows Detector🔍 Swing Highs and Lows Detector
The Swing Highs and Lows Detector is a powerful tool for traders looking to identify meaningful structural shifts in price action, based on swing point logic and internal trend shifts.
📈 What It Does
This indicator automatically identifies and labels:
HH (Higher High) – Price broke above the previous swing high
LH (Lower High) – Price failed to break the previous high, signaling potential weakness
LL (Lower Low) – Price broke below the previous swing low
HL (Higher Low) – Price maintained a higher support level, indicating strength
The script distinguishes between bullish and bearish internal shifts and tracks the highest/lowest points between those shifts to determine the swing structure.
⚙️ How It Works
You can choose between two shift detection modes:
"Open": Compares closing price to the first open of the opposite streak
"High/Low": Uses the high of bearish or low of bullish candles
Once a shift is confirmed, the indicator scans the bars between shifts to find the most significant swing high or low
When a valid swing is detected, it’s labeled directly on the chart with color-coded markers
🛎️ Built-in Alerts
Set alerts for:
Higher High
Lower High
Lower Low
Higher Low
These alerts help you catch key structural shifts in real time — great for breakout traders, structure-based analysts, and smart money concepts (SMC) strategies.
✅ How to Use
Confirm Trend Strength or Reversals – Use HH/HL to confirm an uptrend, LL/LH to confirm a downtrend
Combine with Liquidity Sweeps or Zones – Ideal for SMC or Wyckoff-style setups
Entry/Exit Triggers – Use swing breaks to time entries or exits near key structural points
Liquidity Levels (Smart Swing Lows)Liquidity Levels — Smart Swing Low Detection
Efficient Liquidity Sweep Visualization for Smart Money Traders
This script automatically identifies and plots liquidity-rich swing lows based on pivot logic, filters them to remove redundant levels, and overlays daily highs/lows for added context — giving Smart Money Concept (SMC) traders a clean, actionable map of liquidity.
It’s designed to be minimal yet powerful: perfect for spotting potential liquidity grabs, mitigation zones, and sweep targets with zero chart clutter.
🔍 What This Script Does:
Detects Smart Swing Lows
Uses fixed pivot detection (left = 3, right = customizable) to identify structurally significant swing lows.
Filters out swing lows that are too close together using a percentage-based spacing threshold to reduce noise.
Mitigation Cleanup Logic
Tracks whether recent price action breaches past swing lows.
If breached, the swing level is automatically removed, keeping only relevant, unmitigated liquidity levels on your chart.
Plots Daily Highs and Lows
Each new trading day, horizontal rays mark the prior day’s high and low — useful for identifying resting liquidity and possible sweep zones.
Labeling and Style Customization
Optional labels for swing lows.
Full control over label size, color, and visibility to match any chart aesthetic.
Timeframe Filtering
Runs exclusively on 5m, 10m, and 15m charts to ensure optimal reliability and signal clarity.
⚙️ Customization Features:
Pivot sensitivity (Right side control)
Minimum distance between swing lows (in %)
Label visibility, size, and color
Line width and colors for both swing levels and daily highs/lows
Mitigation cleanup lookback length
💡 How to Use:
Add the script to a qualifying intraday chart (5–15m).
Use the swing low levels to monitor liquidity-rich zones.
Combine with your personal strategy to identify liquidity grabs, potential reversal zones, or entry points following a sweep.
Let the built-in cleanup logic remove any already-mitigated levels so you can focus on active targets.
🚀 What Makes It Unique:
This isn’t just another pivot plotter — it’s a smart, self-cleaning SMC tool designed for modern liquidity-based trading strategies.
A must-have for traders using concepts like liquidity grabs, mitigation blocks, or sweep-to-reverse trade models.
🔗 Best used in combination with:
✅ First FVG — Opening Range Fair Value Gap Detector: Pinpoint the day’s first imbalance zone for intraday setups.
✅ ICT SMC Liquidity Grabs + OB + Fibonacci OTE Levels: Confluence-based entries powered by liquidity logic, order blocks, and premium/discount zones.
Used together, these scripts form a complete Smart Money toolkit — helping you build high-probability setups with confidence, clarity, and clean charts.

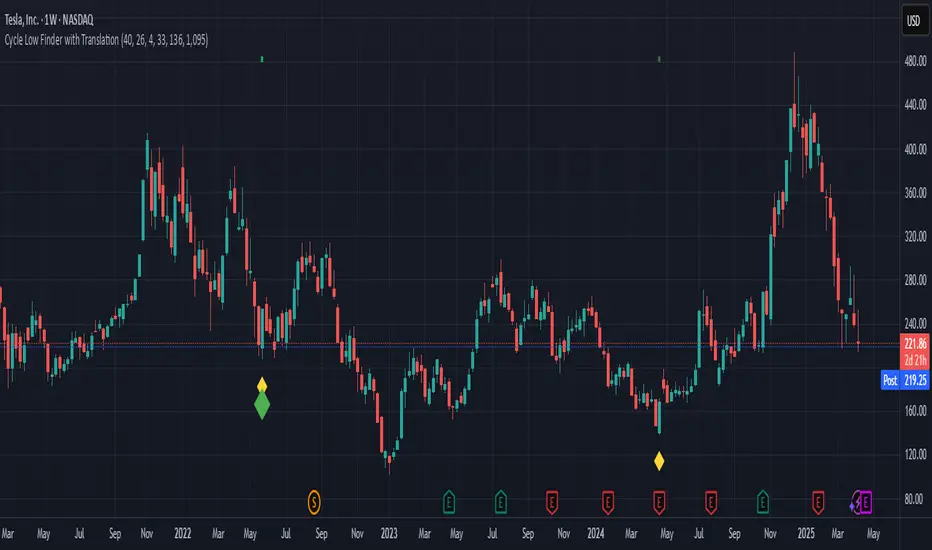
Super Cycle Low FinderHow the Indicator Works
1. Inputs
Users can adjust the cycle lengths:
Daily Cycle: Default is 40 days (within 36-44 days).
Weekly Cycle: Default is 26 weeks (182 days, within 22-31 weeks).
Yearly Cycle: Default is 4 years (1460 days).
2. Cycle Low Detection
Function: detect_cycle_low finds the lowest low over the specified period and confirms it with a bullish candle (close > open).
Timeframes: Daily lows are calculated directly; weekly and yearly lows use request.security to fetch data from higher timeframes.
3. Half Cycle Lows
Detected over half the cycle length, plotted to show mid-cycle strength or weakness.
4. Cycle Translation
Logic: Compares the position of the highest high to the cycle’s midpoint.
Output: "R" for right translated (bullish), "L" for left translated (bearish), displayed above bars.
5. Cycle Failure
Flags when a new low falls below the previous cycle low, indicating a breakdown.
6. Visualization
Cycle Lows: Diamonds below bars (yellow for daily, green for weekly, blue for yearly).
Half Cycle Lows: Circles below bars (orange, lime, aqua).
Translations: "R" or "L" above bars in distinct colors.
Failures: Downward triangles below bars (red, orange, purple).
Highs & Lows - Multi TimeFrame### **📌 HL-MWD (Highs & Lows - Multi Timeframe Indicator) – Community Release**
#### **🔹 Overview**
The **HL-MWD Indicator** is a **multi-timeframe support & resistance tool** that plots **historical highs and lows** from **daily, weekly, and monthly timeframes** onto an intraday chart. It helps traders **identify key levels of support and resistance** that have influenced price action over different timeframes.
This indicator is useful for **day traders, swing traders, and position traders** who rely on **multi-timeframe analysis** to spot critical price levels.
---
### **🔥 Key Features**
✅ **Plots Highs & Lows for Daily, Weekly, and Monthly Timeframes**
✅ **Customizable Lookback Periods for Each Timeframe**
✅ **Adjustable Line Colors, Styles (Solid, Dotted, Dashed), and Widths**
✅ **Extend Lines into the Future to Identify Key Price Levels**
✅ **Option to Display Price Labels for Each Level**
✅ **Gradient Option to Highlight Recent Highs & Lows (Disabled by Default)**
✅ **Compatible with Intraday, Daily, and Weekly Charts**
---
### **📈 How It Works**
- **Daily Highs & Lows:** Captures the **highest and lowest prices** within the selected lookback period (default: **14 bars**).
- **Weekly Highs & Lows:** Marks the **highest and lowest prices** within the chosen weekly lookback (default: **52 bars**).
- **Monthly Highs & Lows:** Displays the **high and low points** from the monthly timeframe (default: **36 bars**).
- **Extended Lines:** Project past highs and lows **into the future** to help identify **potential support & resistance zones**.
---
### **⚠️ TradingView Lookback Limitations**
🔹 **TradingView has a limit on how many historical bars can be accessed per timeframe**, which affects how far back the indicator can retrieve data.
🔹 **Intraday charts (e.g., 5m, 15m) have a limited number of past bars**, meaning:
- **You won’t be able to view 36 months' worth of monthly levels** on a **5-minute chart**, because TradingView doesn’t store that much data in lower timeframes.
- **If multiple timeframes (e.g., weekly + monthly) are enabled at the same time**, some historical data may **not be available on shorter timeframes**.
🔹 **Recommendation:**
- If using **monthly lookbacks (36 months+), view them on a daily or higher timeframe**.
- If using **weekly lookbacks (52 weeks+), higher intraday timeframes (e.g., 1-hour, 4-hour) are better suited**.
- **Lower timeframes (1m, 5m, 15m) may miss some levels** if TradingView's bar limit is exceeded.
---
### **⚙️ Customization Options**
| **Setting** | **Default Value** | **Description** |
|------------------|----------------|----------------|
| **Daily Lookback** | `14` | Number of bars used to calculate daily highs/lows. |
| **Weekly Lookback** | `52` | Number of bars used to calculate weekly highs/lows. |
| **Monthly Lookback** | `36` | Number of bars used to calculate monthly highs/lows. |
| **Line Colors** | Daily: `Blue` Weekly: `Green` Monthly: `Red` | Customizable colors for each timeframe. |
| **Line Style** | `Solid` | Options: Solid, Dashed, Dotted. |
| **Line Width** | `1` | Thickness of the plotted lines. |
| **Extend Line** | `1` | Controls how far the highs/lows extend into the future. |
| **Display Price Labels** | `Enabled` | Shows price labels on each level. |
---
### **🛠️ How to Use It**
- **Enable/disable different timeframes** based on your strategy.
- **Customize colors, line styles, and widths** to match your charting style.
- **Use extended lines to identify support & resistance zones.**
- **Watch price reactions at these levels** for potential entries, exits, and stop-loss placements.
---
### **🚀 Final Thoughts**
The **HL-MWD Indicator** is a **powerful multi-timeframe tool** that helps traders **visualize key support & resistance levels** from higher timeframes on an intraday chart.
⚠️ **However, TradingView’s lookback limits apply—so for longer-term levels, higher timeframes are recommended.**
📌 **Now published for the community!** Let me know if you need any last-minute tweaks! 🔥

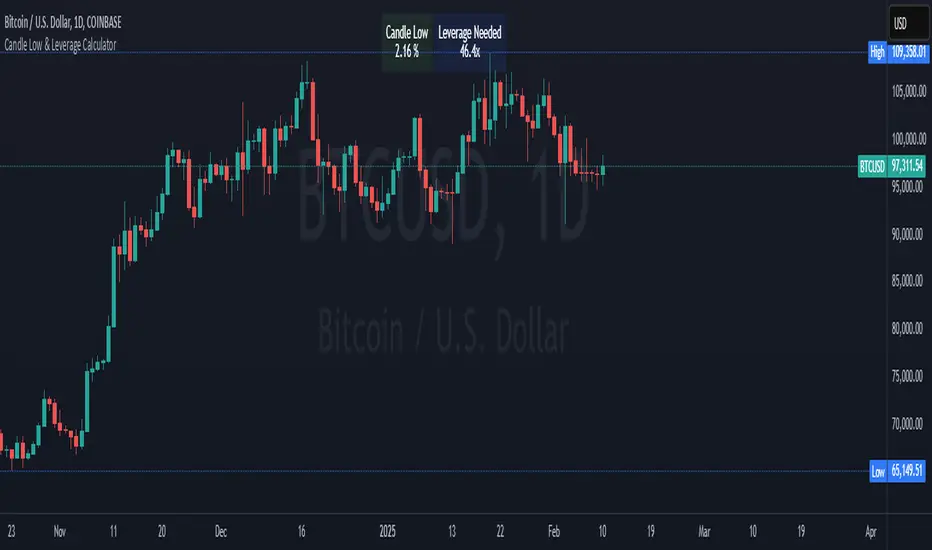
Crypto Candle Low Leverage TrackerCrypto Candle Low Leverage Tracker
The Candle Low Leverage Indicator is a powerful tool for long position traders seeking to manage risk effectively when using leverage. By evaluating the current candle's low price, this indicator helps traders make more informed decisions about potential entry points, stop losses, and leverage levels. The indicator matches the low of the candle to the leverage needed for liquidation, giving you a clear view of how leverage impacts your position.
This indicator provides two critical insights:
% from Candle Low: Tracks how much the price has moved from the low of the current candle. For long position traders, this percentage is crucial for understanding how far the price has come off the low and deciding whether it’s safe to enter a position or if further price action is needed.
Leverage Needed: Estimates the leverage required to reach the candle's low as the liquidation price. Long traders can use this information to adjust leverage to a safer level, ensuring they don’t overexpose themselves to liquidation risks by matching leverage to the candle’s low.
Key Features:
Customizable table positioning (top, middle, bottom).
Toggle options to show/hide % from Candle Low and Leverage Needed.
Visual indicators with color changes: green for positive change, red for negative change, and blue for leverage requirements.
Ideal for long traders, this tool helps evaluate market conditions, manage risks, and calculate the best leverage to use in long trades, ensuring that leverage aligns with the candle’s low to prevent unnecessary liquidations.
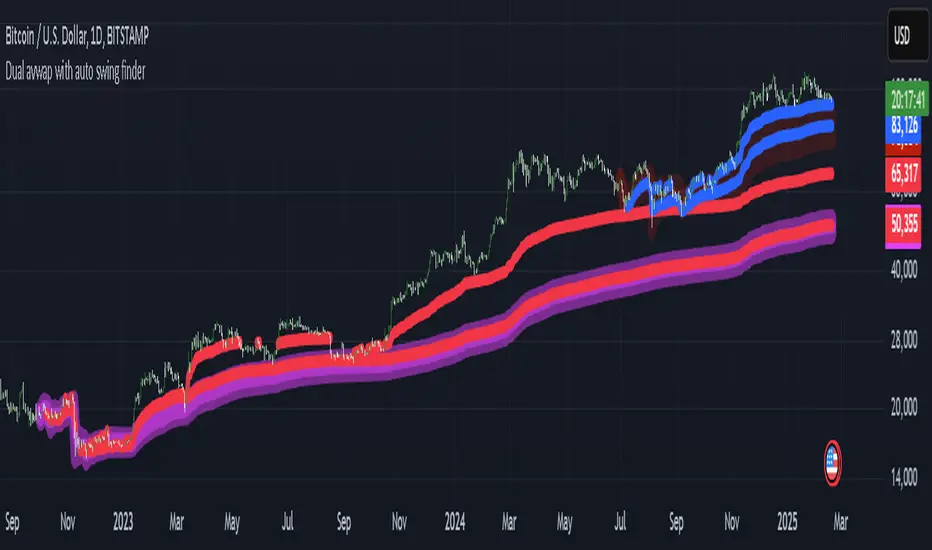
My auto dual avwap with Auto swing low/pivot low finderWelcome to My Auto Dual AVWAP with Auto Swing Low/Pivot Low Finder – an open-source TradingView indicator designed to enhance your technical analysis toolbox. This indicator is published under the Mozilla Public License 2.0 and is available for anyone to study, modify, and distribute.
Key Features
Auto Pivot/Swing Low Finder:
In addition to VWAP lines, the indicator incorporates an automatic detection mechanism for swing lows/pivot lows. This feature assists in identifying potential support areas and price reversals, further enhancing your trading strategy.
Dual VWAP Calculation with high/low range:
The indicator calculates two separate volume-weighted average price (VWAP) lines based on different price inputs (low and high prices) and defined time sessions. This allows traders to gain a more nuanced view of market activity during specific trading periods.
Customizable Time Sessions:
You can specify distinct start and end times for each VWAP calculation session. This flexibility helps you align the indicator with your preferred trading hours or market sessions, making it adaptable to various time zones and trading styles.
Easy to Customize:
With clear code structure and detailed comments, the script is designed to be accessible even for traders who want to customize or extend its functionality. Whether you're a seasoned coder or just starting out, the code is written with transparency in mind.
How It Works
Session Initialization:
The script sets up two distinct time sessions using user-defined start and end times. For each session, it detects the beginning of the trading period to reset cumulative values.
Cumulative Calculations:
During each session, the indicator accumulates the product of price and volume as well as the total volume. The VWAP is then computed as the ratio of these cumulative values.
Dual Data Sources:
Two separate data inputs (using low and high prices) are used to calculate two VWAP lines. This dual approach provides a broader perspective on market trends and can help in identifying dynamic support and resistance levels.
Visualization:
The calculated VWAP lines are plotted directly on your chart with distinct colors and thickness settings for easy visualization. This makes it simple to interpret the data at a glance.
Why Use This Indicator?
Whether you are a day trader, swing trader, or simply looking to refine your market analysis, My Auto Dual AVWAP with Auto Swing Low/Pivot Low Finder offers a robust set of features that can help you identify key price levels and improve your decision-making process. Its open-source nature invites collaboration and customization, ensuring that you can tailor it to fit your unique trading style.
Feel free to explore, modify, and share this indicator. Happy trading!
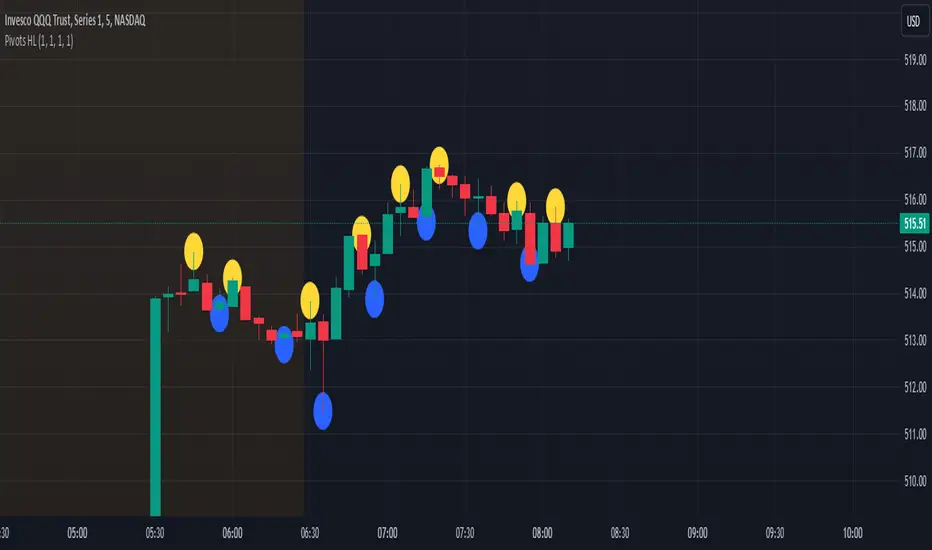
Pivot Points High Low - JVersion**Indicator Name**: Pivot Points High Low (Without Price Labels)
**Overview**
The Pivot Points High Low indicator is designed to identify and mark local highs and lows (or “pivot” points) on a price chart. Unlike other pivot-based indicators that label each pivot with its exact price, this version displays only small circular markers—removing clutter and focusing attention on the pivot locations themselves.
**Key Features**
1. **Pivot Detection**
- The script uses TradingView’s built-in `ta.pivothigh()` and `ta.pivotlow()` functions to determine when the market has formed a pivot high or pivot low.
- You can define how many bars to the left and right are required to confirm a pivot, helping you tailor the indicator to different market conditions and timeframes.
2. **Clean Markers**
- Each confirmed pivot high or low is represented by a circle placed precisely on the candle where the pivot is detected.
- No numeric labels are shown, keeping your chart visually uncluttered while still highlighting important turning points in price.
3. **Customization**
- **Left/Right Pivot Length**: Choose how many bars to the left and right must be lower (for highs) or higher (for lows) to validate a pivot. Larger values mean fewer but more significant pivots; smaller values mean more frequent pivots.
- **Marker Colors**: Independently customize the colors of the high-marker circles and low-marker circles to easily distinguish between local tops and bottoms.
4. **Usage and Interpretation**
- **Identifying Reversals**: As soon as a circle appears at a local high or low, it may indicate a short-term trend reversal or the beginning of a new swing in price.
- **Combine with Other Tools**: Pivot points are more informative when used alongside broader trend analysis, support/resistance identification, or other momentum indicators.
- **Adjusting Sensitivity**: By increasing or decreasing the left/right pivot lengths, you can make the indicator more or less sensitive to small market fluctuations.
5. **Practical Tips**
- **Swing Trading**: Shorter lengths can be used by swing traders looking for quick reversals in lower timeframes.
- **Longer-Term Trends**: Larger lengths are better for position traders or those who prefer to see only major turning points in the market.
- **Clean Chart Layout**: Because text labels are removed, you can visually focus on the circles—especially helpful if you use multiple indicators and prefer a less cluttered chart.
---
By pinpointing local highs and lows without price labels, the **Pivot Points High Low** indicator keeps charts neat yet informative, allowing traders to quickly recognize potential turning points in the market and make more informed decisions.
Trading Sessions with Highs and LowsTrading Sessions with Highs and Lows is designed to visually highlight specific trading sessions on the chart, providing traders with key insights into market behavior during these time periods. Here’s a detailed explanation of how the indicator works:
Key Features
1. Session Boxes:
• The indicator plots colored boxes on the chart to represent the price range of defined trading sessions.
• Each box spans the session’s start and end times and encapsulates the high and low prices during that period.
• Two trading sessions are defined by default:
• USA Trading Session: 9:30 AM - 4:00 PM (New York Time).
• UK Trading Session: 8:00 AM - 4:30 PM (London Time).
2. Session Labels:
• The name of the session (e.g., “USA” or “UK”) is displayed above the session box for clear identification.
3. High and Low Markers:
• Markers are added to the chart at the session’s high and low points:
• High Marker: A green label indicating the session high.
• Low Marker: A red label indicating the session low.
4. Dynamic Reset:
• After the session ends, the session high and low values are reset to na to prepare for the next trading day.
5. Customizable Background Colors:
• Each session’s box has a distinct, semi-transparent background color for better visual separation.
How It Works
1. Core Functionality:
• A function, plot_box, takes the session name, start time, end time, and background color as input.
• It calculates whether the current time is within the session.
• During the session:
• It tracks the session’s highest and lowest prices.
• It identifies the bars where the high and low occurred.
• At the session’s end:
• It plots a box on the chart covering the session’s time and price range.
• Labels are created for the session name and its high/low points.
2. Session Timing:
• Timestamps for the USA and UK trading sessions are calculated using the timestamp function with respective time zones.
3. Visual Elements:
• The box.new function draws the session boxes on the chart.
• The label.new function creates session name and high/low labels.
Usage
• Overlay Mode: The indicator is applied directly on the price chart (overlay=true), making it easy to visualize session-specific price behavior.
• Trading Strategy:
• Identify session-specific support and resistance levels.
• Observe price action trends during key trading periods.
• Align trading decisions with session dynamics.
Customization
While the indicator is preset for the USA and UK trading sessions, it can be easily modified:
1. Add/Remove Sessions: Define additional sessions by providing their start and end times.
2. Change Colors: Update the background_color in the plot_box calls to use different colors for sessions.
3. Adjust Time Zones: Replace the current time zones with others relevant to your trading style.
Visualization Example
• USA Session:
• Time: 9:30 AM - 4:00 PM (New York Time).
• Box Color: Semi-transparent orange.
• UK Session:
• Time: 8:00 AM - 4:30 PM (London Time).
• Box Color: Semi-transparent green.
Why Use This Indicator?
1. Market Awareness: Easily spot price behavior during high-liquidity trading periods.
2. Trend Analysis: Analyze how sessions overlap or affect each other.
3. Session Boundaries: Use session high/low levels as dynamic support and resistance zones.
This indicator is an essential tool for intraday and swing traders who want to align their strategies with key market timings.

16. SMC Strategy with SL - low TimeframeOverview
The "SMC Strategy with SL - low Timeframe" is a comprehensive trading strategy that uses key concepts from Smart Money Theory to identify favorable areas in the market for buying or selling. This strategy takes advantage of price imbalances, support and resistance zones, and swing highs/lows to generate high-probability trade signals.
The key features of this strategy include:
Swing High/Low Analysis: Used to determine the Premium, Equilibrium, and Discount Zones.
Order Block Integration: An added layer of confluence to identify valid buy and sell signals.
Trend Direction Confirmation: Using a Simple Moving Average (SMA) to determine the overall trend.
Entry and Exit Rules: Based on price position relative to key zones and moving average, along with optional stop-loss and take-profit levels.
Detailed Description
Swing High and Swing Low Analysis
The script calculates Swing High and Swing Low based on the most recent price highs and lows over a specified look-back period (swingHighLength and swingLowLength, set to 8 by default).
It then derives the Premium, Equilibrium, and Discount Zones:
Premium Zone: Represents potential resistance, calculated based on recent swing highs.
Discount Zone: Represents potential support, calculated based on recent swing lows.
Equilibrium: The midpoint between Swing High and Swing Low, dividing the price range into Premium (above equilibrium) and Discount (below equilibrium) areas.
Zone Visualization
The strategy plots the Premium Zone (resistance) in red, the Discount Zone (support) in green, and the Equilibrium level in blue on the chart. This helps visually assess the current price relative to these important areas.
Simple Moving Average (SMA)
A 50-period Simple Moving Average (SMA) is added to help identify the trend direction.
Buy signals are valid only if the price is above the SMA, indicating an uptrend.
Sell signals are valid only if the price is below the SMA, indicating a downtrend.
Entry Rules
The script generates buy or sell signals when certain conditions are met:
A buy signal is triggered when:
Price is below the Equilibrium and within the Discount Zone.
Price is above the SMA.
The buy signal is further confirmed by the presence of an Order Block (recent lowest price area).
A sell signal is triggered when:
Price is above the Equilibrium and within the Premium Zone.
Price is below the SMA.
The sell signal is further confirmed by the presence of an Order Block (recent highest price area).
Order Block
The strategy defines Order Blocks as recent highs and lows within a look-back period (orderBlockLength set to 20 by default).
These blocks represent areas where large players (smart money) have historically been active, increasing the probability of the price reacting in these areas again.
Trade Management and Trade Direction
The user can set Trade Direction to either "Long Only," "Short Only," or "Both." This allows the strategy to adapt based on market conditions or trading preferences.
Based on the Trade Direction, the strategy either:
Closes open trades that are against new signals.
Allows only specific directional trades (either long or short).
Stop-loss levels are defined based on a fixed percentage (stop_loss_percent), which helps to manage risk and minimize losses.
Exit Rules
The strategy uses stop-loss levels for risk management.
A stop-loss price is set at a fixed percentage below the entry price for long positions or above the entry price for short positions.
When the price hits the defined stop-loss level, the trade is closed.
Liquidity Zones
The script identifies recent Swing Highs and Lows as potential liquidity zones. These are levels where price could react strongly, as they represent areas of interest for large traders.
The liquidity zones are plotted as crosses on the chart, marking areas where price may encounter significant buying or selling pressure.
Visual Feedback
The script uses visual markers (green for buy signals and red for sell signals) to indicate potential entries on the chart.
It also plots liquidity zones to help traders identify areas where stop hunts and liquidity grabs might occur.
Monthly Performance Dashboard
The script includes a performance tracking feature that displays monthly profit and loss metrics on the chart.
This dashboard allows the trader to see a visual representation of trading performance over time, providing insights into profitability and consistency.
The table shows profit or loss for each month and year, allowing the user to track the overall success of the strategy.
Key Benefits
Smart Money Concepts (SMC): This strategy incorporates SMC principles like order blocks and liquidity zones, which are used by institutional traders to determine potential market moves.
Zone Analysis: The use of Premium, Discount, and Equilibrium zones provides a solid framework for determining where to enter and exit trades based on price discounts or premiums.
Confluence: Signals are not taken in isolation. They are confirmed by factors like trend direction (SMA) and order blocks, providing greater trade accuracy.
Risk Management: By integrating stop-loss functionality, traders can manage their risks effectively.
Visual Performance Metrics: The monthly and yearly performance dashboard gives valuable feedback on how well the strategy has performed historically.
Practical Use
Buy in Discount Zone: Traders would be looking to buy when the price is discounted relative to its recent range and is above the SMA, indicating an overall uptrend.
Sell in Premium Zone: Conversely, traders would be looking to sell when the price is at a premium relative to its recent range and below the SMA, indicating an overall downtrend.
Order Block Confirmation: Ensures that buying or selling is supported by historical price behavior at significant levels, providing confidence that the market is likely to react at these areas.
This strategy is designed to help traders take advantage of price inefficiencies and areas where institutional traders are likely to be active, increasing the odds of successful trades. By leveraging Smart Money concepts and strong technical confluence, it aims to provide high-probability trade setups.

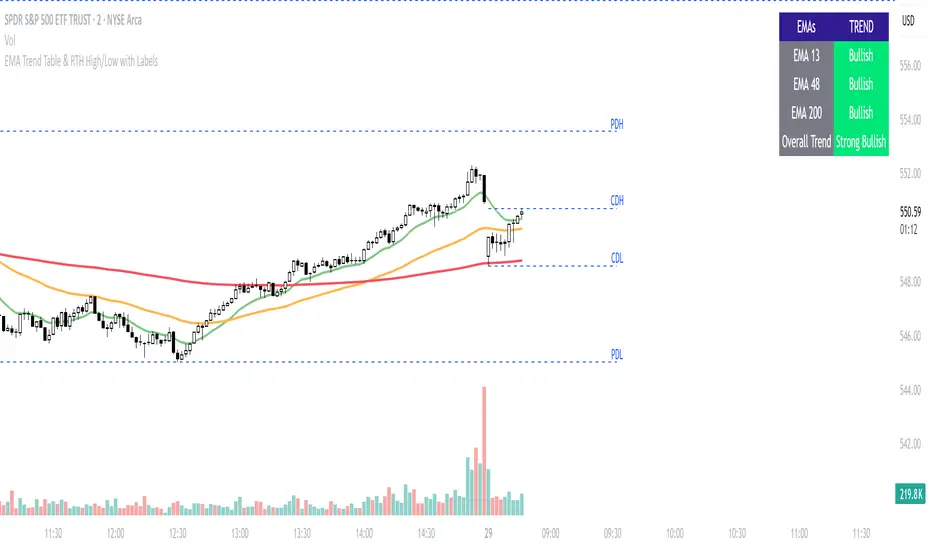
Previous Day and Current Day High/LowKey Features:
Previous Day High and Low Lines:
Displays the high (PDH) and low (PDL) levels of the previous trading day.
Allows customization of line colors, styles (solid, dashed, or dotted), and widths.
Extends these lines by a specified number of candles into the current day for better visualization.
Current Day High and Low Lines:
Displays the high (CDH) and low (CDL) levels during the current day's regular trading hours.
Customizable line attributes, including color, style, width, and extension length.
Customizable Input Options:
User-configurable settings for both the previous and current day high/low lines, grouped under respective sections for clarity.
Regular trading hours can be defined manually (default is 9:30 AM to 4:00 PM).
Ability to toggle the visibility of the lines for both the previous and current days.
Automatic Reset at the Start of a New Day:
Captures the high and low values of the completed day and resets for the new day.
Deletes old lines and labels to ensure clarity and avoid overlap.
Dynamic Updates:
Updates the current day's high and low lines and labels as new data comes in.
Adjusts previous day lines dynamically based on the user-defined number of candles to extend.
Session-Based Filtering:
Ensures the calculations and updates are restricted to the defined regular trading hours.
Code Logic:
Input Groups: The script uses grouped inputs to allow users to configure settings for previous and current day levels separately.
Line and Label Management: It creates and deletes lines and labels dynamically to prevent clutter and keep the chart organized.
Session Check: Uses the session input to determine if a bar falls within regular trading hours.
High/Low Calculation: Tracks the high and low for both the previous and current days during regular trading hours.
New Day Detection: Identifies the start of a new trading day to update previous day values and reset current day variables.
Applications:
Intraday Trading: Helps traders identify critical support and resistance levels from the previous and current days.
Trend Analysis: Provides visual cues for price movement trends across consecutive days.
Custom Visualization: With extensive customization options, traders can adapt the indicator to suit their trading style and chart aesthetics.
This script is highly configurable, making it versatile for a wide range of trading strategies and styles.
Fibonacci Levels Strategy with High/Low Criteria-AYNETThis code represents a TradingView strategy that uses Fibonacci levels in conjunction with high/low price criteria over specified lookback periods to determine buy (long) and sell (short) conditions. Below is an explanation of each main part of the code:
Explanation of Key Sections
User Inputs for Higher Time Frame and Candle Settings
Users can select a higher time frame (timeframe) for analysis and specify whether to use the "Current" or "Last" higher time frame (HTF) candle for calculating Fibonacci levels.
The currentlast setting allows flexibility between using real-time or the most recent closed higher time frame candle.
Lookback Periods for High/Low Criteria
Two lookback periods, lowestLookback and highestLookback, allow users to set the number of bars to consider when finding the lowest and highest prices, respectively.
This determines the criteria for entering trades based on how recent highs or lows compare to current prices.
Fibonacci Levels Configuration
Fibonacci levels (0%, 23.6%, 38.2%, 50%, 61.8%, 78.6%, and 100%) are configurable. These are used to calculate price levels between the high and low of the higher time frame candle.
Each level represents a retracement or extension relative to the high/low range of the HTF candle, providing important price levels for decision-making.
HTF Candle Calculation
HTF candle data is calculated based on the higher time frame selected by the user, using the newbar check to reset htfhigh, htflow, and htfopen values.
The values are updated with each new HTF bar or as prices move within the same HTF bar to track the highest high and lowest low accurately.
Set Fibonacci Levels Array
Using the calculated HTF candle's high, low, and open, the Fibonacci levels are computed by interpolating these values according to the user-defined Fibonacci levels.
A fibLevels array stores these computed values.
Plotting Fibonacci Levels
Each Fibonacci level is plotted on the chart with a different color, providing visual indicators for potential support/resistance levels.
High/Low Price Criteria Calculation
The lowest and highest prices over the specified lookback periods (lowestLookback and highestLookback) are calculated and plotted on the chart. These serve as dynamic levels to trigger long or short entries.
Trade Signal Conditions
longCondition: A long (buy) signal is generated when the price crosses above both the lowest price criteria and the 50% Fibonacci level.
shortCondition: A short (sell) signal is generated when the price crosses below both the highest price criteria and the 50% Fibonacci level.
Executing Trades
Based on the longCondition and shortCondition, trades are entered with the strategy.entry() function, using the labels "Long" and "Short" for tracking on the chart.
Strategy Use
This strategy allows traders to utilize Fibonacci retracement levels and recent highs/lows to identify trend continuation or reversal points, potentially providing entry points aligned with larger market structure. Adjusting the lowestLookback and highestLookback along with Fibonacci levels enables a customizable approach to suit different trading styles and market conditions.

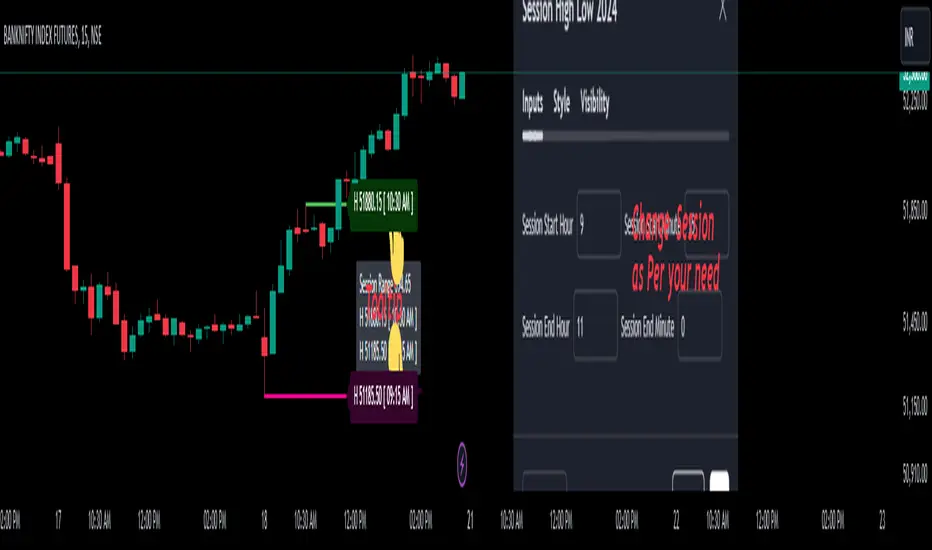
Session High Low 2024
Overview of the Code:
Input for Session Times:
You set up inputs for the start and end times of the trading session, allowing you to customize them as needed.
Time Range Function:
A function isTimeInRange checks whether the current time falls within the specified session start and end times.
initialize High and Low:
indicator initialize session high, low, and their corresponding labels and lines.
Tracking Session High and Low:
Within the specified time range, continuously update session1High and session1Low based on the highest and lowest prices encountered.
Time of Session High/Low:
The High_Time and Low_Time are tracked using the ta.valuewhen() function to capture the exact times when the session high and low occur.
Notes Creation:
You format the high and low values along with their timestamps to create notes that will be displayed alongside the lines.
Drawing Lines and Labels:
After the session ends, you check if there is a new session high or low and draw lines and labels accordingly. If a line or label already exists, you delete it before drawing a new one.
Resetting for Next Session:
At the end of the session, the high and low values are reset for the next session.
Suggestions for Improvement:
Dynamic Line Extensions:
Clear Variable Names Used in Code:
Consider using more descriptive names for variables like Entry_Point and SL_Point to make the code easier to understand.
Commenting:
Although the code is well-commented, always ensure the comments explain the "why" behind the code rather than just the "what."
Example Output:
The output will show the highest and lowest prices during the specified session times and the times they occurred formatted correctly. This output is useful for quick reference during trading and aids in making informed decisions.
Added functionality tool tip Note:
Added a tooltip Note to Get All information of Session High Low & Range.
If you need further modifications, enhancements, or specific functionalities added to this script, please let me know!
Relative Equal Highs/LowsThis Pine script indicator is designed to create a visual representation of the relative equal highs & lows formed and automatically removed mitigated ones. Unlike indicators designed to show exact equal high/lows this indicator allows a small, configurable degree of variance between price to identify areas where price stops.
Relevance:
Relative Equal highs and lows can serve as valuable tools in identifying potential shifts in trend direction. They come into play when the price hits a support or resistance level and can’t advance further, signaling a possible reversal or pivot point. When the price sufficiently retreats from these levels, relative equal highs and lows can also indicate liquidity draws where buy/sell stops might be positioned, in accordance with SMC/ICT concepts.
How It Works:
The indicator tracks all unmitigated highs & lows within the chart’s present timeframe, limited to the user-defined max bars lookback for optimal performance. If the prices are within the configured variance they are marked as relatively equal and at that point are visually identified by a horizontal line, which connects the two (or more) points of price. Depending on configuration of the indicator, a line is rendered from the 1st, last or both values within the relatively equal range of price. A unique feature of this indicator is its ability to remove the line once the price mitigates the relative equal high/low by falling below the lows or rising above highs. This ensures the chart remains uncluttered and highlights only the currently relevant levels, setting it apart from other indicators providing similar functionality.
Configurability:
The indicator offers five style settings for complete customization of the lines that represent equal highs/lows. These settings include line style, color, and width, along with an option to extend the lines to the right of the chart for enhanced visibility of equal high/low levels. To optimize performance, the indicator allows users to configure the lookback length, determining how far back the price history should be examined. In most instances, the default setting of 500 bars proves more than adequate. Additionally, you can set thresholds via separate configs for stocks & indices that will determine if the price is relatively equal and lastly allow you to configure where the indicator line should be drawn, the first, last or all the values.
Additional notes:
This uses a different approach then my “equal highs/lows” indicator to identify price levels and because it focuses specifically on relative as opposed to exact values it is entirely different and may show “weaker”, but still important levels of liquidity. This indicator is more suited for analysis of stocks and indices or higher-timeframes where price-action rarely forms exact equal values instead more frequently forming almost equal values. My other indicator is more suited for smaller (15m or less) timeframe on indices where exact equal prices are often identical. Depending on situation different indicators should be used.

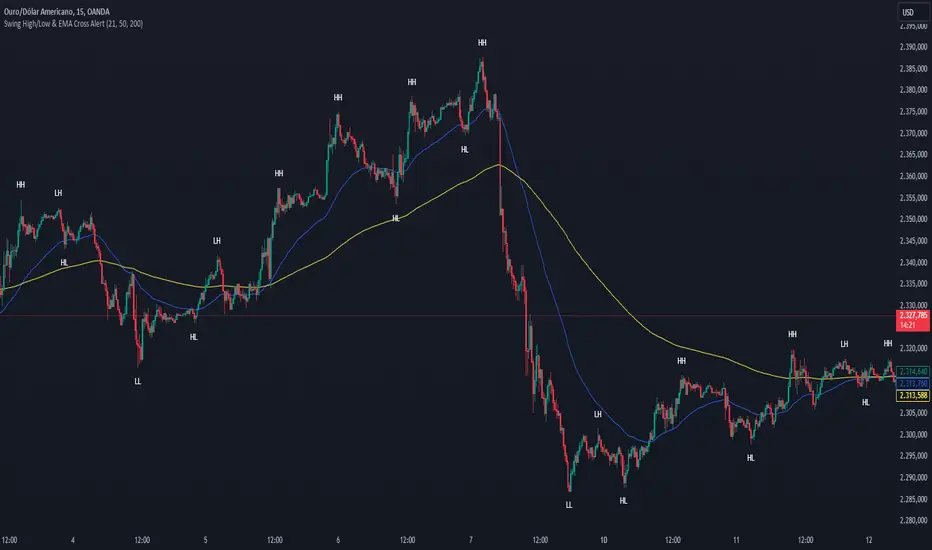
Swing High/Low & EMA Cross AlertScript Description:
This script on TradingView combines the detection of Swing High/Low points with exponential moving average (EMA) crossovers to provide buy and sell alerts and to mark swing points on the chart.
What the Script Does:
Swing High/Low Detection:
Uses the ta.pivothigh function to detect significant high points and the ta.pivotlow function to detect significant low points.
For each detected point, the script checks if it is a new higher high (HH) or lower high (LH) for the highs, and a new lower low (LL) or higher low (HL) for the lows.
Creates visual labels to identify these points on the chart, helping traders to visualize potential reversal points.
EMA Crossover:
Calculates two EMAs: a fast EMA (fastEMA) with a default period of 50 and a slow EMA (slowEMA) with a default period of 200.
Detects bullish crossovers (when fastEMA crosses above slowEMA) and bearish crossunders (when fastEMA crosses below slowEMA).
Generates buy and sell alerts based on these crossovers.
How the Script Works:
EMA Calculation: EMAs are calculated using the closing prices and user-defined periods.
Swing High/Low Detection: Uses the high and low values from the previous length bars to determine the swing points.
Alert Generation: Alerts are triggered when crossovers between the EMAs occur.
How to Use the Script:
Add to Chart: Insert the script into TradingView and apply it to the desired chart.
Configure Parameters:
Adjust the detection period for swing points (length).
Configure the periods for the EMAs (fastLen and slowLen).
Customize the colors for the swing point labels as per your preference.
Monitor Alerts: Use the EMA crossover alerts to make buy or sell decisions. Observe the swing point labels to identify potential trend reversals.
Justification for the Combination:
EMAs: Widely used to identify trend direction. Combining a fast EMA with a slow EMA helps capture both short-term and long-term trend changes.
Swing High/Low: Identifies reversal points in price, which are crucial for determining potential entry and exit points in trades.
Combination:
Combining EMAs and Swing High/Low provides a comprehensive view of price behavior, helping traders to effectively identify trends and reversal points.
This script is useful for traders who want to combine trend analysis (via EMAs) with the identification of reversal points (Swing High/Low), providing a more complete view of price behavior on the chart.
High-Low DifferenceThe "High-Low Difference" indicator calculates the difference between the high and low prices within a specified period. In technical analysis, the high and low prices of an asset over a given period can provide valuable insights into the price volatility and trading range. By subtracting the low price from the high price, this indicator quantifies the range covered by price movements during the selected timeframe.
Understanding the high-low difference is essential for traders and analysts to gauge the volatility and potential price movements of an asset. A larger difference indicates higher volatility, implying greater price fluctuation within the chosen period. Conversely, a smaller difference suggests lower volatility, indicating relatively stable price movements.
Traders often use the high-low difference as part of their technical analysis toolkit to identify potential trading opportunities. For instance, a significant increase in the high-low difference may signal a breakout or increased market activity, prompting traders to adjust their trading strategies accordingly. Conversely, a narrowing high-low difference may indicate decreased volatility or a period of consolidation, suggesting potential price range-bound trading conditions.
Overall, the high-low difference serves as a simple yet valuable metric for understanding price volatility, identifying trading opportunities, and making informed decisions in the financial markets.

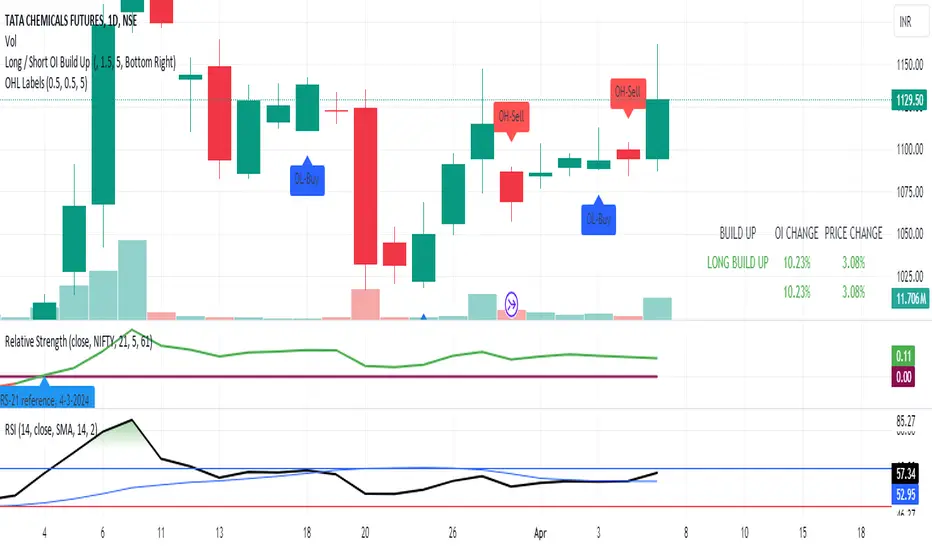
OPEN=HIGH/LOW LabelsIntroduction:
The "OPEN=HIGH/LOW Labels" script is designed to visually indicate instances where the opening price is equal to the high or low price of the candle. It overlays labels on the chart to highlight these conditions, providing traders with additional insights into price action.
Key Features:
Customizable Inputs: Traders can adjust parameters such as the maximum percentage difference between the opening price and the high/low prices, as well as the maximum number of labels to display.
Buy and Sell Conditions: The script defines conditions for both buy and sell scenarios based on whether the low price is equal to or greater than the opening price (indicating potential buying interest) or the high price is equal to or less than the opening price (indicating potential selling interest).
Limited Label Display: To prevent clutter on the chart, the script limits the number of labels displayed by removing older labels when the maximum number is reached.
Usage:
High Price Max % : Adjust this parameter to set the maximum percentage difference allowed between the opening price and the high price of the candle.
Low Price Max %: Set the maximum percentage difference allowed between the opening price and the low price of the candle.
Max Labels: Define the maximum number of labels to be displayed on the chart.
Interpretation:
OL-Buy Label: This label is displayed when the low price of the candle is equal to or greater than the opening price, indicating potential buying interest.
OH-Sell Label: This label is displayed when the high price of the candle is equal to or less than the opening price, suggesting potential selling interest.
Conclusion:
The "OPEN=HIGH/LOW Labels" script is a useful tool for traders to identify instances where the opening price aligns closely with the high or low price of a candle. By customizing parameters and interpreting the labels, traders can gain valuable insights into market sentiment and potential trading opportunities.
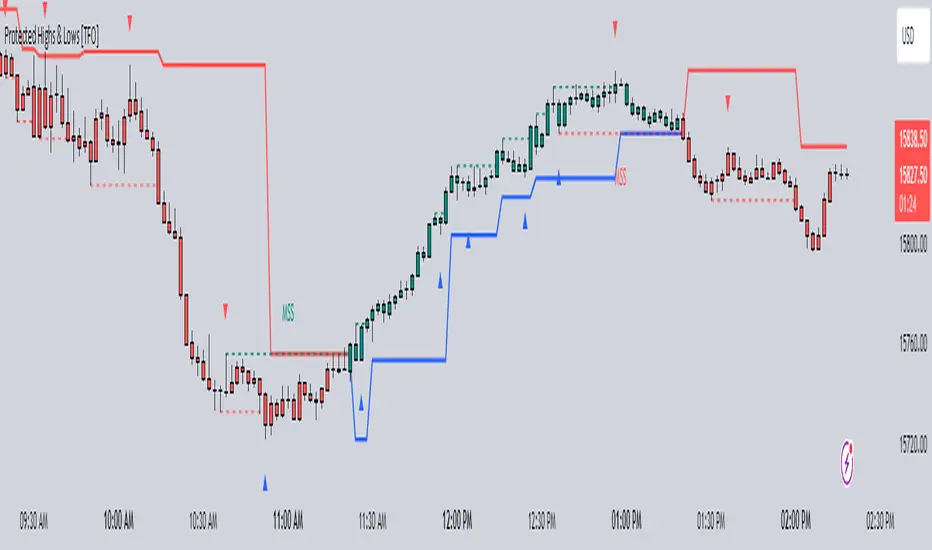
Protected Highs & Lows [TFO]This indicator presents an alternative approach to identify Market Structure. The logic used is derived from learning material created by @DaveTeaches
When quantifying Market Structure, it is common to use fractal highs and lows to identify "significant" swing pivots. When price closes through these pivots, we may identify a Market Structure Shift (MSS) for reversals or a Break of Structure (BOS) for continuations. The main difference with this "protected" logic is in how we determine the pivots/levels that are utilized to determine a valid MSS or BOS.
Nonetheless, the significance of our swing pivots is still governed by the input Pivot Strength parameter, which requires valid swing pivots to be compared to this many bars to the left and right of them. This is an optional parameter as it is traditionally set to 1 by default.
When identifying a BOS: When price closes below a valid swing low, we look back from the current bar to find the highest high that was made in that range. This becomes our protected high; similarly, when price closes above a valid swing high, we look back from the current bar to find the lowest low that was made in that range, which then becomes our protected low.
Note these valid highs and lows are the first swing pivots created after a MSS/BOS. For example, when price makes a bullish BOS/MSS and then trades away, a swing high is formed. This first swing high is what needs to be traded through to see a valid BOS.
When identifying a MSS: If the current trend is bearish and we're looking for a bullish reversal, we would need price to close above the most recent protected high. When this happens, we still look back to find the lowest low that was created in that range, and make that our new protected low. Likewise when looking for a bearish reversal, price would need to close below the most recent protected low, which would then give us a new protected high as a result (the highest point in that range).
The Trend Candles option allows users to easily visualize the current state of Market Structure with bullish and bearish colors. Users may also show BOS and MSS labels if desired.
Show Protected Highs & Lows will annotate the protected highs and lows, just note that the labels themselves are plotted in the past due to the lookback function required to identify them.
Lastly, the Show Protected Trail option will draw a line to essentially indicate a trailing stop-like line to denote the most recent protected low (if bullish) or protected high (if bearish).
I am simply a student of Dave's concepts, so please feel free to leave feedback if you are familiar with his concepts and have suggestions/improvements.
Opening Range & Prior Day High/Low [Gorb]Introduction:
Opening Range & Prior Day High/Low indicator is an easy to use day traders tool. This indicator automatically plots the previous days high and low, as well as drawing a box from the opening range that the user specifies in the settings. These two together can help provide an indication of market sentiment and price trends for the day. They are often used as a trading strategy for day traders.
Overview:
The Opening Range , draws a box from the high to the low of the user defined time period and is extended until the end of the trading session. Most common are the 5/15/30min opening ranges.
Prior Day High/Low , draws lines from the previous days high and low that extend across the current session. These are used as support/resistance and also a marker to see market sentiment by crossing one of these levels.
The indicator is designed for all kinds of traders, offering a simple approach to automatically plot levels for you.
Features:
All skill-level friendly presets, easy to enable with one-click
Opening Range: Allows user to choose what time the range starts and ends to measure the high & low.
Extend Range Lines: allows the user to choose when the box stops extending according to the trading session time.
Enable Opening Range Box: allows the user to choose to plot the opening range or not.
ORB Border Color: allows the user to change the box border color.
ORB Box Shade Color: allows the user to change the background of the opening range box.
ORB Line Width: allows users to chose the width of the opening range box lines.
Enable Previous Day High: allows users to enable the previous days high to be plotted.
Enable Previous Day Low: allows users to enable the previous days high to be plotted.
Previous Day High Color: allows users to choose the color for this line.
Previous Day Low Color: allows users to choose the color for this line.
All colors are changeable for the user to customize to their liking.
Usage Demonstration
In the image below, we can see a basic example of how these 3 features function.
As explained above, the opening range is customizable to meet the users needs and can be disabled with one click. Same goes for the prior day high(green) and low(red) lines. All 3 are plotted each day automatically for the user if enabled.
In the image below, we can see an example of using the opening range break and prior day high together for a trading strategy.
This is a great example of using the prior day high with the opening range to use as a day trading strategy. It provides the trader with levels to watch for price to break out from for possible trade setups.
In this next image, we can see a failed breakdown from the opening range that results in a bullish breakout.
The first move was a fake breakdown with the failed rejection on the retest of the opening range lows. This led to a breakout above the range and a confirmation bounce on the breakout retest. Price did break above the prior day high and confirmed with a retest bounce on that level as well.
In the image below, we can see how previous days levels can act as resistance to use with the opening range.
Price didn't reject the opening range low, but it did reject the prior day high for the second time. This could be used as an entry or once price breaks down out of the opening range again.
Conclusion:
We believe in providing user-friendly tools to help speed up traders technical analysis and implement easy trading strategies. The goal is to provide a user-friendly indicator to automatically draw opening ranges and previous days levels to suit the users needs and trading style.
RISK DISCLAIMER
All content, tools, scripts & education provided by Monstanzer or Gorb Algo LLC are for informational & educational purposes only. Trading is risk and most lose their money, past performance does not guarantee future results.

DB Support Resistance Levels + Smart Higher Highs and Lower LowsDB Support Resistance Levels + Smart Higher Highs and Lower Lows
The indicator plots historic lines for high, low and close prices shown in settings as "base levels". Users can control the lookback period that is plotted along with an optional multiplier. Traders will notice that the price bounces off these historic base levels. The base levels are shown as light gray by default (customizable in the settings). Users may choose to display base levels by a combination of historic high, low and close values.
On top of the historic base levels, the indicator display higher high and lower low levels from the current bar high/low. Higher highs are shown by default in pink and lower lows by default in yellow. The user can adjust the lookback period for displaying higher highs and the optional multiplier. Only historic values higher than the current bar high are displayed filtering out (by highlighting) the remaining levels for the current bar. Users may choose to use a combination of historic open, low and close values for displaying higher highs. The user can adjust the lookback period for displaying lower lows and the optional multiplier. Only historic values lower than the current bar low are displayed filtering out (by highlighting) the remaining levels for the current bar. Users may choose to use a combination of historic open, low and close values for displaying lower low.
The indicator includes two optional filters for filtering out higher highs and lower lows to focus (highlight) the most relevant levels. The filters include KC and a simple price multiplier filter. The latter is enabled by default and recommended.
The indicator aims to provide two things; first a simple plot of historic base levels and second as the price moves to highlight the most relevant levels for the current price action. While the indicator works on all timeframes, it was tested with the weekly. Please keep in mind adjusting the timeframe may require the lookback settings to be adjusted to ensure the bars are within range.
How should I use this indicator?
Traders may use this indicator to gain a visual reference of support and resistance levels from higher periods of time with the most likely levels highlighted in pink and yellow. Replaying the indicator gives a visual show of levels in action and just how very often price action bounces from these highlighted levels.
Additional Notes
This indicator does increase the max total lines allowed which may impact performance depending on device specs. No alerts or signals for now. Perhaps coming soon...
