HTF TriangleHTF Triangle by ZeroHeroTrading aims at detecting ascending and descending triangles using higher time frame data, without repainting nor misalignment issues.
It addresses user requests for combining Ascending Triangle and Descending Triangle into one indicator.
Ascending triangles are defined by an horizontal upper trend line and a rising lower trend line. It is a chart pattern used in technical analysis to predict the continuation of an uptrend.
Descending triangles are defined by a falling upper trend line and an horizontal lower trend line. It is a chart pattern used in technical analysis to predict the continuation of a downtrend.
This indicator can be useful if you, like me, believe that higher time frames can offer a broader perspective and provide clearer signals, smoothing out market noise and showing longer-term trends.
You can change the indicator settings as you see fit to tighten or loosen the detection, and achieve the best results for your use case.
Features
It draws the detected ascending and descending triangles on the chart.
It supports alerting when a detection occurs.
It allows for selecting ascending and/or descending triangle detection.
It allows for setting the higher time frame to run the detection on.
It allows for setting the minimum number of consecutive valid higher time frame bars to fit the pattern criteria.
It allows for setting a high/low factor detection criteria to apply on higher time frame bars high/low as a proportion of the distance between the reference bar high/low and open/close.
It allows for turning on an adjustment of the triangle using highest/lowest values within valid higher time frame bars.
Settings
Ascending checkbox: Turns on/off ascending triangle detection. Default is on.
Descending checkbox: Turns on/off descending triangle detection. Default is on.
Higher Time Frame dropdown: Selects higher time frame to run the detection on. It must be higher than, and a multiple of, the chart's timeframe. Default is 5 minutes.
Valid Bars Minimum field: Sets minimum number of consecutive valid higher time frame bars to fit the pattern criteria. Default is 3. Minimum is 1.
High/Low Factor checkbox: Turns on/off high/low factor detection criteria. Default is on.
High/Low Factor field: Sets high/low factor to apply on higher time frame bars high/low as a proportion of the distance between the reference bar high/low and open/close. Default is 0. Minimum is 0. Maximum is 1.
Adjust Triangle checkbox: Turns on/off triangle adjustment using highest/lowest values within valid higher time frame bars. Default is on.
Detection Algorithm Notes
The detection algorithm recursively selects a higher time frame bar as reference. Then it looks at the consecutive higher time frame bars (as per the requested number of minimum valid bars) as follows:
Ascending Triangle
Low must be higher than previous bar.
Open/close max value must be lower than (or equal to) reference bar high.
When high/low factor criteria is turned on, high must be higher than (or equal to) reference bar open/close max value plus high/low factor proportion of the distance between reference bar high and open/close max value.
Descending Triangle
High must be lower than previous bar.
Open/close min value must be higher than (or equal to) reference bar low.
When high/low factor criteria is turned on, low must be lower than (or equal to) reference bar open/close min value minus high/low factor proportion of the distance between reference bar low and open/close min value.
ค้นหาในสคริปต์สำหรับ "low"

Power Trends [UkutaLabs]█ OVERVIEW
The Power Trends Indicator is a versatile trading toolkit that offers unique insight into key price levels in the market. This script uses currently relevant price-action information to automatically detect pivot levels and use them to create powerful trendlines.
The aim of this script is to improve the trading experience of users by offering a versatile toolkit that can be used in a wide variety of trading strategies to help simplify the complexities of the market.
█ USAGE
The Power Trends Indicator will automatically identify pivot points in real-time using recent price-action information to ensure that all points being identified are relevant. Using these pivot points, the script then draws powerful trend lines that can be used as levels of resistance and support.
To ensure that only the most relevant information is being presented, only the most recent trend lines will be displayed on the user’s charts. As new trend lines are being drawn, older trend lines will become thinner so that traders can identify the most relevant lines at a glance.
The price of the most recent high and low pivot points will also be displayed on the chart and can be used as further levels of resistance and support.
When a recent pivot level is broken, it will be identified as a Break of Structure. This signifies that there may have been a change in market strength.
The Power Trends Indicator also supports multiple time frame mapping, allowing you to mirror the trend lines that would be drawn on higher time frame charts onto lower time frame charts. This feature allows traders to be aware of the market structure of multiple charts at a glance from a single chart.
When mirroring some higher time frame trend lines, lines may appear to not align properly with current time frame bars. This is done intentionally to ensure lines are being drawn accurately to their position on the higher time frame charts.
█ SETTINGS
Current Time Frame
• Display (On/Off): Determines whether or not trend lines are drawn from the current time frame.
• High Color: Determines the color of trend lines drawn on high pivots.
• Low Color: Determines the color of trend lines drawn on low pivots.
5 Minute (Higher Time Frame)
• Display (On/Off): Determines whether or not trend lines are drawn from the 5 minute higher time frame.
• High Color: Determines the color of trend lines drawn on high pivots from the 5 minute higher time frame.
• Low Color: Determines the color of trend lines drawn on low pivots from the 5 minute higher time frame.
15 Minute (Higher Time Frame)
• Display (On/Off): Determines whether or not trend lines are drawn from the 15 minute higher time frame.
• High Color: Determines the color of trend lines drawn on high pivots from the 15 minute higher time frame.
• Low Color: Determines the color of trend lines drawn on low pivots from the 15 minute higher time frame.
30 Minute (Higher Time Frame)
• Display (On/Off): Determines whether or not trend lines are drawn from the 30 minute higher time frame.
• High Color: Determines the color of trend lines drawn on high pivots from the 30 minute higher time frame.
• Low Color: Determines the color of trend lines drawn on low pivots from the 30 minute higher time frame.
60 Minute (Higher Time Frame)
• Display (On/Off): Determines whether or not trend lines are drawn from the 60 minute higher time frame.
• High Color: Determines the color of trend lines drawn on high pivots from the 60 minute higher time frame.
• Low Color: Determines the color of trend lines drawn on low pivots from the 60 minute higher time frame.
240 Minute (Higher Time Frame)
• Display (On/Off): Determines whether or not trend lines are drawn from the 240 minute higher time frame.
• High Color: Determines the color of trend lines drawn on high pivots from the 240 minute higher time frame.
• Low Color: Determines the color of trend lines drawn on low pivots from the 240 minute higher time frame.
Daily (Higher Time Frame)
• Display (On/Off): Determines whether or not trend lines are drawn from the daily time frame.
• High Color: Determines the color of trend lines drawn on high pivots from the daily higher time frame.
• Low Color: Determines the color of trend lines drawn on low pivots from the daily higher time frame.

Bull Bear Trend IndicatorIntroduction: Origin of the Swing Point Indicator
In the quest for a reliable indicator that accurately predicts trend directions and identifies valid highs and lows, the genesis of the Swing Point Indicator emerged. Faced with the challenge of finding a tool that provided comprehensive market analysis and actionable insights, the need for a novel solution became evident. Combining insights gleaned from market analysis and innovative algorithmic approaches, the Swing Point Indicator was born.
Enhanced Feature: Highs and Lows Labeling in Trend Direction
In addition to its core functionalities, the Swing Point Indicator incorporates an advanced feature that enhances the visualization of trend direction. This feature provides further clarity by selectively labeling highs and lows based on the prevailing trend, reinforcing the identification of higher highs and lower lows in uptrends and downtrends, respectively. Overlapping labels on highs and lows signify a potential trend change, providing traders with valuable insight into market reversals.
Detailed Description:
1. Uptrend Labeling:
- Higher Highs (Green Label with Price): In an uptrend, where higher highs are observed, the indicator labels these points with vibrant green color and includes the corresponding price value. This visually highlights the significance of higher highs as pivotal points in the upward trajectory of prices.
- Higher Lows (Red Marker without Text or Diamond): To complement the identification of higher highs, higher lows are marked with a distinct red marker or diamond, devoid of any accompanying text. While these points are crucial in delineating the ascending trend, their emphasis lies in their role as support levels, providing a foundation for upward price movements.
2. Downtrend Labeling:
- Lower Lows (Red Label with Price): Conversely, in a downtrend characterized by lower lows, the indicator labels these points with conspicuous red color, accompanied by the corresponding price value. Lower lows signify critical levels of downward price momentum, acting as indicators of potential bearish continuation.
- Lower Highs (Green Marker without Text or Diamond): Lower highs, indicative of downward retracements in a downtrend, are marked by distinctive green markers or diamonds without accompanying text. While these points denote temporary pauses or pullbacks in the bearish trend, their emphasis lies in their role as resistance levels, impeding upward price movements.
Functionality and Utility:
- Customizable Lookback Candle Count: Traders have the option to adjust the lookback candle count, which is set by default at 108 candles in the settings. This flexibility allows traders to tailor the indicator to their specific trading preferences and timeframes.
- Equal Highs or Lows Option: When enabled, the Swing Point Indicator can identify equal highs or equal lows, providing traders with additional insight into market dynamics.
- Formation Confirmation: A new higher high along with its higher low or a new lower low along with its lower high is confirmed after two candles have closed following the swing point candle. This ensures the reliability of the identified trend direction.
Conclusion:
The incorporation of selective labeling for highs and lows based on trend direction, alongside the introduction of customizable settings and formation confirmation criteria, enhances the effectiveness of the Swing Point Indicator. This feature-rich tool empowers traders with a nuanced understanding of market dynamics, highlighting critical price levels and trend reversals. By offering enhanced visualization, customizable options, and confirmation criteria, the Swing Point Indicator equips traders with the confidence and precision needed to navigate the markets successfully, contributing to more informed and profitable trading strategies.

PinBar and Bloom Pattern Concept (Zeiierman)█ Overview
The Precision PinBar and Bloom Pattern Concept by Zeiierman introduces two new patterns, which we call the Bloom Pattern and the Precision PinBar Pattern. These patterns are used in conjunction with market open, high, and low values from different periods and timeframes. Together, they form the basis of the "PinBar and Bloom Pattern Concept." The main idea is to identify key bullish and bearish candlestick patterns around key levels plotted on the chart.
The key levels are the Open, High, and Low from the current and previous periods of the selected timeframe. Users can choose how many previous periods to be drawn on the chart.
█ How It Works
The indicator operates by analyzing market data over selected timeframes. It uses inputs such as previous period open-high-low lines, timeframe selections, and pattern detection settings like Symmetry Precision and Range Threshold. These parameters allow the indicator to identify specific market conditions, including symmetrical movements in price and significant price range deviations, which form the basis of the Bloom and Precision PinBar patterns.
Symmetry Signal:
Purpose: To detect symmetry in price movements based on a precision threshold.
How It Works: This function calculates the symmetry of high and low prices within the specified precision. It returns two boolean values indicating whether the high and low prices are within the symmetry precision.
BaselineBound Pattern:
Purpose: To identify bullish or bearish patterns based on a range factor.
How It Works: The function calculates whether the current close price is within a certain range of the high-low difference of the previous period. It returns bullish and bearish signals based on these calculations.
█ ● Bloom Pattern
The Bloom Pattern is a unique candlestick pattern designed to identify significant trend reversals or continuations. It's not a single candlestick formation but a combination of a few elements that signal a potential strong move in the market.
⚪ Previous and Current Candle Analysis: The Bloom Pattern looks at the relationship between the current candle and the previous one. It checks whether the current candle's body (the range between its opening and closing prices) fully encompasses the body of the previous candle. This condition is known as "embodying."
⚪ Baseline Bound: The Baseline Bound concept involves comparing the closing price to a range established by the high and low of the previous candle, adjusted by a factor (the rangeFactor). This helps in identifying if the current price is showing a bullish or bearish tendency relative to the previous period's price movement.
⚪ Symmetry Signal: Additionally, it uses the Symmetry Signal, which measures the symmetry between the high and low prices of two consecutive candles.
⚪ Bullish and Bearish Signals: The combination of these conditions (embodying, baseline bound, and symmetry) results in either a bullish or bearish signal. A bullish signal suggests a potential upward trend, while a bearish signal indicates a possible downward trend.
█ ● Precision PinBar Pattern
The Precision PinBar Pattern is a refined version of the traditional Pin Bar, a well-known candlestick pattern used in trading. This pattern focuses on identifying market reversals with a high degree of accuracy.
⚪ Identification of Pin Bars: The function first identifies a pin bar, characterized by a small body and a long wick. The long wick indicates a rejection of certain price levels, and the small body shows little change between the opening and closing prices.
⚪ Tail and Body Length Analysis: The script calculates the length of the bar's tail (wick) and compares it to the length of the body. A qualifying pin bar typically has a tail at least three times longer than its body, suggesting a strong rejection of prices.
⚪ Positioning and Thresholds:
Open-Close Position: The function checks whether the opening and closing prices are within a certain threshold of the high or low of the bar, which helps in distinguishing between bullish and bearish pin bars.
⚪ Baseline Bound and Symmetry: Like the Bloom Pattern, it incorporates Baseline Bound and Symmetry Signal concepts to validate the significance of the pin bar.
⚪ Bullish and Bearish Signals: Depending on these factors, a bullish or bearish pin bar is identified. A bullish PinBar suggests potential upward price movement, while a bearish PinBar indicates possible downward price movement.
█ How to Use
Using the Bloom and Precision PinBar patterns in conjunction with key market levels, such as previous highs and lows, can be a powerful strategy for traders. These market levels often act as significant points of support and resistance, and combining them with the patterns can offer strong trade signals. Here's how traders can effectively utilize these patterns:
Identifying Key Market Levels
Previous Highs and Lows: These are the highest and lowest points reached in previous trading periods and are often considered strong levels of resistance (in the case of previous highs) and support (in the case of previous lows).
Using the Bloom Pattern
Near Previous Highs (Resistance): If a Bloom Pattern emerges near a previous high, it could indicate a potential bearish reversal. Traders might interpret this as a signal to consider short positions, especially if the pattern shows bearish characteristics.
Near Previous Lows (Support): Conversely, a bullish Bloom Pattern near a previous low could suggest a trend reversal to the upside. This could be a signal for traders to consider long positions.
Using the Precision PinBar Pattern
Precision PinBar at Resistance: A bearish Precision PinBar appearing near a previous high can be a strong signal for a potential downward move. This setup is often used by traders to enter short positions, anticipating a price rejection at this resistance level.
Precision PinBar at Support: Similarly, a bullish Precision PinBar at or near a previous low suggests that the market is rejecting lower prices, indicating potential upward momentum. This is typically used by traders as a cue to go long.
█ Settings
Previous Open-High-Low Lines: Determine the number of historical periods to analyze. Settings include toggling the visibility of lines and labels and specifying the number of periods.
Timeframe & Current Period: Select the timeframe for current market analysis. Options include different timeframes (e.g., 1H, 1D) and customization of line styles and colors.
Pattern Settings: Adjust the Symmetry Precision and Range Threshold to fine-tune the indicator's sensitivity to specific market movements.
Bloom & Precision PinBar Pattern: Enable or disable the detection of specific patterns and customize the visual representation of these patterns on the chart.
-----------------
Disclaimer
The information contained in my Scripts/Indicators/Ideas/Algos/Systems does not constitute financial advice or a solicitation to buy or sell any securities of any type. I will not accept liability for any loss or damage, including without limitation any loss of profit, which may arise directly or indirectly from the use of or reliance on such information.
All investments involve risk, and the past performance of a security, industry, sector, market, financial product, trading strategy, backtest, or individual's trading does not guarantee future results or returns. Investors are fully responsible for any investment decisions they make. Such decisions should be based solely on an evaluation of their financial circumstances, investment objectives, risk tolerance, and liquidity needs.
My Scripts/Indicators/Ideas/Algos/Systems are only for educational purposes!

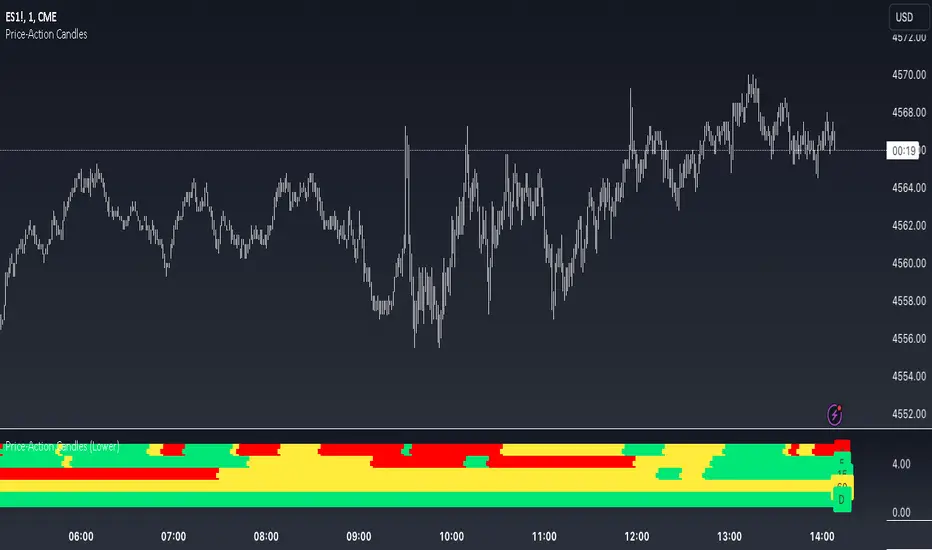
Price-Action Candles (Lower)What is a swing high or swing low?
Swing highs and lows are price extremes. For example say we set our swing length to 5. A candle that is a swing high with a swing length of 5 will have 5 bars to the left that are lower and 5 bars to the right that are lower. A candle that is a swing low with a swing length of 5 will have 5 bars to the left that are higher and 5 bars to the right that are higher.
How is the trend coloring calculated?
The trend coloring is calculated the exact same way as our trend candles study... by storing and comparing historical swing lows and swing highs.
The pinescript code goes as follows:
The pinescript code goes as follows:
var int trend = na
trend := ((hh and high >= psh) or close > csh) ? 1 : ((ll and low <= psl) or close < csl) ? -1 : lh or hl ? 0 : trend
What does that gibberish mean?
-Trend can be GREEN IF
- We have a higher high (current swing high is greater than the previous swing high) and the high is greater than the previous swing high
- OR The current close is greater than the current swing high
-Trend can be RED IF
- We have a lower low (current swing low is less than the previous swing low) and the low is less than the previous swing low
- OR The current close is less than the current swing low
-Trend can be YELLOW IF
- We have a new swing high and the new swing high is less than the previous swing high
- OR We have a new swing low and the new swing low is greater than the previous swing low
If none of the conditions above are true then we continue with whatever color the previous bar was.
What is repainting?
Repainting is "script behavior causing historical vs realtime calculations or plots to behave differently." That definition comes directly from Tradingview. If you want to read the full explanation you can visit it here www.tradingview.com . The price-action candles use swing highs and swing lows which need bars to the left (past) and bars to the right ("future") in order to confirm the swing level. Because of the need to wait for confirmation for swing levels the plot style can be repainting. The Price-Action Candles (Lower) indicator, or this indicator, has no repainting anywhere. We opt to not shift back the candle coloring which causes the repainting, but it is relevant to discuss since this indicator's sibling (Price-Action Candles) can have repainting labels.
Repaint
Here the labels are shifted back the price-action length. Repainting is not present in the Price-Candles (Lower) study, but can be found in this indicator's sibling (Price-Action Candles).
Non-Repaint
Here the labels are not shifted back or "repainted". Repainting is not present in the Price-Candles (Lower) study, but can be found in this indicator's sibling (Price-Action Candles).
Multi-timeframe Analysis
The users can view multi-timeframe historical price action trend via this lower study. Each timeframe is plotted as its own on the lower pane and you can determine what timeframe it is by the label next to the plot.
More examples
Pair the Price-Action Candles (Lower) indicator with our main price indicator that colors candles based on trend and can show price action labels.
Price-Action CandlesWhat is a swing high or swing low?
Swing highs and lows are price extremes. For example say we set our swing length to 5. A candle that is a swing high with a swing length of 5 will have 5 bars to the left that are lower and 5 bars to the right that are lower. A candle that is a swing low with a swing length of 5 will have 5 bars to the left that are higher and 5 bars to the right that are higher.
How are the trend candles calculated?
The trend candles are calculated by storing and comparing historical swing lows and swing highs.
The pinescript code goes as follows:
The pinescript code goes as follows:
var int trend = na
trend := ((hh and high >= psh) or close > csh) ? 1 : ((ll and low <= psl) or close < csl) ? -1 : lh or hl ? 0 : trend
What does that gibberish mean?
-Candle can be GREEN IF
- We have a higher high (current swing high is greater than the previous swing high) and the high is greater than the previous swing high
- OR The current close is greater than the current swing high
-Candle can be RED IF
- We have a lower low (current swing low is less than the previous swing low) and the low is less than the previous swing low
- OR The current close is less than the current swing low
-Candle can be YELLOW IF
- We have a new swing high and the new swing high is less than the previous swing high
- OR We have a new swing low and the new swing low is greater than the previous swing low
If none of the conditions above are true then we continue with whatever color the previous bar was.
What is repainting?
Repainting is "script behavior causing historical vs realtime calculations or plots to behave differently." That definition comes directly from Tradingview. If you want to read the full explanation you can visit it here www.tradingview.com . The price-action candles use swing highs and swing lows which need bars to the left (past) and bars to the right ("future") in order to confirm the swing level. Because of the need to wait for confirmation to for swing levels the plot style can be repainting. With the price-action candles indicator the only repainting part of the indicator is the labels. The price-action candles themselves WILL NOT REPAINT. The labels however can be set to repaint or not depending on the user preference. If the user opts to use repainting then the label location is shifted back by the length of the price-action. So if the "Price-Action Length" input is set to 10, and the user wants repainting, the swing high/low label will be shifted back 10 bars. If the user opts for no repainting, the label will not be shifted and instead show on the exact bar the swing level was confirmed.
Examples Below.
Repaint
Here the labels are shifted back the price-action length.
Non-Repaint
Here the labels are not shifted back because the input setting is set to not repaint.
Multi-timeframe Analysis
The users can view the trend from multiple different timeframes at once with a table displayed at the bottom of their charts. The timeframe can be lower or higher than the chart timeframe.
More examples
Be on the lookout for the Price Action Candles (Lower) indicator where you can view the multi-timeframe labels on a lower price grid in order to see the history over time!

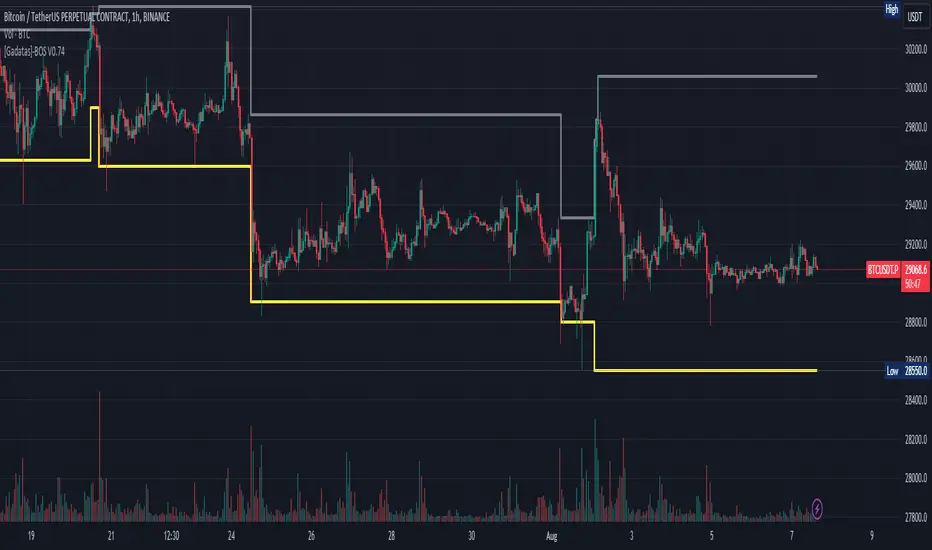
Brake Of Structure (BOS) By GadatasThis indicator is designed to identify and track swing highs and lows in a given market on any timeframe. It plots these swing highs and lows as solid lines on the chart. The indicator allows for customization of the line color and width and using another timeframe.
The indicator follows specific rules to determine when a new high or low is created. If the current range is considered bullish (meaning the most recent breakout was to the topside), the indicator will only update the low if a candle's body falls below the current low. However, if the current range is bearish (most recent breakout to the downside), the indicator will only update the high if a candle's body rises above the current high.
When a range is identified as bullish, the indicator will continue updating the high until a swing high is formed, denoting the high of the range. The high will only change if a candle's body surpasses the previous high. The low, on the other hand, will be updated based on the last time a candle's body falls below a previous candle's low. The lowest low after this condition is met will be assigned as the low of the range.
Conversely, when a range is identified as bearish, the indicator will continue updating the low until a swing low is formed, denoting the low of the range. The low will only change if a candle's body falls below the previous low. The high, in this case, will be updated based on the last time a candle's body rises above a previous candle's high. The highest high after this condition is met will be assigned as the high of the range.
Swing highs are determined by having lower highs to the left and right, while swing lows have higher lows to the left and right. These swings are used to determine the final high or low of a bullish or bearish range, respectively.
Tis Indicator differs from other indicators by incorporating this concept to track market structure. The indicator assumes that significant market players sell before making heavy purchases in bullish ranges and buy before selling heavily in bearish ranges. The lines on the chart represent prior highs and lows, as well as the current updated highs and lows based on this theory. By using this indicator, one can gain insights into the structure of price movement and potentially identify bullish or bearish continuations. It can also provide confluence when analyzing multiple timeframes to validate trend-following strategies.
CNTLibraryLibrary "CNTLibrary"
Custom Functions To Help Code In Pinescript V5
Coded By Christian Nataliano
First Coded In 10/06/2023
Last Edited In 22/06/2023
Huge Shout Out To © ZenAndTheArtOfTrading and his ZenLibrary V5, Some Of The Custom Functions Were Heavily Inspired By Matt's Work & His Pine Script Mastery Course
Another Shout Out To The TradingView's Team Library ta V5
//====================================================================================================================================================
// Custom Indicator Functions
//====================================================================================================================================================
GetKAMA(KAMA_lenght, Fast_KAMA, Slow_KAMA)
Calculates An Adaptive Moving Average Based On Perry J Kaufman's Calculations
Parameters:
KAMA_lenght (int) : Is The KAMA Lenght
Fast_KAMA (int) : Is The KAMA's Fastes Moving Average
Slow_KAMA (int) : Is The KAMA's Slowest Moving Average
Returns: Float Of The KAMA's Current Calculations
GetMovingAverage(Source, Lenght, Type)
Get Custom Moving Averages Values
Parameters:
Source (float) : Of The Moving Average, Defval = close
Lenght (simple int) : Of The Moving Average, Defval = 50
Type (string) : Of The Moving Average, Defval = Exponential Moving Average
Returns: The Moving Average Calculation Based On Its Given Source, Lenght & Calculation Type (Please Call Function On Global Scope)
GetDecimals()
Calculates how many decimals are on the quote price of the current market © ZenAndTheArtOfTrading
Returns: The current decimal places on the market quote price
Truncate(number, decimalPlaces)
Truncates (cuts) excess decimal places © ZenAndTheArtOfTrading
Parameters:
number (float)
decimalPlaces (simple float)
Returns: The given number truncated to the given decimalPlaces
ToWhole(number)
Converts pips into whole numbers © ZenAndTheArtOfTrading
Parameters:
number (float)
Returns: The converted number
ToPips(number)
Converts whole numbers back into pips © ZenAndTheArtOfTrading
Parameters:
number (float)
Returns: The converted number
GetPctChange(value1, value2, lookback)
Gets the percentage change between 2 float values over a given lookback period © ZenAndTheArtOfTrading
Parameters:
value1 (float)
value2 (float)
lookback (int)
BarsAboveMA(lookback, ma)
Counts how many candles are above the MA © ZenAndTheArtOfTrading
Parameters:
lookback (int)
ma (float)
Returns: The bar count of how many recent bars are above the MA
BarsBelowMA(lookback, ma)
Counts how many candles are below the MA © ZenAndTheArtOfTrading
Parameters:
lookback (int)
ma (float)
Returns: The bar count of how many recent bars are below the EMA
BarsCrossedMA(lookback, ma)
Counts how many times the EMA was crossed recently © ZenAndTheArtOfTrading
Parameters:
lookback (int)
ma (float)
Returns: The bar count of how many times price recently crossed the EMA
GetPullbackBarCount(lookback, direction)
Counts how many green & red bars have printed recently (ie. pullback count) © ZenAndTheArtOfTrading
Parameters:
lookback (int)
direction (int)
Returns: The bar count of how many candles have retraced over the given lookback & direction
GetSwingHigh(Lookback, SwingType)
Check If Price Has Made A Recent Swing High
Parameters:
Lookback (int) : Is For The Swing High Lookback Period, Defval = 7
SwingType (int) : Is For The Swing High Type Of Identification, Defval = 1
Returns: A Bool - True If Price Has Made A Recent Swing High
GetSwingLow(Lookback, SwingType)
Check If Price Has Made A Recent Swing Low
Parameters:
Lookback (int) : Is For The Swing Low Lookback Period, Defval = 7
SwingType (int) : Is For The Swing Low Type Of Identification, Defval = 1
Returns: A Bool - True If Price Has Made A Recent Swing Low
//====================================================================================================================================================
// Custom Risk Management Functions
//====================================================================================================================================================
CalculateStopLossLevel(OrderType, Entry, StopLoss)
Calculate StopLoss Level
Parameters:
OrderType (int) : Is To Determine A Long / Short Position, Defval = 1
Entry (float) : Is The Entry Level Of The Order, Defval = na
StopLoss (float) : Is The Custom StopLoss Distance, Defval = 2x ATR Below Close
Returns: Float - The StopLoss Level In Actual Price As A
CalculateStopLossDistance(OrderType, Entry, StopLoss)
Calculate StopLoss Distance In Pips
Parameters:
OrderType (int) : Is To Determine A Long / Short Position, Defval = 1
Entry (float) : Is The Entry Level Of The Order, NEED TO INPUT PARAM
StopLoss (float) : Level Based On Previous Calculation, NEED TO INPUT PARAM
Returns: Float - The StopLoss Value In Pips
CalculateTakeProfitLevel(OrderType, Entry, StopLossDistance, RiskReward)
Calculate TakeProfit Level
Parameters:
OrderType (int) : Is To Determine A Long / Short Position, Defval = 1
Entry (float) : Is The Entry Level Of The Order, Defval = na
StopLossDistance (float)
RiskReward (float)
Returns: Float - The TakeProfit Level In Actual Price
CalculateTakeProfitDistance(OrderType, Entry, TakeProfit)
Get TakeProfit Distance In Pips
Parameters:
OrderType (int) : Is To Determine A Long / Short Position, Defval = 1
Entry (float) : Is The Entry Level Of The Order, NEED TO INPUT PARAM
TakeProfit (float) : Level Based On Previous Calculation, NEED TO INPUT PARAM
Returns: Float - The TakeProfit Value In Pips
CalculateConversionCurrency(AccountCurrency, SymbolCurrency, BaseCurrency)
Get The Conversion Currecny Between Current Account Currency & Current Pair's Quoted Currency (FOR FOREX ONLY)
Parameters:
AccountCurrency (simple string) : Is For The Account Currency Used
SymbolCurrency (simple string) : Is For The Current Symbol Currency (Front Symbol)
BaseCurrency (simple string) : Is For The Current Symbol Base Currency (Back Symbol)
Returns: Tuple Of A Bollean (Convert The Currency ?) And A String (Converted Currency)
CalculateConversionRate(ConvertCurrency, ConversionRate)
Get The Conversion Rate Between Current Account Currency & Current Pair's Quoted Currency (FOR FOREX ONLY)
Parameters:
ConvertCurrency (bool) : Is To Check If The Current Symbol Needs To Be Converted Or Not
ConversionRate (float) : Is The Quoted Price Of The Conversion Currency (Input The request.security Function Here)
Returns: Float Price Of Conversion Rate (If In The Same Currency Than Return Value Will Be 1.0)
LotSize(LotSizeSimple, Balance, Risk, SLDistance, ConversionRate)
Get Current Lot Size
Parameters:
LotSizeSimple (bool) : Is To Toggle Lot Sizing Calculation (Simple Is Good Enough For Stocks & Crypto, Whilst Complex Is For Forex)
Balance (float) : Is For The Current Account Balance To Calculate The Lot Sizing Based Off
Risk (float) : Is For The Current Risk Per Trade To Calculate The Lot Sizing Based Off
SLDistance (float) : Is The Current Position StopLoss Distance From Its Entry Price
ConversionRate (float) : Is The Currency Conversion Rate (Used For Complex Lot Sizing Only)
Returns: Float - Position Size In Units
ToLots(Units)
Converts Units To Lots
Parameters:
Units (float) : Is For How Many Units Need To Be Converted Into Lots (Minimun 1000 Units)
Returns: Float - Position Size In Lots
ToUnits(Lots)
Converts Lots To Units
Parameters:
Lots (float) : Is For How Many Lots Need To Be Converted Into Units (Minimun 0.01 Units)
Returns: Int - Position Size In Units
ToLotsInUnits(Units)
Converts Units To Lots Than Back To Units
Parameters:
Units (float) : Is For How Many Units Need To Be Converted Into Lots (Minimun 1000 Units)
Returns: Float - Position Size In Lots That Were Rounded To Units
ATRTrail(OrderType, SourceType, ATRPeriod, ATRMultiplyer, SwingLookback)
Calculate ATR Trailing Stop
Parameters:
OrderType (int) : Is To Determine A Long / Short Position, Defval = 1
SourceType (int) : Is To Determine Where To Calculate The ATR Trailing From, Defval = close
ATRPeriod (simple int) : Is To Change Its ATR Period, Defval = 20
ATRMultiplyer (float) : Is To Change Its ATR Trailing Distance, Defval = 1
SwingLookback (int) : Is To Change Its Swing HiLo Lookback (Only From Source Type 5), Defval = 7
Returns: Float - Number Of The Current ATR Trailing
DangerZone(WinRate, AvgRRR, Filter)
Calculate Danger Zone Of A Given Strategy
Parameters:
WinRate (float) : Is The Strategy WinRate
AvgRRR (float) : Is The Strategy Avg RRR
Filter (float) : Is The Minimum Profit It Needs To Be Out Of BE Zone, Defval = 3
Returns: Int - Value, 1 If Out Of Danger Zone, 0 If BE, -1 If In Danger Zone
IsQuestionableTrades(TradeTP, TradeSL)
Checks For Questionable Trades (Which Are Trades That Its TP & SL Level Got Hit At The Same Candle)
Parameters:
TradeTP (float) : Is The Trade In Question Take Profit Level
TradeSL (float) : Is The Trade In Question Stop Loss Level
Returns: Bool - True If The Last Trade Was A "Questionable Trade"
//====================================================================================================================================================
// Custom Strategy Functions
//====================================================================================================================================================
OpenLong(EntryID, LotSize, LimitPrice, StopPrice, Comment, CommentValue)
Open A Long Order Based On The Given Params
Parameters:
EntryID (string) : Is The Trade Entry ID, Defval = "Long"
LotSize (float) : Is The Lot Size Of The Trade, Defval = 1
LimitPrice (float) : Is The Limit Order Price To Set The Order At, Defval = Na / Market Order Execution
StopPrice (float) : Is The Stop Order Price To Set The Order At, Defval = Na / Market Order Execution
Comment (string) : Is The Order Comment, Defval = Long Entry Order
CommentValue (string) : Is For Custom Values In The Order Comment, Defval = Na
Returns: Void
OpenShort(EntryID, LotSize, LimitPrice, StopPrice, Comment, CommentValue)
Open A Short Order Based On The Given Params
Parameters:
EntryID (string) : Is The Trade Entry ID, Defval = "Short"
LotSize (float) : Is The Lot Size Of The Trade, Defval = 1
LimitPrice (float) : Is The Limit Order Price To Set The Order At, Defval = Na / Market Order Execution
StopPrice (float) : Is The Stop Order Price To Set The Order At, Defval = Na / Market Order Execution
Comment (string) : Is The Order Comment, Defval = Short Entry Order
CommentValue (string) : Is For Custom Values In The Order Comment, Defval = Na
Returns: Void
TP_SLExit(FromID, TPLevel, SLLevel, PercentageClose, Comment, CommentValue)
Exits Based On Predetermined TP & SL Levels
Parameters:
FromID (string) : Is The Trade ID That The TP & SL Levels Be Palced
TPLevel (float) : Is The Take Profit Level
SLLevel (float) : Is The StopLoss Level
PercentageClose (float) : Is The Amount To Close The Order At (In Percentage) Defval = 100
Comment (string) : Is The Order Comment, Defval = Exit Order
CommentValue (string) : Is For Custom Values In The Order Comment, Defval = Na
Returns: Void
CloseLong(ExitID, PercentageClose, Comment, CommentValue, Instant)
Exits A Long Order Based On A Specified Condition
Parameters:
ExitID (string) : Is The Trade ID That Will Be Closed, Defval = "Long"
PercentageClose (float) : Is The Amount To Close The Order At (In Percentage) Defval = 100
Comment (string) : Is The Order Comment, Defval = Exit Order
CommentValue (string) : Is For Custom Values In The Order Comment, Defval = Na
Instant (bool) : Is For Exit Execution Type, Defval = false
Returns: Void
CloseShort(ExitID, PercentageClose, Comment, CommentValue, Instant)
Exits A Short Order Based On A Specified Condition
Parameters:
ExitID (string) : Is The Trade ID That Will Be Closed, Defval = "Short"
PercentageClose (float) : Is The Amount To Close The Order At (In Percentage) Defval = 100
Comment (string) : Is The Order Comment, Defval = Exit Order
CommentValue (string) : Is For Custom Values In The Order Comment, Defval = Na
Instant (bool) : Is For Exit Execution Type, Defval = false
Returns: Void
BrokerCheck(Broker)
Checks Traded Broker With Current Loaded Chart Broker
Parameters:
Broker (string) : Is The Current Broker That Is Traded
Returns: Bool - True If Current Traded Broker Is Same As Loaded Chart Broker
OpenPC(LicenseID, OrderType, UseLimit, LimitPrice, SymbolPrefix, Symbol, SymbolSuffix, Risk, SL, TP, OrderComment, Spread)
Compiles Given Parameters Into An Alert String Format To Open Trades Using Pine Connector
Parameters:
LicenseID (string) : Is The Users PineConnector LicenseID
OrderType (int) : Is The Desired OrderType To Open
UseLimit (bool) : Is If We Want To Enter The Position At Exactly The Previous Closing Price
LimitPrice (float) : Is The Limit Price Of The Trade (Only For Pending Orders)
SymbolPrefix (string) : Is The Current Symbol Prefix (If Any)
Symbol (string) : Is The Traded Symbol
SymbolSuffix (string) : Is The Current Symbol Suffix (If Any)
Risk (float) : Is The Trade Risk Per Trade / Fixed Lot Sizing
SL (float) : Is The Trade SL In Price / In Pips
TP (float) : Is The Trade TP In Price / In Pips
OrderComment (string) : Is The Executed Trade Comment
Spread (float) : is The Maximum Spread For Execution
Returns: String - Pine Connector Order Syntax Alert Message
ClosePC(LicenseID, OrderType, SymbolPrefix, Symbol, SymbolSuffix)
Compiles Given Parameters Into An Alert String Format To Close Trades Using Pine Connector
Parameters:
LicenseID (string) : Is The Users PineConnector LicenseID
OrderType (int) : Is The Desired OrderType To Close
SymbolPrefix (string) : Is The Current Symbol Prefix (If Any)
Symbol (string) : Is The Traded Symbol
SymbolSuffix (string) : Is The Current Symbol Suffix (If Any)
Returns: String - Pine Connector Order Syntax Alert Message
//====================================================================================================================================================
// Custom Backtesting Calculation Functions
//====================================================================================================================================================
CalculatePNL(EntryPrice, ExitPrice, LotSize, ConversionRate)
Calculates Trade PNL Based On Entry, Eixt & Lot Size
Parameters:
EntryPrice (float) : Is The Trade Entry
ExitPrice (float) : Is The Trade Exit
LotSize (float) : Is The Trade Sizing
ConversionRate (float) : Is The Currency Conversion Rate (Used For Complex Lot Sizing Only)
Returns: Float - The Current Trade PNL
UpdateBalance(PrevBalance, PNL)
Updates The Previous Ginve Balance To The Next PNL
Parameters:
PrevBalance (float) : Is The Previous Balance To Be Updated
PNL (float) : Is The Current Trade PNL To Be Added
Returns: Float - The Current Updated PNL
CalculateSlpComm(PNL, MaxRate)
Calculates Random Slippage & Commisions Fees Based On The Parameters
Parameters:
PNL (float) : Is The Current Trade PNL
MaxRate (float) : Is The Upper Limit (In Percentage) Of The Randomized Fee
Returns: Float - A Percentage Fee Of The Current Trade PNL
UpdateDD(MaxBalance, Balance)
Calculates & Updates The DD Based On Its Given Parameters
Parameters:
MaxBalance (float) : Is The Maximum Balance Ever Recorded
Balance (float) : Is The Current Account Balance
Returns: Float - The Current Strategy DD
CalculateWR(TotalTrades, LongID, ShortID)
Calculate The Total, Long & Short Trades Win Rate
Parameters:
TotalTrades (int) : Are The Current Total Trades That The Strategy Has Taken
LongID (string) : Is The Order ID Of The Long Trades Of The Strategy
ShortID (string) : Is The Order ID Of The Short Trades Of The Strategy
Returns: Tuple Of Long WR%, Short WR%, Total WR%, Total Winning Trades, Total Losing Trades, Total Long Trades & Total Short Trades
CalculateAvgRRR(WinTrades, LossTrades)
Calculates The Overall Strategy Avg Risk Reward Ratio
Parameters:
WinTrades (int) : Are The Strategy Winning Trades
LossTrades (int) : Are The Strategy Losing Trades
Returns: Float - The Average RRR Values
CAGR(StartTime, StartPrice, EndTime, EndPrice)
Calculates The CAGR Over The Given Time Period © TradingView
Parameters:
StartTime (int) : Is The Starting Time Of The Calculation
StartPrice (float) : Is The Starting Price Of The Calculation
EndTime (int) : Is The Ending Time Of The Calculation
EndPrice (float) : Is The Ending Price Of The Calculation
Returns: Float - The CAGR Values
//====================================================================================================================================================
// Custom Plot Functions
//====================================================================================================================================================
EditLabels(LabelID, X1, Y1, Text, Color, TextColor, EditCondition, DeleteCondition)
Edit / Delete Labels
Parameters:
LabelID (label) : Is The ID Of The Selected Label
X1 (int) : Is The X1 Coordinate IN BARINDEX Xloc
Y1 (float) : Is The Y1 Coordinate IN PRICE Yloc
Text (string) : Is The Text Than Wants To Be Written In The Label
Color (color) : Is The Color Value Change Of The Label Text
TextColor (color)
EditCondition (int) : Is The Edit Condition of The Line (Setting Location / Color)
DeleteCondition (bool) : Is The Delete Condition Of The Line If Ture Deletes The Prev Itteration Of The Line
Returns: Void
EditLine(LineID, X1, Y1, X2, Y2, Color, EditCondition, DeleteCondition)
Edit / Delete Lines
Parameters:
LineID (line) : Is The ID Of The Selected Line
X1 (int) : Is The X1 Coordinate IN BARINDEX Xloc
Y1 (float) : Is The Y1 Coordinate IN PRICE Yloc
X2 (int) : Is The X2 Coordinate IN BARINDEX Xloc
Y2 (float) : Is The Y2 Coordinate IN PRICE Yloc
Color (color) : Is The Color Value Change Of The Line
EditCondition (int) : Is The Edit Condition of The Line (Setting Location / Color)
DeleteCondition (bool) : Is The Delete Condition Of The Line If Ture Deletes The Prev Itteration Of The Line
Returns: Void
//====================================================================================================================================================
// Custom Display Functions (Using Tables)
//====================================================================================================================================================
FillTable(TableID, Column, Row, Title, Value, BgColor, TextColor, ToolTip)
Filling The Selected Table With The Inputed Information
Parameters:
TableID (table) : Is The Table ID That Wants To Be Edited
Column (int) : Is The Current Column Of The Table That Wants To Be Edited
Row (int) : Is The Current Row Of The Table That Wants To Be Edited
Title (string) : Is The String Title Of The Current Cell Table
Value (string) : Is The String Value Of The Current Cell Table
BgColor (color) : Is The Selected Color For The Current Table
TextColor (color) : Is The Selected Color For The Current Table
ToolTip (string) : Is The ToolTip Of The Current Cell In The Table
Returns: Void
DisplayBTResults(TableID, BgColor, TextColor, StartingBalance, Balance, DollarReturn, TotalPips, MaxDD)
Filling The Selected Table With The Inputed Information
Parameters:
TableID (table) : Is The Table ID That Wants To Be Edited
BgColor (color) : Is The Selected Color For The Current Table
TextColor (color) : Is The Selected Color For The Current Table
StartingBalance (float) : Is The Account Starting Balance
Balance (float)
DollarReturn (float) : Is The Account Dollar Reture
TotalPips (float) : Is The Total Pips Gained / loss
MaxDD (float) : Is The Maximum Drawdown Over The Backtesting Period
Returns: Void
DisplayBTResultsV2(TableID, BgColor, TextColor, TotalWR, QTCount, LongWR, ShortWR, InitialCapital, CumProfit, CumFee, AvgRRR, MaxDD, CAGR, MeanDD)
Filling The Selected Table With The Inputed Information
Parameters:
TableID (table) : Is The Table ID That Wants To Be Edited
BgColor (color) : Is The Selected Color For The Current Table
TextColor (color) : Is The Selected Color For The Current Table
TotalWR (float) : Is The Strategy Total WR In %
QTCount (int) : Is The Strategy Questionable Trades Count
LongWR (float) : Is The Strategy Total WR In %
ShortWR (float) : Is The Strategy Total WR In %
InitialCapital (float) : Is The Strategy Initial Starting Capital
CumProfit (float) : Is The Strategy Ending Cumulative Profit
CumFee (float) : Is The Strategy Ending Cumulative Fee (Based On Randomized Fee Assumptions)
AvgRRR (float) : Is The Strategy Average Risk Reward Ratio
MaxDD (float) : Is The Strategy Maximum DrawDown In Its Backtesting Period
CAGR (float) : Is The Strategy Compounded Average GRowth In %
MeanDD (float) : Is The Strategy Mean / Average Drawdown In The Backtesting Period
Returns: Void
//====================================================================================================================================================
// Custom Pattern Detection Functions
//====================================================================================================================================================
BullFib(priceLow, priceHigh, fibRatio)
Calculates A Bullish Fibonacci Value (From Swing Low To High) © ZenAndTheArtOfTrading
Parameters:
priceLow (float)
priceHigh (float)
fibRatio (float)
Returns: The Fibonacci Value Of The Given Ratio Between The Two Price Points
BearFib(priceLow, priceHigh, fibRatio)
Calculates A Bearish Fibonacci Value (From Swing High To Low) © ZenAndTheArtOfTrading
Parameters:
priceLow (float)
priceHigh (float)
fibRatio (float)
Returns: The Fibonacci Value Of The Given Ratio Between The Two Price Points
GetBodySize()
Gets The Current Candle Body Size IN POINTS © ZenAndTheArtOfTrading
Returns: The Current Candle Body Size IN POINTS
GetTopWickSize()
Gets The Current Candle Top Wick Size IN POINTS © ZenAndTheArtOfTrading
Returns: The Current Candle Top Wick Size IN POINTS
GetBottomWickSize()
Gets The Current Candle Bottom Wick Size IN POINTS © ZenAndTheArtOfTrading
Returns: The Current Candle Bottom Wick Size IN POINTS
GetBodyPercent()
Gets The Current Candle Body Size As A Percentage Of Its Entire Size Including Its Wicks © ZenAndTheArtOfTrading
Returns: The Current Candle Body Size IN PERCENTAGE
GetTopWickPercent()
Gets The Current Top Wick Size As A Percentage Of Its Entire Body Size
Returns: Float - The Current Candle Top Wick Size IN PERCENTAGE
GetBottomWickPercent()
Gets The Current Bottom Wick Size As A Percentage Of Its Entire Bodu Size
Returns: Float - The Current Candle Bottom Size IN PERCENTAGE
BullishEC(Allowance, RejectionWickSize, EngulfWick, NearSwings, SwingLookBack)
Checks If The Current Bar Is A Bullish Engulfing Candle
Parameters:
Allowance (int) : To Give Flexibility Of Engulfing Pattern Detection In Markets That Have Micro Gaps, Defval = 0
RejectionWickSize (float) : To Filter Out long (Upper And Lower) Wick From The Bullsih Engulfing Pattern, Defval = na
EngulfWick (bool) : To Specify If We Want The Pattern To Also Engulf Its Upper & Lower Previous Wicks, Defval = false
NearSwings (bool) : To Specify If We Want The Pattern To Be Near A Recent Swing Low, Defval = true
SwingLookBack (int) : To Specify How Many Bars Back To Detect A Recent Swing Low, Defval = 10
Returns: Bool - True If The Current Bar Matches The Requirements of a Bullish Engulfing Candle
BearishEC(Allowance, RejectionWickSize, EngulfWick, NearSwings, SwingLookBack)
Checks If The Current Bar Is A Bearish Engulfing Candle
Parameters:
Allowance (int) : To Give Flexibility Of Engulfing Pattern Detection In Markets That Have Micro Gaps, Defval = 0
RejectionWickSize (float) : To Filter Out long (Upper And Lower) Wick From The Bearish Engulfing Pattern, Defval = na
EngulfWick (bool) : To Specify If We Want The Pattern To Also Engulf Its Upper & Lower Previous Wicks, Defval = false
NearSwings (bool) : To Specify If We Want The Pattern To Be Near A Recent Swing High, Defval = true
SwingLookBack (int) : To Specify How Many Bars Back To Detect A Recent Swing High, Defval = 10
Returns: Bool - True If The Current Bar Matches The Requirements of a Bearish Engulfing Candle
Hammer(Fib, ColorMatch, NearSwings, SwingLookBack, ATRFilterCheck, ATRPeriod)
Checks If The Current Bar Is A Hammer Candle
Parameters:
Fib (float) : To Specify Which Fibonacci Ratio To Use When Determining The Hammer Candle, Defval = 0.382 Ratio
ColorMatch (bool) : To Filter Only Bullish Closed Hammer Candle Pattern, Defval = false
NearSwings (bool) : To Specify If We Want The Doji To Be Near A Recent Swing Low, Defval = true
SwingLookBack (int) : To Specify How Many Bars Back To Detect A Recent Swing Low, Defval = 10
ATRFilterCheck (float) : To Filter Smaller Hammer Candles That Might Be Better Classified As A Doji Candle, Defval = 1
ATRPeriod (simple int) : To Change ATR Period Of The ATR Filter, Defval = 20
Returns: Bool - True If The Current Bar Matches The Requirements of a Hammer Candle
Star(Fib, ColorMatch, NearSwings, SwingLookBack, ATRFilterCheck, ATRPeriod)
Checks If The Current Bar Is A Hammer Candle
Parameters:
Fib (float) : To Specify Which Fibonacci Ratio To Use When Determining The Hammer Candle, Defval = 0.382 Ratio
ColorMatch (bool) : To Filter Only Bullish Closed Hammer Candle Pattern, Defval = false
NearSwings (bool) : To Specify If We Want The Doji To Be Near A Recent Swing Low, Defval = true
SwingLookBack (int) : To Specify How Many Bars Back To Detect A Recent Swing Low, Defval = 10
ATRFilterCheck (float) : To Filter Smaller Hammer Candles That Might Be Better Classified As A Doji Candle, Defval = 1
ATRPeriod (simple int) : To Change ATR Period Of The ATR Filter, Defval = 20
Returns: Bool - True If The Current Bar Matches The Requirements of a Hammer Candle
Doji(MaxWickSize, MaxBodySize, DojiType, NearSwings, SwingLookBack)
Checks If The Current Bar Is A Doji Candle
Parameters:
MaxWickSize (float) : To Specify The Maximum Lenght Of Its Upper & Lower Wick, Defval = 2
MaxBodySize (float) : To Specify The Maximum Lenght Of Its Candle Body IN PERCENT, Defval = 0.05
DojiType (int)
NearSwings (bool) : To Specify If We Want The Doji To Be Near A Recent Swing High / Low (Only In Dragonlyf / Gravestone Mode), Defval = true
SwingLookBack (int) : To Specify How Many Bars Back To Detect A Recent Swing High / Low (Only In Dragonlyf / Gravestone Mode), Defval = 10
Returns: Bool - True If The Current Bar Matches The Requirements of a Doji Candle
BullishIB(Allowance, RejectionWickSize, EngulfWick, NearSwings, SwingLookBack)
Checks If The Current Bar Is A Bullish Harami Candle
Parameters:
Allowance (int) : To Give Flexibility Of Harami Pattern Detection In Markets That Have Micro Gaps, Defval = 0
RejectionWickSize (float) : To Filter Out long (Upper And Lower) Wick From The Bullsih Harami Pattern, Defval = na
EngulfWick (bool) : To Specify If We Want The Pattern To Also Engulf Its Upper & Lower Previous Wicks, Defval = false
NearSwings (bool) : To Specify If We Want The Pattern To Be Near A Recent Swing Low, Defval = true
SwingLookBack (int) : To Specify How Many Bars Back To Detect A Recent Swing Low, Defval = 10
Returns: Bool - True If The Current Bar Matches The Requirements of a Bullish Harami Candle
BearishIB(Allowance, RejectionWickSize, EngulfWick, NearSwings, SwingLookBack)
Checks If The Current Bar Is A Bullish Harami Candle
Parameters:
Allowance (int) : To Give Flexibility Of Harami Pattern Detection In Markets That Have Micro Gaps, Defval = 0
RejectionWickSize (float) : To Filter Out long (Upper And Lower) Wick From The Bearish Harami Pattern, Defval = na
EngulfWick (bool) : To Specify If We Want The Pattern To Also Engulf Its Upper & Lower Previous Wicks, Defval = false
NearSwings (bool) : To Specify If We Want The Pattern To Be Near A Recent Swing High, Defval = true
SwingLookBack (int) : To Specify How Many Bars Back To Detect A Recent Swing High, Defval = 10
Returns: Bool - True If The Current Bar Matches The Requirements of a Bearish Harami Candle
//====================================================================================================================================================
// Custom Time Functions
//====================================================================================================================================================
BarInSession(sess, useFilter)
Determines if the current price bar falls inside the specified session © ZenAndTheArtOfTrading
Parameters:
sess (simple string)
useFilter (bool)
Returns: A boolean - true if the current bar falls within the given time session
BarOutSession(sess, useFilter)
Determines if the current price bar falls outside the specified session © ZenAndTheArtOfTrading
Parameters:
sess (simple string)
useFilter (bool)
Returns: A boolean - true if the current bar falls outside the given time session
DateFilter(startTime, endTime)
Determines if this bar's time falls within date filter range © ZenAndTheArtOfTrading
Parameters:
startTime (int)
endTime (int)
Returns: A boolean - true if the current bar falls within the given dates
DayFilter(monday, tuesday, wednesday, thursday, friday, saturday, sunday)
Checks if the current bar's day is in the list of given days to analyze © ZenAndTheArtOfTrading
Parameters:
monday (bool)
tuesday (bool)
wednesday (bool)
thursday (bool)
friday (bool)
saturday (bool)
sunday (bool)
Returns: A boolean - true if the current bar's day is one of the given days
AUSSess()
Checks If The Current Australian Forex Session In Running
Returns: Bool - True If Currently The Australian Session Is Running
ASIASess()
Checks If The Current Asian Forex Session In Running
Returns: Bool - True If Currently The Asian Session Is Running
EURSess()
Checks If The Current European Forex Session In Running
Returns: Bool - True If Currently The European Session Is Running
USSess()
Checks If The Current US Forex Session In Running
Returns: Bool - True If Currently The US Session Is Running
UNIXToDate(Time, ConversionType, TimeZone)
Converts UNIX Time To Datetime
Parameters:
Time (int) : Is The UNIX Time Input
ConversionType (int) : Is The Datetime Output Format, Defval = DD-MM-YYYY
TimeZone (string) : Is To Convert The Outputed Datetime Into The Specified Time Zone, Defval = Exchange Time Zone
Returns: String - String Of Datetime

Upper Candle Trends [theEccentricTrader]█ OVERVIEW
This indicator simply plots upper candle trends and should be used in conjunction with my Lower Candle Trends indicator as a visual aid to my Upper and Lower Candle Trend Counter indicator.
█ CONCEPTS
Green and Red Candles
• A green candle is one that closes with a close price equal to or above the price it opened.
• A red candle is one that closes with a close price that is lower than the price it opened.
Upper Candle Trends
• A higher high candle is one that closes with a higher high price than the high price of the preceding candle.
• A lower high candle is one that closes with a lower high price than the high price of the preceding candle.
• A double-top candle is one that closes with a high price that is equal to the high price of the preceding candle.
Lower Candle Trends
• A higher low candle is one that closes with a higher low price than the low price of the preceding candle.
• A lower low candle is one that closes with a lower low price than the low price of the preceding candle.
• A double-bottom candle is one that closes with a low price that is equal to the low price of the preceding candle.
Muti-Part Upper and Lower Candle Trends
• A multi-part higher high trend begins with the formation of a new higher high and continues until a new lower high ends the trend.
• A multi-part lower high trend begins with the formation of a new lower high and continues until a new higher high ends the trend.
• A multi-part higher low trend begins with the formation of a new higher low and continues until a new lower low ends the trend.
• A multi-part lower low trend begins with the formation of a new lower low and continues until a new higher low ends the trend.
█ FEATURES
Plots
Green up-arrows, with the number of the trend part, denote higher high trends. Red down-arrows, with the number of the trend part, denote lower high trends.
█ LIMITATIONS
Some higher timeframe candles on tickers with larger lookbacks such as the DXY , do not actually contain all the open, high, low and close (OHLC) data at the beginning of the chart. Instead, they use the close price for open, high and low prices. So, while we can determine whether the close price is higher or lower than the preceding close price, there is no way of knowing what actually happened intra-bar for these candles. And by default candles that close at the same price as the open price, will be counted as green.

Wavemeter [theEccentricTrader]█ OVERVIEW
This indicator is a representation of my take on price action based wave cycle theory. The indicator counts the number of confirmed wave cycles, keeps a rolling tally of the average wave length, wave height and frequency, and displays the statistics in a table. The indicator also displays the current wave measurements as an optional feature.
█ CONCEPTS
Green and Red Candles
• A green candle is one that closes with a high price equal to or above the price it opened.
• A red candle is one that closes with a low price that is lower than the price it opened.
Swing Highs and Swing Lows
• A swing high is a green candle or series of consecutive green candles followed by a single red candle to complete the swing and form the peak.
• A swing low is a red candle or series of consecutive red candles followed by a single green candle to complete the swing and form the trough.
Peak and Trough Prices (Basic)
• The peak price of a complete swing high is the high price of either the red candle that completes the swing high or the high price of the preceding green candle, depending on which is higher.
• The trough price of a complete swing low is the low price of either the green candle that completes the swing low or the low price of the preceding red candle, depending on which is lower.
Historic Peaks and Troughs
The current, or most recent, peak and trough occurrences are referred to as occurrence zero. Previous peak and trough occurrences are referred to as historic and ordered numerically from right to left, with the most recent historic peak and trough occurrences being occurrence one.
Wave Cycles
A wave cycle is here defined as a complete two-part move between a swing high and a swing low, or a swing low and a swing high. As can be seen in the example above, the first swing high or swing low will set the course for the sequence of wave cycles that follow; a chart that begins with a swing low will form its first complete wave cycle upon the formation of the first complete swing high and vice versa.
Wave Length
Wave length is here measured in terms of bar distance between the start and end of a wave cycle. For example, if the current wave cycle ends on a swing low the wave length will be the difference in bars between the current swing low and current swing high. In such a case, if the current swing low completes on candle 100 and the current swing high completed on candle 95, we would simply subtract 95 from 100 to give us a wave length of 5 bars.
Average wave length is here measured in terms of total bars as a proportion as total waves. The average wavelength is calculated by dividing the total candles by the total wave cycles.
Wave Height
Wave height is here measured in terms of current range. For example, if the current peak price is 100 and the current trough price is 80, the wave height will be 20.
Amplitude
Amplitude is here measured in terms of current range divided by two. For example if the current peak price is 100 and the current trough price is 80, the amplitude would be calculated by subtracting 80 from 100 and dividing the answer by 2 to give us an amplitude of 10.
Frequency
Frequency is here measured in terms of wave cycles per second (Hertz). For example, if the total wave cycle count is 10 and the amount of time it has taken to complete these 10 cycles is 1-year (31,536,000 seconds), the frequency would be calculated by dividing 10 by 31,536,000 to give us a frequency of 0.00000032 Hz.
Range
The range is simply the difference between the current peak and current trough prices, generally expressed in terms of points or pips.
█ FEATURES
Inputs
Show Sample Period
Start Date
End Date
Position
Text Size
Show Current
Show Lines
Table
The table is colour coded, consists of two columns and, as many as, nine rows. Blue cells display the total wave cycle count and average wave measurements. Green cells display the current wave measurements. And the final row in column one, coloured black, displays the sample period. Both current wave measurements and sample period cells can be hidden at the user’s discretion.
Lines
For a visual aid to the wave cycles, I have added a blue line that traces out the waves on the chart. These lines can be hidden at the user’s discretion.
█ HOW TO USE
The indicator is intended for research purposes, strategy development and strategy optimisation. I hope it will be useful in helping to gain a better understanding of the underlying dynamics at play on any given market and timeframe.
For example, the indicator can be used to compare the current range and frequency with the average range and frequency, which can be useful for gauging current market conditions versus historic and getting a feel for how different markets and timeframes behave.
█ LIMITATIONS
Some higher timeframe candles on tickers with larger lookbacks such as the DXY , do not actually contain all the open, high, low and close (OHLC) data at the beginning of the chart. Instead, they use the close price for open, high and low prices. So, while we can determine whether the close price is higher or lower than the preceding close price, there is no way of knowing what actually happened intra-bar for these candles. And by default candles that close at the same price as the open price, will be counted as green. You can avoid this problem by utilising the sample period filter.
The green and red candle calculations are based solely on differences between open and close prices, as such I have made no attempt to account for green candles that gap lower and close below the close price of the preceding candle, or red candles that gap higher and close above the close price of the preceding candle. I can only recommend using 24-hour markets, if and where possible, as there are far fewer gaps and, generally, more data to work with. Alternatively, you can replace the scenarios with your own logic to account for the gap anomalies, if you are feeling up to the challenge.
It is also worth noting that the sample size will be limited to your Trading View subscription plan. Premium users get 20,000 candles worth of data, pro+ and pro users get 10,000, and basic users get 5,000. If upgrading is currently not an option, you can always keep a rolling tally of the statistics in an excel spreadsheet or something of the like.

Candle Counter [theEccentricTrader]█ OVERVIEW
This indicator counts the number of confirmed candle scenarios on any given candlestick chart and displays the statistics in a table, which can be repositioned and resized at the user's discretion.
█ CONCEPTS
Green and Red Candles
A green candle is one that closes with a high price equal to or above the price it opened.
A red candle is one that closes with a low price that is lower than the price it opened.
Upper Candle Trends
A higher high candle is one that closes with a higher high price than the high price of the preceding candle.
A lower high candle is one that closes with a lower high price than the high price of the preceding candle.
A double-top candle is one that closes with a high price that is equal to the high price of the preceding candle.
Lower Candle Trends
A higher low candle is one that closes with a higher low price than the low price of the preceding candle.
A lower low candle is one that closes with a lower low price than the low price of the preceding candle.
A double-bottom candle is one that closes with a low price that is equal to the low price of the preceding candle.
█ FEATURES
Inputs
Start Date
End Date
Position
Text Size
Show Sample Period
Show Plots
Table
The table is colour coded, consists of three columns and twenty-two rows. Blue cells denote all candle scenarios, green cells denote green candle scenarios and red cells denote red candle scenarios.
The candle scenarios are listed in the first column with their corresponding total counts to the right, in the second column. The last row in column one, row twenty-two, displays the sample period which can be adjusted or hidden via indicator settings.
Rows two and three in the third column of the table display the total green and red candles as percentages of total candles. Rows four to nine in column three, coloured blue, display the corresponding candle scenarios as percentages of total candles. Rows ten to fifteen in column three, coloured green, display the corresponding candle scenarios as percentages of total green candles. And lastly, rows sixteen to twenty-one in column three, coloured red, display the corresponding candle scenarios as percentages of total red candles.
Plots
I have added plots as a visual aid to the various candle scenarios listed in the table. Green up-arrows denote higher high candles when above bar and higher low candles when below bar. Red down-arrows denote lower high candles when above bar and lower low candles when below bar. Similarly, blue diamonds when above bar denote double-top candles and when below bar denote double-bottom candles. These plots can also be hidden via indicator settings.
█ HOW TO USE
This indicator is intended for research purposes and strategy development. I hope it will be useful in helping to gain a better understanding of the underlying dynamics at play on any given market and timeframe. It can, for example, give you an idea of any inherent biases such as a greater proportion of green candles to red. Or a greater proportion of higher low green candles to lower low green candles. Such information can be very useful when conducting top down analysis across multiple timeframes, or considering trailing stop loss methods.
What you do with these statistics and how far you decide to take your research is entirely up to you, the possibilities are endless.
This is just the first and most basic in a series of indicators that can be used to study objective price action scenarios and develop a systematic approach to trading.
█ LIMITATIONS
Some higher timeframe candles on tickers with larger lookbacks such as the DXY, do not actually contain all the open, high, low and close (OHLC) data at the beginning of the chart. Instead, they use the close price for open, high and low prices. So, while we can determine whether the close price is higher or lower than the preceding close price, there is no way of knowing what actually happened intra-bar for these candles. And by default candles that close at the same price as the open price, will be counted as green. You can avoid this problem by utilising the sample period filter.
The green and red candle calculations are based solely on differences between open and close prices, as such I have made no attempt to account for green candles that gap lower and close below the close price of the preceding candle, or red candles that gap higher and close above the close price of the preceding candle. I can only recommend using 24-hour markets, if and where possible, as there are far fewer gaps and, generally, more data to work with. Alternatively, you can replace the scenarios with your own logic to account for the gap anomalies, if you are feeling up to the challenge.
It is also worth noting that the sample size will be limited to your Trading View subscription plan. Premium users get 20,000 candles worth of data, pro+ and pro users get 10,000, and basic users get 5,000. If upgrading is currently not an option, you can always keep a rolling tally of the statistics in an excel spreadsheet or something of the like.

TRADING MADE SIMPLEThis indicator shows market structure. The standard method of using Williams Highs and Lows as pivots, is something of an approximation.
What's original here is that we follow rules to confirm Local Highs and Local Lows, and strictly enforce that a Low can only follow a confirmed High and vice-versa.
-- Highs and Lows
To confirm a candle as a Local High, you need a later candle to Close below its Low. To confirm a Local Low, you need a Close above its High.
A Low can only follow a High (after it's been confirmed). You can't go e.g High, High, Low, Low, only High, Low, High, Low.
When price makes Higher Highs and Higher Lows, market structure is said to be bullish. When price makes Lower Lows and Lower Highs, it's bearish.
I've defined the in-between Highs and Lows as "Ranging", meaning, neutral. They could be trend continuation or reversal.
-- Bullish/Bearish Breaks
A Bullish break in market structure is when the Close of the current candle goes higher than the previous confirmed Local High.
A Bearish Break is when the Close of the current candle goes lower than the most recent confirmed Local Low.
I chose to use Close rather than High to reduce edge case weirdness. The breaking candle often ends up being a big one, thus the close of that candle can be a poor entry.
You can get live warnings by setting the alert to Options: Only Once, because during a candle, the current price is taken as the Close.
Breaks are like early warnings of a change in market bias, because you're not waiting for a High or Low to be formed and confirmed.
Buy The Dip / Sell The Rally
Buy The Dip is a label I gave to the first Higher Low in a bullish market structure. Sell The Rally is the first Lower High in a bearish market structure.
These *might* be good buying/selling opportunities, but you still need to do your own analysis to confirm that.
== USAGE ==
The point of knowing market structure is so you don't make bullish bets in a bearish market and vice versa -
or if you do at least you're aware that that's what you're doing, and hopefully have some overwhelmingly good reason to do so.
These are not signals to be traded on their own. You still need a trade thesis. Use with support & resistance and your other favourite indicators.
Works on any market on any timeframe. Be aware that market structure will be different on different timeframes.
IMPORTANT: If you're not seeing what you expect, check your settings and re-read this entire description carefully. Confirming Highs and Lows can get deceptively complex.

Bollinger Band Width PercentileIntroducing the Bollinger Band Width Percentile
Definitions :
Bollinger Band Width Percentile is derived from the Bollinger Band Width indicator.
It shows the percentage of bars over a specified lookback period that the Bollinger Band Width was less than the current Bollinger Band Width.
Bollinger Band Width is derived from the Bollinger Bands® indicator.
It quantitatively measures the width between the Upper and Lower Bands of the Bollinger Bands.
Bollinger Bands® is a volatility-based indicator.
It consists of three lines which are plotted in relation to a security's price.
The Middle Line is typically a Simple Moving Average.
The Upper and Lower Bands are typically 2 standard deviations above, and below the SMA (Middle Line).
Volatility is a statistical measure of the dispersion of returns for a given security or market index, measured by the standard deviation of logarithmic returns.
The Broad Concept :
Quoting Tradingview specifically for commonly noted limitations of the BBW indicator which I have based this indicator on....
“ Bollinger Bands Width (BBW) outputs a Percentage Difference between the Upper Band and the Lower Band.
This value is used to define the narrowness of the bands.
What needs to be understood however is that a trader cannot simply look at the BBW value and determine if the Band is truly narrow or not.
The significance of an instruments relative narrowness changes depending on the instrument or security in question.
What is considered narrow for one security may not be for another.
What is considered narrow for one security may even change within the scope of the same security depending on the timeframe.
In order to accurately gauge the significance of a narrowing of the bands, a technical analyst will need to research past BBW fluctuations and price performance to increase trading accuracy. ”
Here I present the Bollinger Band Width Percentile as a refinement of the BBW to somewhat overcome the limitations cited above.
Much of the work researching past BBW fluctuations, and making relative comparisons is done naturally by calculating the Bollinger Band Width Percentile.
This calculation also means that it can be read in a similar fashion across assets, greatly simplifying the interpretation of it.
Plotted Components of the Bollinger Band Width Percentile indicator :
Scale High
Mid Line
Scale Low
BBWP plot
Moving Average 1
Moving Average 2
Extreme High Alert
Extreme Low Alert
Bollinger Band Width Percentile Properties:
BBWP Length
The time period to be used in calculating the Moving average which creates the Basis for the BBW component of the BBWP.
Basis Type
The type of moving average to be used as the Basis for the BBW component of the BBWP.
BBWP Lookback
The lookback period to be used in calculating the BBWP itself.
BBWP Plot settings
The BBWP plot settings give a choice between a user defined solid color, and a choice of "Blue Green Red", or "Blue Red" spectrum palettes.
Moving Averages
Has 2 Optional User definable and adjustable moving averages of the BBWP.
Visual Alerts
Optional User adjustable High and low Signal columns.
How to read the BBWP :
A BBWP read of 95 % ... means that the current BBW level is greater than 95% of the lookback period.
A BBWP read of 5 % .... means that the current BBW level is lower than 95% of the lookback period.
Proposed interpretations :
When the BBWP gets above 90 % and particularly when it hits 100% ... this can be a signal that volatility is reaching a maximum and that a macro High or Low is about to be set.
When the BBWP gets below 10 % and particularly when it hits 0% ...... this can be a signal that volatility is reaching a minimum and that there could be a violent range breakout into a trending move.
When the BBWP hits a low level < 5 % and then gets above its moving average ...... this can be an early signal that a consolidation phase is ending and a trending move is beginning.
When the BBWP hits a high level > 95 % and then falls below its moving average ... this can be an early signal that a trending move is ending and a consolidation phase is beginning.
Essential knowledge :
The BBWP was designed with the daily timeframe in mind, but technical analysists may find use for it on other time frames also.
High and Low BBWP readings do not entail any direction bias.
Deeper Concepts :
In finance, “mean reversion” is the assumption that a financial instrument's price will tend to move towards the average price over time.
If we apply that same logic to volatility as represented here by the Bollinger band width percentile, the assumption is that the Bollinger band width percentile will tend to contract from extreme highs, and expand from extreme lows over time corresponding to repeated phases of contraction and expansion of volatility.
It is clear that for most assets there are periods of directional trending behavior followed by periods of “consolidation” ( trading sideways in a range ).
This often ends with a tightening range under reducing volume and volatility ( popularly known as “the squeeze” ).
The squeeze typically ends with a “breakout” from the range characterized by a rapid increase in volume, and volatility when price action again trends directionally, and the cycle repeats.
Typical Use Cases :
The Bollinger Band Width Percentile may be especially useful for Options traders, as it can provide a bias for when Options are relatively expensive, or inexpensive from a Volatility (Vega) perspective.
When the Bollinger Band Width Percentile is relatively high ( 85 percentile or above ) it may be more advantageous to be a net seller of Vega.
When the Bollinger Band Width Percentile is relatively low ( 15 percentile or below ) it may be advantageous to be net long Vega.
Here we examine a number of actionable signals on BTCUSD daily timeframe using the BBWP and a momentum oscillator ( using the TSI here but can equally be used with Bollinger bands, moving averages, or the traders preferred momentum oscillator ).
In this first case we will examine how a spot trader and an options trader could each use a low BBWP read to alert them to a good potential trade setup.
note: using a period of 30 for both the Bollinger bands and the BBWP period ( approximately a month ) and a BBWP lookback of 350 ( approximately a year )
As we see the Bollinger Bands have gradually contracted while price action trended down and the BBWP also fell consistently while below its moving average ( denoting falling volatility ) down to an extremely low level <5% until it broke above its moving average along with a break of range to the upside ( signaling the end of the consolidation at a low level and the beginning of a new trending move to the upside with expanding volatility).
In this next case we will continue to follow the price action presuming that the traders have taken or locked in profit at reasonable take profit levels from the previous trade setup.
Here we see the contraction of the Bollinger bands, and the BBWP alongside price action breaking below the BB Basis giving a warning that the trending move to the upside is likely over.
We then see the BBWP rising and getting above its moving average while price action fails to get above the BB Basis, likewise the TSI fails to get above its signal line and actually crosses below its zeroline.
The trader would normally take this as a signal that the next trending move could be to the downside.
The next trending move turns out to be a dramatic downside move which causes the BBWP to hit 100% signaling that volatility is likely to hit a maximum giving good opportunities for profitable trades to the skilled trader as outlined.
Limitations :
Here we will look at 2 cases where blindly taking BBWP signals could cause the trader to take a failed trade.
In this first example we will look at blindly taking a low volatility options trade
Low Volatility and corresponding low BBWP levels do not automatically mean there has to be expansion immediately, these periods of extreme low volatility can go on for quite some time.
In this second example we will look at blindly taking a high volatility spot short trade
High volatility and corresponding high BBWP levels do not automatically mean there has to be a macro high and contraction of volatility immediately, these periods of extreme high volatility can also go on for quite some time, hence the famous saying "The trend is your friend until the end of the trend" and lesser well known, but equally valid saying "never try to short the top of a parabolic blow off top"
Markets are variable and past performance is no guarantee of future results, this is not financial advice, I am not a financial advisor.
Final thoughts
The BBWP is an improvement over the BBW in my opinion, and is a novel, and useful addition to a Technical Analysts toolkit.
It is not a standalone indicator and is meant to be used in conjunction with other tools for direction bias, and Good Risk Management to base sound trades off.
John Bollinger has suggested using Bolliger bands, and its related indicators with two or three other non-correlated indicators that provide more direct market signals.
He believes it is crucial to use indicators based on different types of data.
Some of his favored technical techniques are moving average divergence/convergence (MACD), on-balance volume and relative strength index (RSI).
Thanks
Massive respect to John Bollinger, long-time technician of the markets, and legendary creator of both the Bollinger Bands® in the 1980´s, and the Bollinger band Width indicator in 2010 which this indicator is based on.
His work continues to inspire, decades after he brought the original Bollinger Bands to the market.
Much respect also to Eric Crown who gave me the fundamental knowledge of Technical Analysis, and Options trading.

Liquidity Void Zone Detector [PhenLabs]📊 Liquidity Void Zone Detector
Version: PineScript™v6
📌 Description
The Liquidity Void Zone Detector is a sophisticated technical indicator designed to identify and visualize areas where price moved with abnormally low volume or rapid momentum, creating "voids" in market liquidity. These zones represent areas where insufficient trading activity occurred during price movement, often acting as magnets for future price action as the market seeks to fill these gaps.
Built on PineScript v6, this indicator employs a dual-detection methodology that analyzes both volume depletion patterns and price movement intensity relative to ATR. The revolutionary 3D visualization system uses three-layer polyline rendering with adaptive transparency and vertical offsets, creating genuine depth perception where low liquidity zones visually recede and high liquidity zones protrude forward. This makes critical market structure immediately apparent without cluttering your chart.
🚀 Points of Innovation
Dual detection algorithm combining volume threshold analysis and ATR-normalized price movement sensitivity for comprehensive void identification
Three-layer 3D visualization system with progressive transparency gradients (85%, 78%, 70%) and calculated vertical offsets for authentic depth perception
Intelligent state machine logic that tracks consecutive void bars and only renders zones meeting minimum qualification requirements
Dynamic strength scoring system (0-100 scale) that combines inverted volume ratios with movement intensity for accurate void characterization
Adaptive ATR-based spacing calculation that automatically adjusts 3D layering depth to match instrument volatility
Efficient memory management system supporting up to 100 simultaneous void visualizations with automatic array-based cleanup
🔧 Core Components
Volume Analysis Engine: Calculates rolling volume averages and compares current bar volume against dynamic thresholds to detect abnormally thin trading conditions
Price Movement Analyzer: Normalizes bar range against ATR to identify rapid price movements that indicate liquidity exhaustion regardless of instrument or timeframe
Void Tracking State Machine: Maintains persistent tracking of void start bars, price boundaries, consecutive bar counts, and cumulative strength across multiple bars
3D Polyline Renderer: Generates three-layer rectangular polylines with precise timestamp-to-bar index conversion and progressive offset calculations
Strength Calculation System: Combines volume component (inverted ratio capped at 100) with movement component (ATR intensity × 30) for comprehensive void scoring
🔥 Key Features
Automatic Void Detection: Continuously scans price action for low volume conditions or rapid movements, triggering void tracking when thresholds are exceeded
Real-Time Visualization: Creates 3D rectangular zones spanning from void initiation to termination, with color-coded depth indicating liquidity type
Adjustable Sensitivity: Configure volume threshold multiplier (0.1-2.0x), price movement sensitivity (0.5-5.0x), and minimum qualifying bars (1-10) for customized detection
Dual Color Coding: Separate visual treatment for low liquidity voids (receding red) and high liquidity zones (protruding green) based on 50-point strength threshold
Optional Compact Labels: Toggle LV (Low Volume) or HV (High Volume) circular labels at void centers for quick identification without visual clutter
Lookback Period Control: Adjust analysis window from 5 to 100 bars to match your trading timeframe and market volatility characteristics
Memory-Efficient Design: Automatically manages polyline and label arrays, deleting oldest elements when user-defined maximum is reached
Data Window Integration: Plots void detection binary, current strength score, and average volume for detailed analysis in TradingView's data window
🎨 Visualization
Three-Layer Depth System: Each void is rendered as three stacked polylines with progressive transparency (85%, 78%, 70%) and calculated vertical offsets creating authentic 3D appearance
Directional Depth Perception: Low liquidity zones recede with back layer most transparent; high liquidity zones protrude with front layer most transparent for instant visual differentiation
Adaptive Offset Spacing: Vertical separation between layers calculated as ATR(14) × 0.001, ensuring consistent 3D effect across different instruments and volatility regimes
Color Customization: Fully configurable base colors for both low liquidity zones (default: red with 80 transparency) and high liquidity zones (default: green with 80 transparency)
Minimal Chart Clutter: Closed polylines with matching line and fill colors create clean rectangular zones without unnecessary borders or visual noise
Background Highlight: Subtle yellow background (96% transparency) marks bars where void conditions are actively detected in real-time
Compact Labeling: Optional tiny circular labels with 60% transparent backgrounds positioned at void center points for quick reference
📖 Usage Guidelines
Detection Settings
Lookback Period: Default: 10 | Range: 5-100 | Number of bars analyzed for volume averaging and void detection. Lower values increase sensitivity to recent changes; higher values smooth detection across longer timeframes. Adjust based on your trading timeframe: short-term traders use 5-15, swing traders use 20-50, position traders use 50-100.
Volume Threshold: Default: 1.0 | Range: 0.1-2.0 (step 0.1) | Multiplier applied to average volume. Bars with volume below (average × threshold) trigger void conditions. Lower values detect only extreme volume depletion; higher values capture more moderate low-volume situations. Start with 1.0 and decrease to 0.5-0.7 for stricter detection.
Price Movement Sensitivity: Default: 1.5 | Range: 0.5-5.0 (step 0.1) | Multiplier for ATR-normalized price movement detection. Values above this threshold indicate rapid price changes suggesting liquidity voids. Increase to 2.0-3.0 for volatile instruments; decrease to 0.8-1.2 for ranging or low-volatility conditions.
Minimum Void Bars: Default: 10 | Range: 1-10 | Minimum consecutive bars exhibiting void conditions required before visualization is created. Filters out brief anomalies and ensures only sustained voids are displayed. Use 1-3 for scalping, 5-10 for intraday trading, 10+ for swing trading to match your time horizon.
Visual Settings
Low Liquidity Color: Default: Red (80% transparent) | Base color for zones where volume depletion or rapid movement indicates thin liquidity. These zones recede visually (back layer most transparent). Choose colors that contrast with your chart theme for optimal visibility.
High Liquidity Color: Default: Green (80% transparent) | Base color for zones with relatively higher liquidity compared to void threshold. These zones protrude visually (front layer most transparent). Ensure clear differentiation from low liquidity color.
Show Void Labels: Default: True | Toggle display of compact LV/HV labels at void centers. Disable for cleaner charts when trading; enable for analysis and review to quickly identify void types across your chart.
Max Visible Voids: Default: 50 | Range: 10-100 | Maximum number of void visualizations kept on chart. Each void uses 3 polylines, so setting of 50 maintains 150 total polylines. Higher values preserve more history but may impact performance on lower-end systems.
✅ Best Use Cases
Gap Fill Trading: Identify unfilled liquidity voids that price frequently returns to, providing high-probability retest and reversal opportunities when price approaches these zones
Breakout Validation: Distinguish genuine breakouts through established liquidity from false breaks into void zones that lack sustainable volume support
Support/Resistance Confluence: Layer void detection over key horizontal levels to validate structural integrity—levels within high liquidity zones are stronger than those in voids
Trend Continuation: Monitor for new void formation in trend direction as potential continuation zones where price may accelerate due to reduced resistance
Range Trading: Identify void zones within consolidation ranges that price tends to traverse quickly, helping to avoid getting caught in rapid moves through thin areas
Entry Timing: Wait for price to reach void boundaries rather than entering mid-void, as voids tend to be traversed quickly with limited profit-taking opportunities
⚠️ Limitations
Historical Pattern Indicator: Identifies past liquidity voids but cannot predict whether price will return to fill them or when filling might occur
No Volume on Forex: Indicator uses tick volume for forex pairs, which approximates but doesn't represent true trading volume, potentially affecting detection accuracy
Lagging Confirmation: Requires minimum consecutive bars (default 10) before void is visualized, meaning detection occurs after void formation begins
Trending Market Behavior: Strong trends driven by fundamental catalysts may create voids that remain unfilled for extended periods or permanently
Timeframe Dependency: Detection sensitivity varies significantly across timeframes; settings optimized for one timeframe may not perform well on others
No Directional Bias: Indicator identifies liquidity characteristics but provides no predictive signal for price direction after void detection
Performance Considerations: Higher max visible void settings combined with small minimum void bars can generate numerous visualizations impacting chart rendering speed
💡 What Makes This Unique
Industry-First 3D Visualization: Unlike flat volume or liquidity indicators, the three-layer rendering with directional depth perception provides instant visual hierarchy of liquidity quality
Dual-Mode Detection: Combines both volume-based and movement-based detection methodologies, capturing voids that single-approach indicators miss
Intelligent Qualification System: State machine logic prevents premature visualization by requiring sustained void conditions, reducing false signals and chart clutter
ATR-Normalized Analysis: All detection thresholds adapt to instrument volatility, ensuring consistent performance across stocks, forex, crypto, and futures without constant recalibration
Transparency-Based Depth: Uses progressive transparency gradients rather than colors or patterns to create depth, maintaining visual clarity while conveying information hierarchy
Comprehensive Strength Metrics: 0-100 void strength calculation considers both the degree of volume depletion and the magnitude of price movement for nuanced zone characterization
🔬 How It Works
Phase 1: Real-Time Detection
On each bar close, the indicator calculates average volume over the lookback period and compares current bar volume against the volume threshold multiplier
Simultaneously measures current bar's high-low range and normalizes it against ATR, comparing the result to price movement sensitivity parameter
If either volume falls below threshold OR movement exceeds sensitivity threshold, the bar is flagged as exhibiting void characteristics
Phase 2: Void Tracking & Qualification
When void conditions first appear, state machine initializes tracking variables: start bar index, initial top/bottom prices, consecutive bar counter, and cumulative strength accumulator
Each subsequent bar with void conditions extends the tracking, updating price boundaries to envelope all bars and accumulating strength scores
When void conditions cease, system checks if consecutive bar count meets minimum threshold; if yes, proceeds to visualization; if no, discards the tracking and resets
Phase 3: 3D Visualization Construction
Calculates average void strength by dividing cumulative strength by number of bars, then determines if void is low liquidity (>50 strength) or high liquidity (≤50 strength)
Generates three polyline layers spanning from start bar to end bar and from top price to bottom price, each with calculated vertical offset based on ATR
Applies progressive transparency (85%, 78%, 70%) with layer ordering creating recession effect for low liquidity zones and protrusion effect for high liquidity zones
Creates optional center label and pushes all visual elements into arrays for memory management
Phase 4: Memory Management & Display
Continuously monitors polyline array size (each void creates 3 polylines); when total exceeds max visible voids × 3, deletes oldest polylines via array.shift()
Similarly manages label array, removing oldest labels when count exceeds maximum to prevent memory accumulation over extended chart history
Plots diagnostic data to TradingView’s data window (void detection binary, current strength, average volume) for detailed analysis without cluttering main chart
💡 Note:
This indicator is designed to enhance your market structure analysis by revealing liquidity characteristics that aren’t visible through standard price and volume displays. For best results, combine void detection with your existing support/resistance analysis, trend identification, and risk management framework. Liquidity voids are descriptive of past market behavior and should inform positioning decisions rather than serve as standalone entry/exit signals. Experiment with detection parameters across different timeframes to find settings that align with your trading style and instrument characteristics.

FVG & Market Structure//@version=5
indicator("FVG & Market Structure", overlay=true)
// Inputs
fvg_lookback = input.int(100, "FVG Lookback Period")
fvg_strength = input.int(1, "FVG Minimum Strength")
show_fvg = input.bool(true, "Show FVG")
show_liquidity = input.bool(true, "Show Liquidity Zones")
show_bos = input.bool(true, "Show BOS")
// Calculate swing highs and lows
swing_high = ta.pivothigh(high, 2, 2)
swing_low = ta.pivotlow(low, 2, 2)
// Detect Fair Value Gaps (FVG)
detect_fvg() =>
// Bullish FVG (current low > previous high + threshold)
bullish_fvg = low > high and show_fvg
// Bearish FVG (current high < previous low - threshold)
bearish_fvg = high < low and show_fvg
= detect_fvg()
// Plot FVG areas
bgcolor(bullish_fvg ? color.new(color.green, 95) : na, title="Bullish FVG")
bgcolor(bearish_fvg ? color.new(color.red, 95) : na, title="Bearish FVG")
// Breach of Structure (BOS) detection
detect_bos() =>
var bool bull_bos = false
var bool bear_bos = false
// Bullish BOS - price breaks above previous swing high
if high > ta.valuewhen(swing_high, high, 1) and not na(swing_high)
bull_bos := true
bear_bos := false
// Bearish BOS - price breaks below previous swing low
if low < ta.valuewhen(swing_low, low, 1) and not na(swing_low)
bear_bos := true
bull_bos := false
= detect_bos()
// Plot BOS signals
plotshape(bull_bos and show_bos, style=shape.triangleup, location=location.belowbar, color=color.green, size=size.small, title="Bullish BOS")
plotshape(bear_bos and show_bos, style=shape.triangledown, location=location.abovebar, color=color.red, size=size.small, title="Bearish BOS")
// Liquidity Zones (Recent Highs/Lows)
liquidity_range = input.int(20, "Liquidity Lookback")
buy_side_liquidity = ta.highest(high, liquidity_range)
sell_side_liquidity = ta.lowest(low, liquidity_range)
// Plot Liquidity Zones
plot(show_liquidity ? buy_side_liquidity : na, color=color.red, linewidth=1, title="Sell Side Liquidity")
plot(show_liquidity ? sell_side_liquidity : na, color=color.green, linewidth=1, title="Buy Side Liquidity")
// Order Block Detection (Simplified)
detect_order_blocks() =>
// Bullish Order Block - strong bullish candle followed by pullback
bullish_ob = close > open and (close - open) > (high - low) * 0.7 and show_fvg
// Bearish Order Block - strong bearish candle followed by pullback
bearish_ob = close < open and (open - close) > (high - low) * 0.7 and show_fvg
= detect_order_blocks()
// Plot Order Blocks
bgcolor(bullish_ob ? color.new(color.lime, 90) : na, title="Bullish Order Block")
bgcolor(bearish_ob ? color.new(color.maroon, 90) : na, title="Bearish Order Block")
// Alerts for key events
alertcondition(bull_bos, "Bullish BOS Detected", "Bullish Breach of Structure")
alertcondition(bear_bos, "Bearish BOS Detected", "Bearish Breach of Structure")
// Table for current market structure
var table info_table = table.new(position.top_right, 2, 4, bgcolor=color.white, border_width=1)
if barstate.islast
table.cell(info_table, 0, 0, "Market Structure", bgcolor=color.gray)
table.cell(info_table, 1, 0, "Status", bgcolor=color.gray)
table.cell(info_table, 0, 1, "Bullish BOS", bgcolor=bull_bos ? color.green : color.red)
table.cell(info_table, 1, 1, bull_bos ? "ACTIVE" : "INACTIVE")
table.cell(info_table, 0, 2, "Bearish BOS", bgcolor=bear_bos ? color.red : color.green)
table.cell(info_table, 1, 2, bear_bos ? "ACTIVE" : "INACTIVE")
table.cell(info_table, 0, 3, "FVG Count", bgcolor=color.blue)
table.cell(info_table, 1, 3, str.tostring(bar_index))

SevenDayHighLowTableWithBoxes [CHE]SevenDayHighLowTableWithBoxes — Seven-day day-range boxes with a weekday-aware “ghost” projection and a compact table that tracks recent extremes and per-weekday hit rates.
Summary
This indicator visualizes each trading day as a colored box and annotates the final high and low with compact markers. It maintains a rolling seven-day view and a five-column table showing day name, high, low, range, and a per-weekday projection hit statistic. A dashed “ghost” box projects a typical range for the current weekday using a running average and an adjustable scaling factor. The script is written in Pine v6, runs on the main chart (overlay true), and emphasizes stable object handling and closed-bar finalization at day boundaries.
Motivation: Why this design?
Intraday traders often need fast context for where today’s price sits relative to recent daily extremes, without switching timeframes. A simple daily high/low overlay is informative but lacks structure, sizing context, and continuity. By grouping bars into local days (configurable UTC offset), drawing explicit boxes, and projecting a weekday-typical range, the chart becomes easier to scan. The compact table gives a quick audit trail of the latest seven days while tracking how often the weekday projection would have covered the realized range.
What’s different vs. standard approaches?
Reference baseline: Plain daily high/low lines or session boxes without context.
Architecture differences:
Weekday-tinted boxes and labels for today plus up to six prior days.
Weekday average range drives a dashed projection (“ghost”) sized by a user-defined percentage.
Per-weekday hit statistics recorded as hits over totals and displayed in the table.
ATR-based vertical offsets keep labels readable.
Live updates intraday; state is finalized at the local day switch.
Practical effect: The chart shows where current price sits inside a known daily envelope, plus how “typical” the day’s movement is for this weekday, aiding expectations and planning.
How it works (technical)
The script computes a local daily timestamp using the user’s UTC offset. A day change finalizes the prior day, writes its high, low, start and end indices, and records the bar indices of the terminal high and low.
For each weekday, it maintains a running average of realized ranges with a cap on the lookback count. The ghost projection length is the weekday average scaled by the user’s percentage setting.
Anchor selection for the ghost uses the most recent extreme and the close relative to the intraday midpoint to choose a low-anchored or high-anchored box.
A five-column table (Day, High, Low, Range, Ghost OK) is refreshed on the last bar. The “Ghost OK” column shows per-weekday cumulative hits over totals with a percentage, calculated before including the just-finished day.
Object counts are bounded to seven days by pruning arrays and deleting old boxes and labels. Visual updates for historical objects occur on the last bar to minimize overhead. No `security()` calls are used.
Parameter Guide
UTC (+/−) — Controls local day boundaries — Default: minus five hours — Set to your venue’s local time.
Session (for Time gate) — Session string — Default: full week — (Optional) computed internally; not applied to gating.
Show 7-Day High/Low Table — Toggles the table — Default: true — Disable to reduce UI load.
Show Day Boxes in Chart — Toggles day boxes — Default: true — Disable for a cleaner chart.
Table Position — Nine-point anchor — Default: Middle Right — Move to avoid overlap.
Table Background / Text Color / Min Cell Width — Styling controls — Defaults: gray background, white text, width twelve characters.
Weekday Colors (Sun…Sat) — Row and box tints — Defaults: semi-transparent hues — Adjust for your theme.
Triangle Transparency — Marker opacity — Default: zero — Increase to fade high/low dots.
Day Label Transparency — Day name opacity — Default: zero — Increase to reduce emphasis.
Box Border Width — Box stroke width — Default: one — Increase for stronger edges.
Extend Boxes Right — Extend current box — Default: false — Useful for forward planning.
Show Average Range Ghost Box — Dashed projection — Default: true — Disable if distracting.
Ghost Border Color / Width — Ghost styling — Defaults: gray, width one.
Ghost Length percent of AvgRange — Projection scale — Default: one hundred; bounds zero to five hundred — Lower to be conservative.
Max History Days for Average — Cap per-weekday averaging — Default: two hundred fifty-two; bounds thirty to five hundred.
ATR Length / Day Label ATR Multiplier / Triangle Up ATR Multiplier / Triangle Down ATR Multiplier — Offsets for label placement — Defaults: length one hundred; multipliers zero — Increase on dense instruments to prevent overlap.
Reading & Interpretation
Day boxes: The filled rectangle marks each day’s full high-low span; color encodes the weekday.
Markers: Small dots near the terminal high and low highlight where the final extremes occurred.
Ghost box: A dashed box sized by the weekday average range, anchored based on recent behavior. It is a typical span, not a target.
Table: Row one shows “Today”. Rows below list up to six prior days. “Ghost OK” shows per-weekday cumulative hits over totals with a percentage, which reflects historical coverage quality for that weekday.
Practical Workflows & Combinations
Trend following: Use the current box plus recent boxes to read expansion or compression days; combine with basic structure such as higher-highs and higher-lows or lower-lows and lower-highs for confirmation.
Exits and risk: When price nears the ghost boundary late in the session, consider managing exposure more conservatively.
Multi-asset and multi-timeframe: Works on minute charts. As a starting point, use five to less than sixty minutes. For cross-checks, pair with a higher timeframe bias filter.
Behavior, Constraints & Performance
Repaint/confirmation: The indicator updates intraday; extremes and ghost position can move while the day is open. Values are finalized on the next local day start.
HTF/security: None used; repaint risk is limited to live-bar movement.
Resources: `max_bars_back` five thousand; arrays are pruned to seven days; the table and color sync run on the last bar; the live ghost updates only in real time.
Known limits: Weekday averages can be unrepresentative during regime shifts, events, or gaps. Day boundaries depend on the UTC offset being set correctly. No alerts are included. The script displays warning labels when the timeframe is below five minutes or at sixty minutes and above.
Sensible Defaults & Quick Tuning
Start with the defaults.
Ghost too aggressive: Lower the percent scale.
Labels overlap: Increase ATR multipliers.
Clutter or performance issues: Hide the table or boxes, or disable the ghost.
Day boundary misaligned: Adjust the UTC offset to your market.
What this indicator is—and isn’t
This is a visualization and context layer for daily extremes and a weekday-based typical span. It does not predict direction, does not manage orders, and is not a complete trading system. Use it alongside market structure, risk controls, and position management.
Disclaimer
The content provided, including all code and materials, is strictly for educational and informational purposes only. It is not intended as, and should not be interpreted as, financial advice, a recommendation to buy or sell any financial instrument, or an offer of any financial product or service. All strategies, tools, and examples discussed are provided for illustrative purposes to demonstrate coding techniques and the functionality of Pine Script within a trading context.
Any results from strategies or tools provided are hypothetical, and past performance is not indicative of future results. Trading and investing involve high risk, including the potential loss of principal, and may not be suitable for all individuals. Before making any trading decisions, please consult with a qualified financial professional to understand the risks involved.
By using this script, you acknowledge and agree that any trading decisions are made solely at your discretion and risk.
Do not use this indicator on Heikin-Ashi, Renko, Kagi, Point-and-Figure, or Range charts, as these chart types can produce unrealistic results for signal markers and alerts.
Best regards and happy trading
Chervolino
