Indicators: MMA and 3 oscillatorsGuppy Multiple Moving Averages
---------------------------------
Developed by Daryl Guppy, the basic idea of Multiple moving average(MMA) is to view the trend as two band of moving averages – short term band and long term band.
Shortterm averages capture the inferred behaviour of traders and long term represents the investors. Uses fractal repetition to identify points of agreement and disagreement which precede significant trend changes.
Short intro on interpreting the signals:
drive.google.com
More info:
www.guppytraders.com
Guppy Oscillator
---------------------------------
The Guppy MMA Oscillator, developed by Leon Wilson, is an oscillator representation of difference between GMMA ribbons. Look for signal crosses for the triggers.
Linda Raschke (3/10) Oscillator
---------------------------------
This oscillator is similar to having a MACD of (3,10,16), the nuances are explained by Linda Raschke in her manual "Professional Trading Techniques":
www.lbrgroup.com
Ian Oscillator
---------------------------------
Simple EMA difference converted to an oscillator. Use the signal crosses as triggers.
ค้นหาในสคริปต์สำหรับ "indicator"

Indicators: Hurst Bands and Hurst OscillatorThese 2 indicators are derivative work from Jim Hurst's book - "The Magic of Stock Transaction Timing".
The bands are % bands around a median that gets calculated according to Hurst's formula. The outer bands (called ExtremeBands) signify extreme overbought/oversold conditions. Inner bands signify potential pullback points. As you can see, they also act as dynamic S/R levels.
The oscillator bands match the bands overlaid on price, so you will get an excellent indication of where the price is gonna do by using the oscillator along with the bands. Note that Hurst Oscillator can be used separately too, there is no technical dependency on Hurst Bands.
More info on Hurst Method:
www.readtheticker.com

Indicator: Market Facilitation Index [MFIndex]
***** NOTE: You may see all GREEN circles (it is due to a recent TV update). To work around this issue, change the "Circles" to "Cross" via Format -> Style *****
Market Facilitation Index, by Bill Williams, plots the effectiveness of price movement by computing the price movement per volume unit.
4 possible combinations of MFIndex and Volume are:
Green :
---------------------------------
MFIndex increases and the volume increases. This means that the amount of participants entering the market increases, therefore the volume increases and the fresh incoming players align their positions in the direction of candlestick growth.
Fade :
------------------------------
MFIndex falls and volume falls. It means that the market participants are indifferent and the price movement is small on small volumes. This usually happens at the end of a trend.
Fake :
------------------------------
MFIndex increases, but the volume falls. It is highly likely that the market is being supported by broker speculation and not any significant client volume.
Squat :
--------------------------------
MFIndex falls, but the volume increases. In this particular situation bulls and bears are fighting between themselves to see who will dominate the next trend. These battles are noticeable by the large sell and buy volumes. However, the price does not change appreciably since the strengths are equal. One of the competing parties either the buyers or the sellers will ultimately triumph in the battle. Usually, the fracture of such a candle indicates if this particular candle determines the continuation of the trend, or terminates the trend.
More info: en.wikipedia.org
Code: pastebin.com

Indicator: Weight Of Middle [xQT5]This is my original indicator that was inspired by "Mayer Multiple" and "Chande Forecast Oscillator" (CFO).
I decided to search truth of trend power with SMA and LinReg and found it in a somewhere of the middle. Also, I added a limit area, where you need to keep a more attention, because it can show a potential reversal.
You can change parametrs with a your own look.
One more signal for indicator:
- If "WOM" is above "1" - it's a bullish direction;
- If "WOM" is below "1" - it's a bearish direction.
Enjoy it!

RJM Indicator for 10EMA Swing trade strategyIndicator for a 10ema trading strategy.
Green triangle below a candle indicates a bearish candle that closed above the 10ema. Indicates it may be a good time to go long on this stock. Entry could be a stop limit buy above the high of the candle that triggered the indicator. Stop could be set below the 10ema line, and the low of the candle.
Red triangle above a candle indicates a bullish candle that closed below the 10ema. Indicates it may be a good time to go short on this stock. Entry could be a stop limit sell below the low of the candle that triggered the indicator. Stop could be set above the 10ema and the high of the candle.
Generally, look to setup based on the first candle that triggers the indicator in a given direction. Target is generally 1.2R above entry (where R = Entry Price - Stop Price)
When deciding whether to take the trade, keep in mind any other support/resistance levels that may be evident between your entry price and your target price.
Only trade within your own risk tolerance. Always use stops. Remember you are the one clicking the buttons - take responsibility for your own trades, and as with any strategy, make sure you backtest it before trading live.

Indicator: Profitability by Day & Hour (stacked, non-overlay)What it does
This tool performs a simple seasonality study on the selected symbol. It measures historical returns and summarizes them in two horizontal heatmaps:
Hours table (top) — Columns 00–23 show the average return of each clock hour, plus sample size, win rate, volatility (SD), and a t-score.
Days table (middle) — Columns 1–7 correspond to Mon–Sun with the same metrics.
Summary (bottom) — Shows the most profitable day and hour in the history loaded on your chart.
Green cells indicate higher average returns; red cells indicate lower/negative averages. The layout is centered on the screen, with the hours table above the days table for quick scanning.
How it works (methodology)
Returns: by default the indicator uses log returns ln(Ct/Ct-1) (you can switch to simple % if you prefer).
Daily aggregation (no look-ahead): day statistics are computed from completed daily closes via a higher timeframe request. Yesterday’s daily close vs. the prior day is added to the appropriate weekday bucket, preventing repaint/forward bias.
Hourly aggregation (intraday only): hour statistics are computed bar-to-bar on the current intraday timeframe and accumulated by clock hour (00–23) of the symbol’s exchange timezone.
Metrics per bucket:
Mean: average return in that bucket.
n: number of observations.
Win%: share of positive returns.
SD: standard deviation of returns (volatility proxy).
t-score: mean / SD * sqrt(n) — a quick stability signal (not a hypothesis test).
The indicator does not rely on future data and does not repaint past values.
Reading the tables
Start with the Mean row in each table: it’s color-mapped (red → yellow → green).
Check n (sample size). A bright green cell with very low n is less meaningful than a mild green cell with large n.
Use Win% and SD to judge consistency and noise.
t-score is a compact “signal-to-noise × sample size” measure; higher absolute values suggest more stable effects.
Typical observations traders look for (purely illustrative): for some equity indices, the first hour after the cash open can dominate; for FX/crypto, certain late-US or early-Asia hours sometimes stand out. Always verify on your symbol and timeframe.

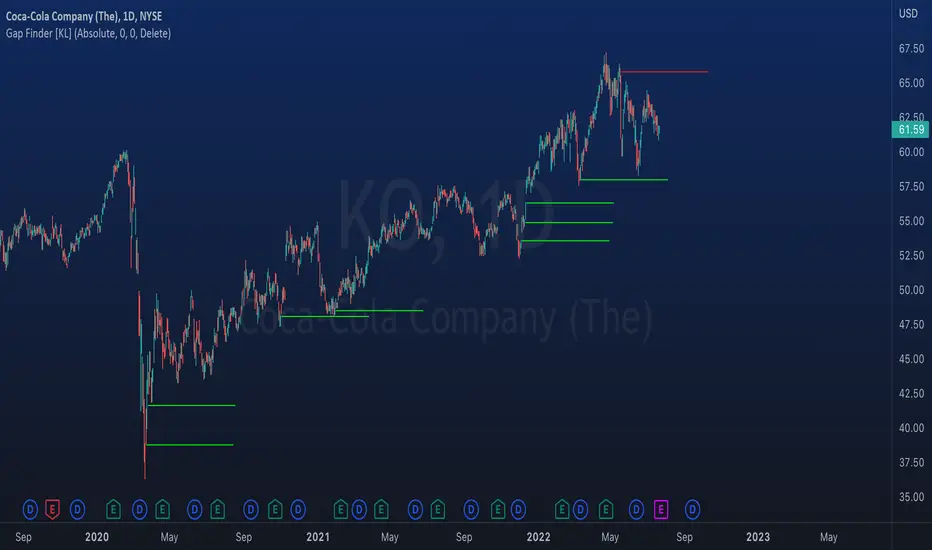
Indicator: Gap Finder [KL]
About gaps:
A gap is a “jump” in a security’s price between the Open and the Prior Close . Gaps are very common in stocks during opening hours, especially when accompanied by catalysts.
What this indicator does:
This script will identify gaps that remained unfilled for at least one candle.
It is very common for gaps to be filled on the first candle, these gaps are arguably less meaningful, so they are ignored by the indicator to reduce the number of lines drawn.
Applications:
Since most gaps eventually get filled, the question is a matter of when . If going with the trend, a trader will open a long/short position when seeing an up/down gap. When going against the trend, then short/long the stock on up/down gaps and consider taking profits when price returns to where the gap originally occurred.
Originally intended for 1D timeframes, but gaps can occur in all timeframes. Applications are limitless.
Indicator: On Balance True RangeThis is original indicator by Thomas Bieravic from a book of "Trading Systems and Methods" (Wiley Trading) 6th Edition by Perry J. Kaufman.
The author was change volume on true range in formula and added signal line for analyze of volatility.
Enjoy it!

Indicator: Net Price Trend [xQT5]This is my original indicator - "Net Price Trend".I made a little personal research about how to analyzing price, and had main idea about view of net price (like net volume), when I'd created the oscillator.
Also, I added high and low border based on historical and typical price movement - you can change it on your opinion.
Trade rules are:
- when indicator is above "0" - it's bullish's zone
- when indicator is under "0" - it's bear's zone
- when indicator is under "-20" - it's attention zone for close sell's position
- when indicator is above "20" - it's attention zone for close buy's position
Enjoy it!

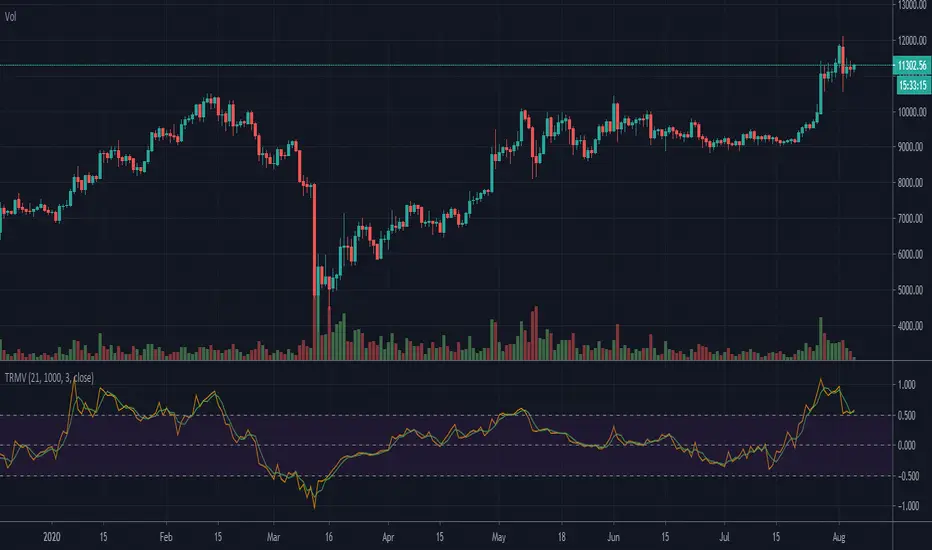
Indicator: True Range Momentum Volume [xQT5]This is original indicator from a book of "Trading Systems and Methods" (Wiley Trading) 6th Edition by Perry J. Kaufman.
I just added a signal line, correction value and borders for a better look of analizing market.
Enjoy it!
Indicator: Strength Oscillator [xQT5]This is original indicator from a book of "Trading Systems and Methods" (Wiley Trading) 6th Edition by Perry J. Kaufman.
I just added a signal line and borders for a better look of analizing market.
Enjoy it!

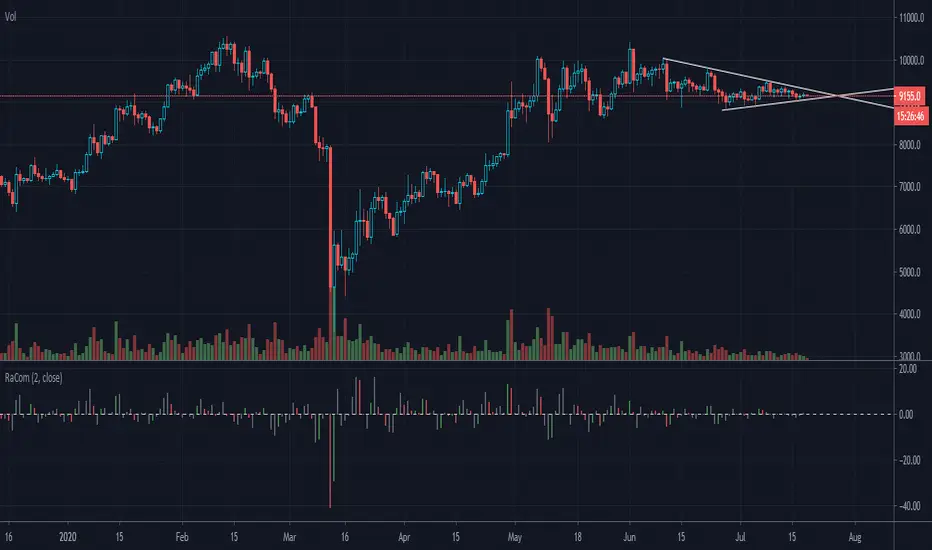
Indicator: Raschke Compase [xQT5]This is an indicator from a book "Street Smarts—High Probability Short Term Trading Strategies" by L. Raschke & L.Connors.
I made it in histogram style for more comfortable reading chart:
- green histogram is buy signal or buy opportunity;
- red histogram is sell signal or sell opportunity;
- gray histogram is forward moving from last signal.
Enjoy it!
Indicator: Black Hole Ratio [xQT5]This is not my original indicator - I found it in internet, but I remember that it was created a long time ago by someone.
This indicator shows a momentum between a source price and sma of source price and has a sinal line for easy understanding.
Enjoy it!

Indicator: Premier Stochastic OscillatorThe PSO, developed by Lee Leibfarth, is a rewired version of a short-period stochastic. This provides a quick response to changes in market direction. This highly sensitive indicator allows for early anticipation of price turns and can be used to establish definitive trading zones that identify potential trading opportunities.
Rules as suggested by Mr.Lee:
For long trades:
(1) Premier stochastic crosses below 0.90
(2) premier stochastic crosses below 0.20
For short trades:
(1) Premier stochastic crosses above -0.90
(2) premier stochastic crosses above -0.20
More info on the trading zones and other nuances:
www.investopedia.com

Indicator: CCI coded OBVOBV is colored green if CCI > threshold, red if CCI < threshold.
Both "threshold" and "CCI Length" can be customized using the options page.
Indicator also displays a 13EMA (length can be changed) over OBV.

Indicator: Schaff Trend Cycle (STC)Another new indicator for TV community :)
STC detects up and down trends long before the MACD. It does this by using the same exponential moving averages (EMAs), but adds a cycle component to factor instrument cycle trends. STC gives more accuracy and reliability than the MACD.
More info: www.investopedia.com
Feel free to "Make mine" this chart and use the indicator in your charts. Appreciate any feedback on how effective this is for your instrument (I have tested this only with BTC).
For people trading BTC:
-------------------------------
Try 3/10 or 9/30 for MACD (fastLength/slowLength). They seem to catch the cycles better than the defaults. :)

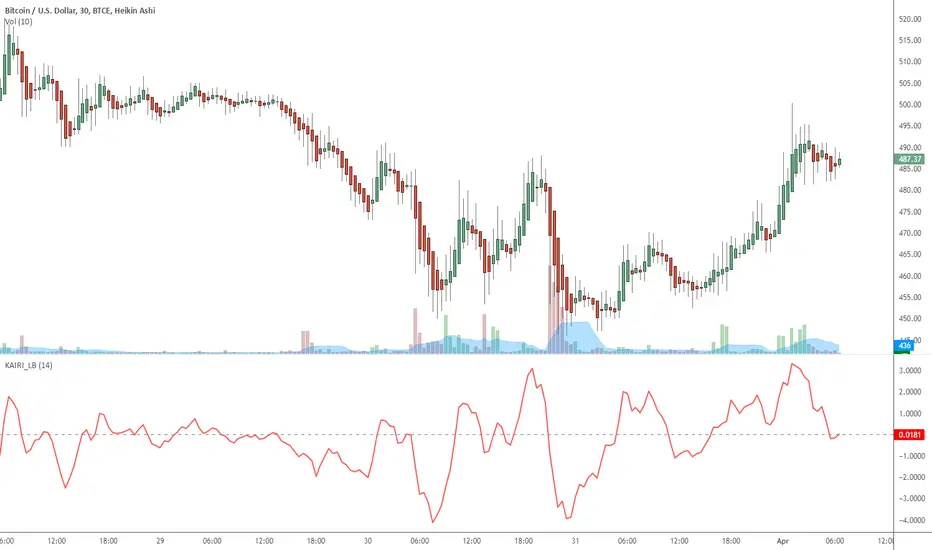
Indicator: Kairi Relative Index (KRI)KRI is a leading indicator, just like RSI. More info: www.etoro.com
I have noticed KRI producing less false-divergences compared to RSI (in my limited BTC backtesting).
Give it a try / backtest on your instrument. Appreciate a note here on what you think.
Indicator: OBV OscillatorEveryone uses OBV, right? This indicator makes it easy to read it by building an oscillator out of it.
Also, now look for OBV divergences easily :)
Appreciate any comments / thoughts.

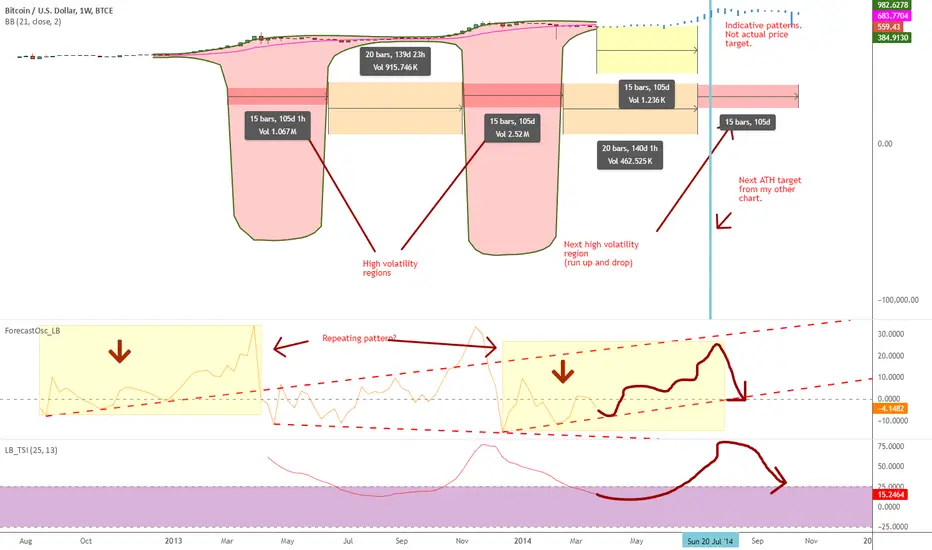
Indicator: Forecast Oscillator & a BB extrapolation experimentFOSC (Forecast Oscillator, %F) is implemented as explained by Kaufman (there are lot of representations out there, using linregs, this one is not.).
This indicator plots a 3-period smoothing of %F. When %F = 0, the trend line and prices are moving parallel to one another; when %F is above 0 the market is accelerating away from the trend line; when %F is below 0 prices are slowing down and the two series are converging.
Now on to the BB extrapolation: As you can see above, a 21-period BB on 1W shows 2 volatile areas of same length. Simple projection using the same time periods gives us a similar volatile area in another 105d. FOSC is forming a similar pattern now as of the first area. More information in the chart markings.
Interesting thing for me was how my other chart () aligned with this. Lets see how far these timelines are respected.
In the mean time, feel free to "Make mine" this and use FOSC in your charts. Appreciate any feedback / comments.
Indicator: ElliotWave Oscillator [EWO]This oscillator has to be used in conjunction with other EW tools (certainly cannot be the main indicator).
EWO has:
- Higher values during third waves' up
- Lower but still Positive values during the first and fifth waves up
- Negative values during the biggest corrections or downtrend impulse waves.
Personally, I am still trying to figure out EW, so do not use this. Just wanted to publish this for the EW masters out there who can put this to good use.
Appreciate any comments/feedback.

Indicator: Balance Of Power**** Code updated. Make sure you pick up the latest version posted (not the code in the published chart) ******
An oscillator that represents the battle between the bulls and the bears in the market.
BOP supports spotting price divergence, trends, and overbought-oversold levels.A change in the BOP trend serves as a warning signal and should be confirmed by a change in the price direction.
More info @ www.fxtimes.com
Updated the code to match ThinkOrSwim platform's indicator (request from user @mika2k1). v2 code here: pastebin.com
This allows you to plot only the EMA (instead of actual BOP). Sample image posted in the comments below.

Indicator: Rahul Mohindar Oscillator (RMO)This indicator is a gauge to market direction. It is displayed as a histogram. As a bullish “buy” sign, we will look for the point at which the histogram shows movement crossing the oscillator’s zero line going upwards. If it should go down and cross the line going down, that would be our “sell” sign, or a “short-sell” sign.
I personally use this only for confirmation.

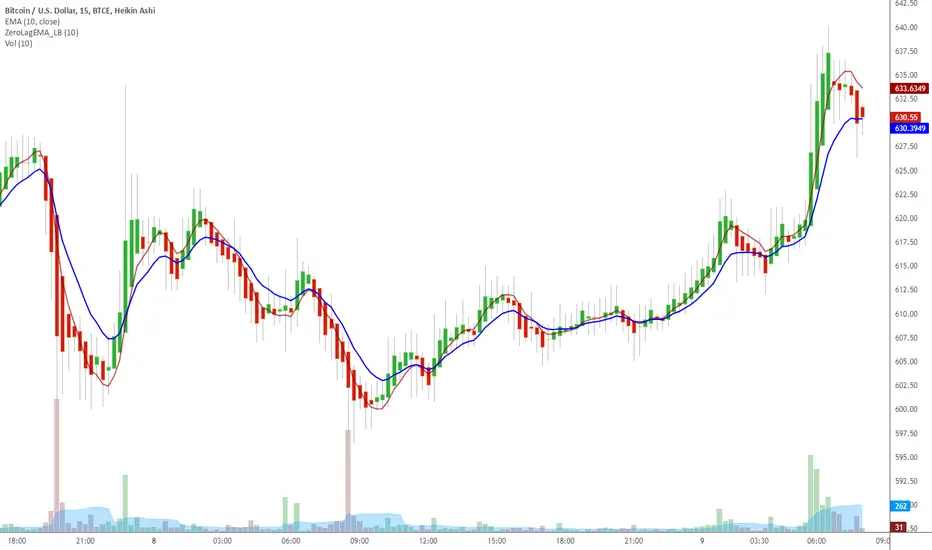
Indicator: Zero Lag EMA & a simple trading strategyZerolag (almost) EMA gives a good indicator of "close" trend. Many are familiar with the fast/slow ema crossing strategy. Try using this zerolag_ema as the fast runner. You will see improved and more reliable crossovers..
In general, when the zero_lag ema is above the EMA the instrument is in a bull mode and when the zero_lag ema is below the EMA the stock is bearish.
More info at www.mesasoftware.com