ICT Algo: Sweep + MSS + High Prob FVG/IFVGThis script is a comprehensive execution tool based on Inner Circle Trader (ICT) concepts, specifically designed to identify high-probability entries by combining Liquidity Sweeps, Market Structure Shifts (MSS), and Fair Value Gaps (FVG/IFVG).
Unlike standard FVG indicators that highlight every gap on the chart, this "Algo" version filters for gaps that occur specifically after a liquidity purge and a shift in structure, ensuring you are only looking at setups with institutional backing.
How It Works
The script follows a strict 3-step validation process before plotting a signal:
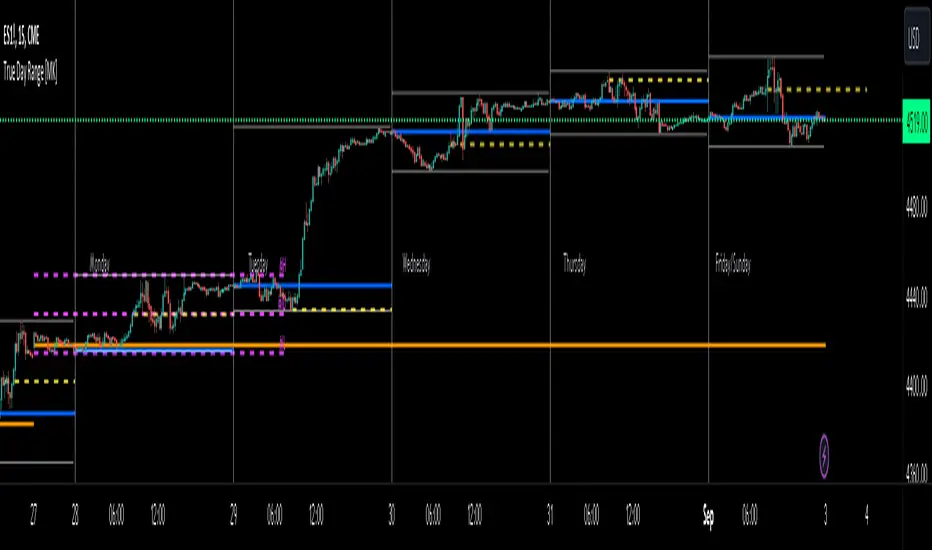
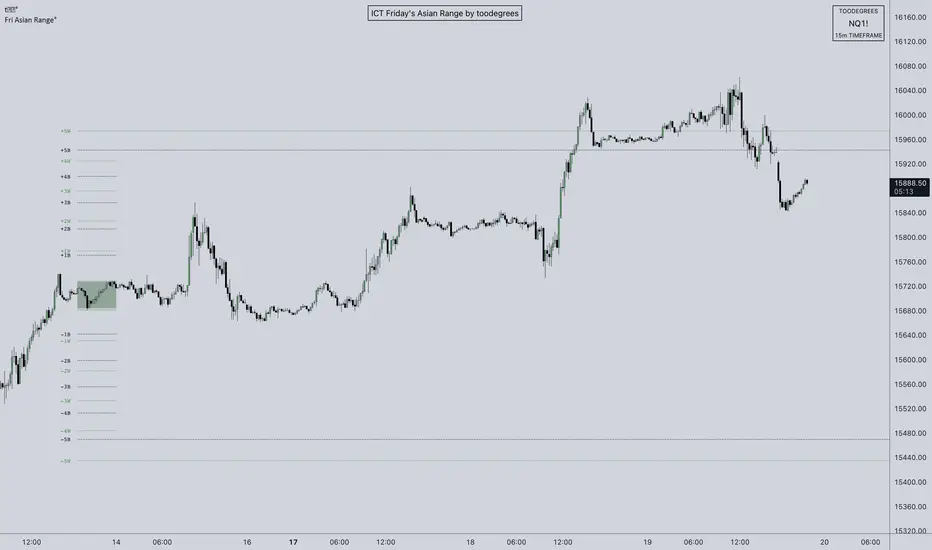
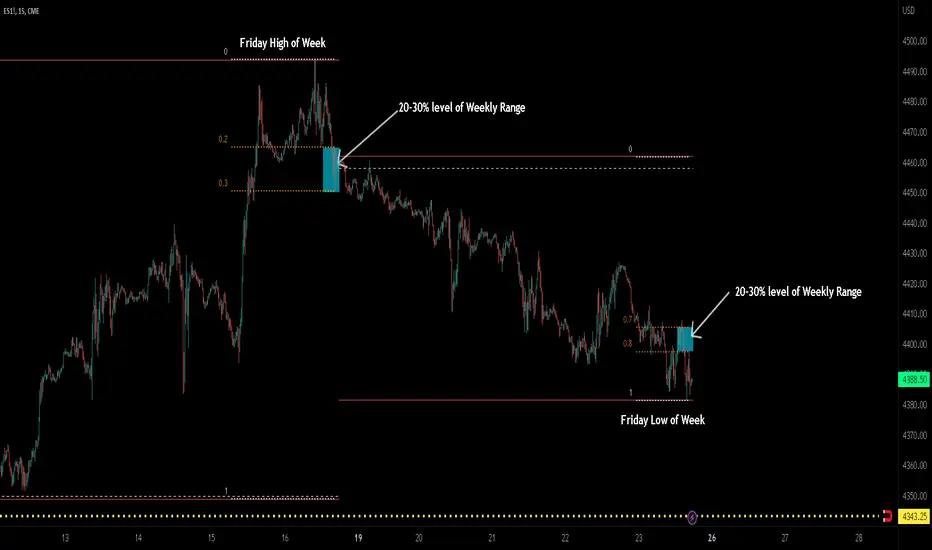
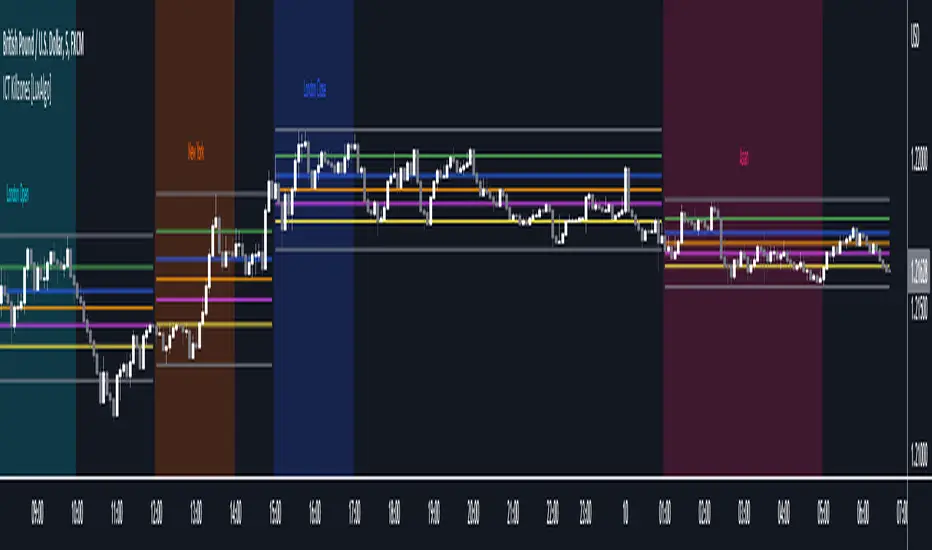
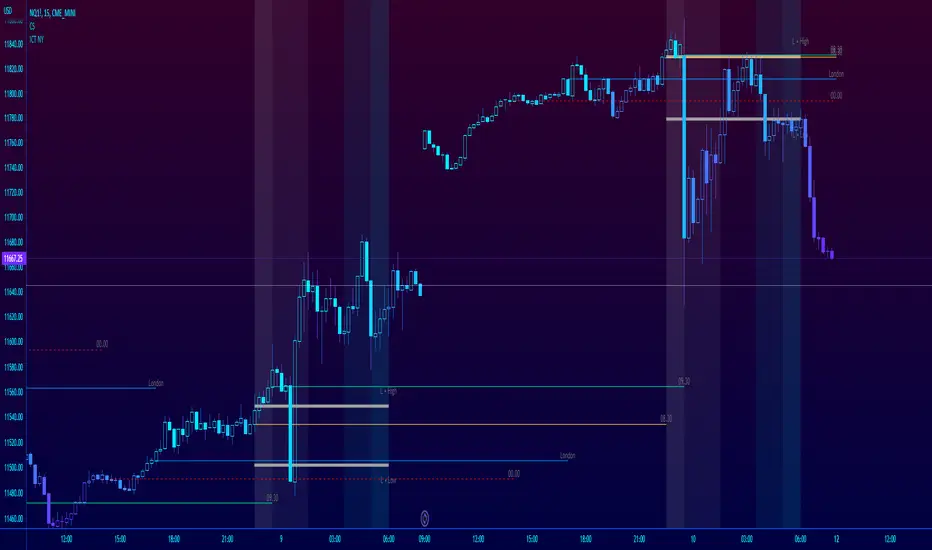
Liquidity Sweep (The Context): The script tracks Higher Timeframe (HTF) levels including Previous Day High/Low, Weekly High/Low, and Monthly High/Low. A setup is only considered valid if price has recently "swept" one of these levels, indicating a hunt for liquidity.
Market Structure Shift (The Confirmation): Once a sweep occurs, the script looks for a displacement in the opposite direction. It identifies a "Pivot High/Low" (customizable length) and waits for a candle body to close beyond it (MSS).
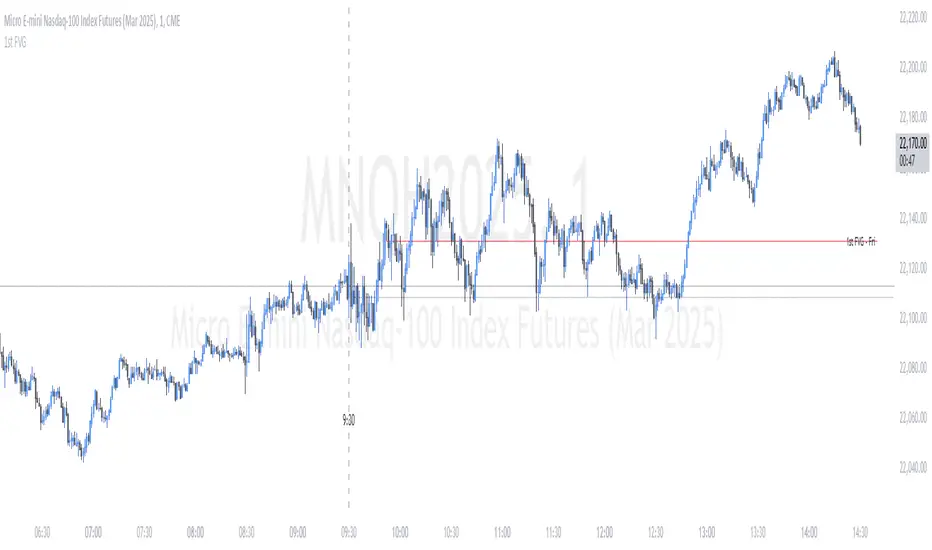
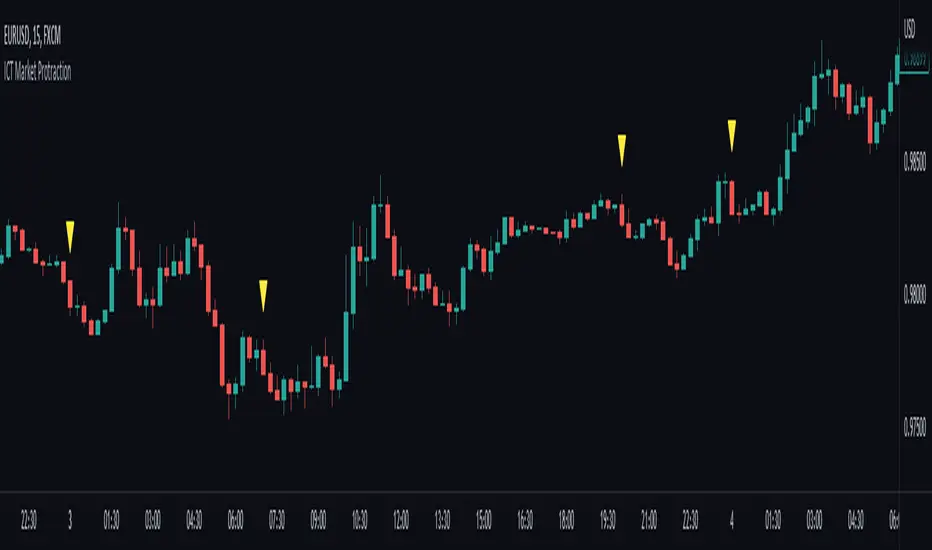
Filtered Entry (The Trigger): * FVG: Plots a standard Fair Value Gap if it forms within a "Deep Value" zone (Discount for longs, Premium for shorts).
IFVG (Inversion FVG): Highlights failed FVGs that have been reclaimed by price to act as support or resistance.
Key Features
Multi-Timeframe Liquidity Filters: Automatically plots PDH/L, PWH/L, PMH/L, and PYH/L. You can toggle which levels act as your sweep triggers.
Deep Value Logic: The script uses built-in logic to ensure Bullish FVGs are only highlighted when price is below a key liquidity level (Discount), and Bearish FVGs when price is above (Premium).
Dynamic Box Management: To keep your chart clean, boxes for FVGs and IFVGs are automatically shortened ("cut") once they are mitigated by price.
Inversion Logic: Includes a specialized toggle for Inversion Fair Value Gaps, allowing you to trade "failed" gaps that flip their polarity.
Settings & Customization
Entry Setup Bias: Choose to see only Bullish, only Bearish, or Both setups.
MSS Pivot Length: Adjust how "sensitive" the Market Structure Shift detection is. A higher number requires a more significant swing to be broken.
Sweep Lookback: Defines how many bars back the script looks for a liquidity sweep to remain "active" for a setup.
Include Opens: Optional toggle to include Previous Day/Week/Month Opens as liquidity points.
Usage Tips
The Golden Setup: Look for a sweep of a Previous Day High, followed by a Bearish MSS, and an entry at the Red FVG box.
Risk Management: This indicator is designed for entry identification. Always use stop losses (usually placed above/below the candle that created the FVG or the MSS swing point).
Timeframes: Best used on execution timeframes (1m, 5m, 15m) while the script handles the HTF levels automatically.
Disclaimer: This script is an educational tool and does not constitute financial advice. Trading involves significant risk. Past performance of a strategy does not guarantee future results.
Credits: Concepts based on the teachings of Michael J. Huddleston (ICT).
อินดิเคเตอร์ Pine Script®