Ichimoku Signal GeneratorThis indicator uses the standard concepts of the Ichimoku Cloud. The indicator features a fully customisable set of Ichimoku lines: Tenkan Sen, Kijun Sen, Senkou Span A & B, Kumo, Chikou Span. Besides this the Indicator also features the ability to show and hide entry signals for various entry criteria for the Ichimoku indicator:
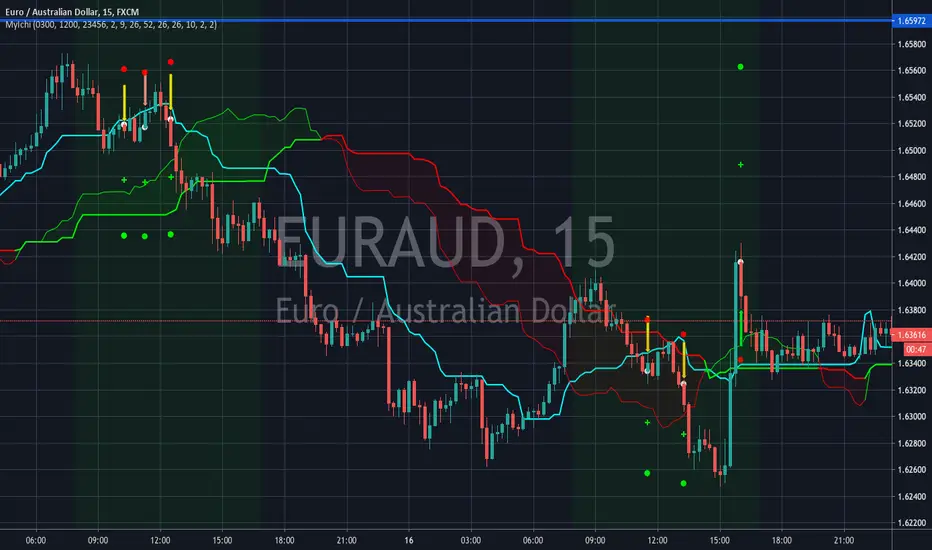
Signal 1 - Chikou crossing Kijun - The indicator will place an arrow in the direction of the trade that is suggested by this signal.
Signal 2 - Heikin Ashi Candle closing above the Kumo - This seems to filter out a lot of bad signal versus basing the signal on price closing above the Kumo alone.
Signal 3 - Price crossing the Kijun Sen in relation to the Kumo - This signal has received the most work - It generates a signal in the suggested direction of the particular condition being met i.e. price crosses below the Kijun indicates a sell and vice versa, but it also factors in where the cross happens in relation to the Kumo cloud. These signals can be switched on or off based on weak(longs below the cloud or shorts above the cloud), neutral (long or short when inside the cloud) or strong (long above the cloud or short below the cloud).
Examples of each of the different Signal 3 indicators can be seen in the screenshot. Pale/white signals are weak, yellow are neutral & green/red are strong.
Further features (only available on Signal 3 at present: entry, stop loss and take profit levels. These are determined based on the ATR periods setting and ATR Multiplier for Stop Loss - specifying an ATR period of 10 and multiplier of 2 will result in stop loss signal being shown as 2xATR(10) above or below the entry based on whether you are shown a long or short signal. For Take Profits you can specify a Risk:Reward multiplier. By default this is set to 2:1 (or 2). This takes the distance from the stop market to the entry and multiplies it by the multiplier and then indicates a signal where you "could" exit. For the risk averse trader that want some instant gratification when they hit 1:1, the indicator will show you exactly where 1:1 is. You can then follow whatever risk management strategy you wish to - personally I find this a point at which I breakeven my stop and take half the profits (now I can't lose!) :)
The indicator follows some basic Ichimoku trading rules - not all signals will result in a winning trade (this is NOT the holy grail and doesn't claim to be) - you should always follow you own risk management strategy. You should also couple this with additional analysis to try to qualify the entry signal i.e. "does this signal and direction correlate with what the higher timeframes are telling me?".
One last feature I added - mores for psychological reasons was to only show signals for the time window I would actually be trading. I hate seeing that I missed a signal when I wasn't online - and this doesn't set me up mentally for trading well. So if there was an opportunity when I would not be trading - it is matter under the bridge! It is gone and I don't want to see it as I would not have been there to take it. This trading window can be specified using the start and end times - the setting mentions EST - however you should relate them to the exchange time for the provider of the price feed - some providers may use a different timezone to others i.e. UTC vs EST.
Wish you the best of luck!
Please provide any constructive feedback as I would love to feature further enhancements to this indicator if it helps users.
ค้นหาในสคริปต์สำหรับ "ichimoku"
ORTI Ichimoku Cloud (Static Timeframe Multi-Period Ichimoku)The "ORTI Ichimoku Cloud (Static Timeframe Multi-Period Ichimoku )" is now a public script, based in a existing study named "Ichimoku Kynko Hyo", but with some better functions about time frame and its measurament. As a redesigned and recalculated set of the common plotted averages: Conversion Line Periods and Base Line Periods, of the security's price, as well as the Lagging Span and the Displacement.
Ichimoku Cloud is a chart used in technical analysis that shows support and resistance , and momentum and trend directions for a security or investment. It is designed to provide relevant information at a glance using moving averages (tenkan-sen and kijun-sen) to show bullish and bearish crossover points. The "clouds" (kumo, in Japanese) are formed between spans of the average of the tenkan-sen and kijun-sen plotted ahead (senkou span A) and a plotted midpoint high and low (senkou span B).
The cherry on the top, for this private version: is when you want to get a predetermined count in natural “units of time" as minutes, hours or days, in any graph you could get a static average, and this count will be automatically respected. For example, an average could be configurated to know a trend per day, week or month... or whatever comes to mind, and at every single chart that you move through (5m, 15m, 1h, 4h, etc), you will see the same average to make your own "trend analysis" into a micro/macro market view.
For more technical information: Investopedia
Note: The previous calculation example is not the default, the parameters can be adjusted according to the criteria of the merchant.
Crypto Ichimoku V.1Ichimoku Cloud with settings recommended for crypto by trader IAmSatoshi . Includes a handy checkbox to double inputs, and alerts that can be set for when the price crosses the bottom or top of the cloud.
This script also includes an ichimoku signal count. The signal count is an unweighted sum of positive or negative ichimoku signals with the greatest total being shown in either green(long>short) or red(short>long) or white(0, long==short). The signal count is only shown when their is a new signal or a signal is no longer valid.

Ichimoku PourSamadi Signal [TradingFinder] KijunSen Magic Number🔵 Introduction
The Ichimoku Kinko Hyo system is one of the most comprehensive market analysis tools ever created. Developed by Goichi Hosoda, a Japanese journalist in the 1930s, its purpose was to allow traders to recognize the balance between price, time, and momentum at a single glance. (In Japanese, Ichimoku literally means “one look.”)
At the core of the system lie five key components: Tenkan-sen (Conversion Line), Kijun-sen (Baseline), Chikou Span (Lagging Line), and the two leading spans, Senkou Span A and Senkou Span B, which together form the well-known Kumo or cloud representing both temporal structure and equilibrium zones in the market.
Although Ichimoku is commonly used to identify trends and support/resistance levels, a deeper layer of time philosophy exists within it. Ichimoku was not designed solely for price analysis but equally for time analysis.
In the classical model, the numerical cycles 9, 26, 52 reflect the natural rhythm of the market originally based on the Tokyo Stock Exchange’s trading schedule in the 1930s.
These values repeat across the system’s calculations, forming the foundation of Ichimoku’s time symmetry where price and time ultimately seek equilibrium.
In recent years, modern analysts have explored new approaches to extract time-based turning points from Ichimoku’s structure. One such approach is the analysis of flat segments on the Kijun-sen and Senkou B lines.
Whenever one of these lines remains flat for a period, it signals temporary balance between buyers and sellers; when the flat breaks, the market exits equilibrium and a new cycle begins.
This indicator is built precisely upon that philosophy. Following the timing methodology introduced by M.A. Poursamadi, the focus shifts away from price signals and line crossovers toward identifying flat periods on Kijun-sen (period 52) as time anchors.
From the first candle that changes the line’s slope, the tool begins a temporal count using a fixed sequence of key numbers: 5, 9, 13, 17, 26, 35, 43, 52, 63, 72, 81, 90.
Derived from both classical Ichimoku cycles and empirical testing, these numbers mark potential timing nodes where a market wave may end, a correction may begin, or a new leg may form.
Thus, this method serves not merely as another Ichimoku tool but as a temporal metronome for market structure a way to visualize moments when the market is ready to change rhythm, often before candles reveal it.
🔵 How to Use
The Kijun Timing BoX is built entirely on Ichimoku’s concept of time analysis.
Its core idea is that within every flat segment of the Kijun-sen, the market enters a temporary balance between opposing forces.
When that flat breaks, a new time cycle begins. From that first breakout candle, the indicator starts counting forward through the predefined time sequence(5, 9, 13, 17, 26, 35, 43, 52, 63, 72, 81, 90).
This counting framework creates a temporal map of market behavior, where each number represents an area where meaningful price fluctuations often occur.
A “meaningful fluctuation” does not necessarily imply reversal or continuation; rather, it marks a moment when the market’s internal energy balance shifts, typically visible as noticeable reactions on lower timeframes.
🟣 Identifying the Anchor Point
The first step is recognizing a valid flat zone on the Kijun-sen.
When this line remains flat for several candles and then changes slope, the indicator marks that bar as the Anchor, initiating the time count.
From that point onward, vertical gray lines appear at each interval in the key-number sequence, visualizing the time nodes ahead.
🟣 Reading the Timing Lines
Each numbered line represents a timing node a temporal point where a change in price rhythm is statistically more likely to occur.
At these nodes, the market may :
Enter a consolidation or minor correction phase.
Develop range-bound movement.
Or simply alter the speed and intensity of its move.
These behaviors do not imply a specific direction; they only highlight zones where time-based activity tends to cluster, giving traders a clearer view of cyclical rhythm.
🟣 Applying Time Analysis
The indicator’s primary use is to observe temporal order, not to predict price direction.
By tracking the distance between Anchors and the reactions that appear near major timing lines, traders can empirically identify each market’s characteristic rhythm—its own time DNA.
For example, one asset may consistently show significant fluctuations around the 13- and 26-bar marks,while another might react closer to 9 or 52. Recognizing such patterns helps traders understand how long typical cycles last before new phases of volatility emerge.
🟣 Combining with Other Tools
The indicator does not generate buy/sell signals on its own.
Its best use is in combination with price- or structure-based methods, to see whether meaningful price reactions occur around the same timing nodes.
In practice, it helps distinguish structured time-based fluctuations from random, noise-driven moves an insight often overlooked in conventional market analysis.
🔵 Settings
🟣 Logical Settings
KijunSen Period : Defines the baseline period used for timing analysis. Default = 52. It is the main line for detecting flats and generating time anchors.
Flat Event Filter : Controls how flat segments are validated before triggering a new timing event.
All : Every flat triggers a new Timing Box.
Automatic : Only flats longer than the historical average are used (recommended).
Custom : User manually defines the minimum flat length via Custom Count.
Update Timing Analysis BoX Per Event : If enabled, a new Timing Box is drawn each time a new flat event occurs. If disabled, the box completes its 90-bar window before refreshing.
🟣 Ichimoku Settings
TenkanSen Period : Defines the period for the Conversion Line (Tenkan-sen). Default = 9.
KijunSen Period : Sets the standard Ichimoku baseline (not the timing line). Default = 26.
Span B Period : Defines the period for Senkou Span B, the slower cloud boundary. Default = 52.
Shift Lines : Offsets cloud projection into the future. Default = 26.
🟣 Display Settings
Users can show or hide all Ichimoku lines Tenkan-sen, Kijun-sen, Chikou Span, Span A, and Span B as well as the Ichimoku Cloud.
They can also customize the color of each element to match personal chart preferences and improve visibility.
🔵 Conclusion
This analytical approach transforms Ichimoku’s time philosophy into a visual and measurable framework. A flat Kijun-sen represents a moment of market equilibrium; when its slope shifts, a new temporal cycle begins.
The purpose is not to forecast price direction but to highlight periods when meaningful fluctuations are more likely to develop.
Through this perspective, traders can observe the hidden rhythm of market time and expand their analysis beyond price into a broader time-cycle dimension.
Ultimately, the method revives Ichimoku’s original principle: the market can only be truly understood through the simultaneous harmony of price, time, and balance.

Advanced Fully Reversed Candles with Reversed IchimokuThe "Advanced Fully Reversed Candles with Reversed Ichimoku" indicator is a sophisticated tool designed for traders who seek a unique perspective on market dynamics. This innovative indicator not only reverses the traditional candlestick chart but also inverts the Ichimoku Cloud components, providing a comprehensive view of the market's inverted behavior.
Key Features:
Reversed Candlestick Chart:
The indicator recalculates the OHLC (Open, High, Low, Close) prices by reversing them along the price axis. This means that what typically would be an upward movement is displayed as a downward movement, and vice versa. This reversal provides an alternative view that can help traders identify hidden patterns and potential reversal points that might not be obvious on a standard chart.
Reversed Ichimoku Cloud:
All components of the Ichimoku Cloud indicator are recalculated based on the reversed price data. This includes:
Tenkan-sen (Conversion Line): Reversed based on the highest and lowest prices over the specified period.
Kijun-sen (Base Line): Reversed in a similar manner to the Tenkan-sen, providing a medium-term perspective on price trends.
Senkou Span A (Leading Span A): Reversed to form one boundary of the Kumo (cloud), offering insight into future support and resistance levels.
Senkou Span B (Leading Span B): Reversed to form the other boundary of the Kumo, complementing Senkou Span A.
Chikou Span (Lagging Span): Reversed and plotted backward for additional confirmation of trend direction and strength.
Dynamic Price Range Calculation:
The indicator dynamically calculates the maximum and minimum prices over the last 500 bars (or the available range if fewer bars are present). This ensures that the reversal is always based on the most relevant data, providing accurate and up-to-date visualizations.
Visual Enhancements:
The reversed candlesticks are color-coded for easy interpretation: green for upward movements and red for downward movements, based on the reversed data.
The Ichimoku Cloud is filled with semi-transparent colors to clearly distinguish between bullish and bearish conditions even in its reversed state.
Debugging Aids:
For transparency and accuracy, the indicator plots the maximum and minimum price lines used for the reversal calculations. This allows users to verify the internal workings of the indicator and ensure the reversal logic is correctly applied.
Usage:
This indicator is ideal for advanced traders and analysts who want to explore market behavior from an unconventional angle. By reversing both the candlestick chart and the Ichimoku Cloud, it provides a unique perspective that can uncover new trading opportunities and enhance market analysis.
Customization:
Users can customize the periods for the Tenkan-sen, Kijun-sen, and Senkou Span B, as well as the displacement for the Ichimoku Cloud. This flexibility allows traders to adapt the indicator to their specific trading strategies and timeframes.
Conclusion:
The "Advanced Fully Reversed Candles with Reversed Ichimoku" indicator is a powerful tool that transforms traditional market analysis. By inverting both price movements and key technical indicators, it opens up a new dimension of trading insights, helping traders to see the market in a completely different light.
Parameters:
Tenkan-sen period (default: 9)
Kijun-sen period (default: 26)
Senkou Span B period (default: 52)
Displacement (default: 26)
How to Apply:
Add the script to your TradingView account via the Pine Editor.
Customize the parameters according to your trading strategy.
Analyze the reversed candlestick chart and Ichimoku Cloud to gain unique insights into market trends and potential reversal points.

Ichimoku Theories [LuxAlgo]The Ichimoku Theories indicator is the most complete Ichimoku tool you will ever need. Four tools combined into one to harness all the power of Ichimoku Kinkō Hyō.
This tool features the following concepts based on the work of Goichi Hosoda:
Ichimoku Kinkō Hyō: Original Ichimoku indicator with its five main lines and kumo.
Time Theory: automatic time cycle identification and forecasting to understand market timing.
Wave Theory: automatic wave identification to understand market structure.
Price Theory: automatic identification of developing N waves and possible price targets to understand future price behavior.
🔶 ICHIMOKU KINKŌ HYŌ
Ichimoku with lines only, Kumo only and both together
Let us start with the basics: the Ichimoku original indicator is a tool to understand the market, not to predict it, it is a trend-following tool, so it is best used in trending markets.
Ichimoku tells us what is happening in the market and what may happen next, the aim of the tool is to provide market understanding, not trading signals.
The tool is based on calculating the mid-point between the high and low of three pre-defined ranges as the equilibrium price for short (9 periods), medium (26 periods), and long (52 periods) time horizons:
Tenkan sen: middle point of the range of the last 9 candles
Kinjun sen: middle point of the range of the last 26 candles
Senkou span A: middle point between Tankan Sen and Kijun Sen, plotted 26 candles into the future
Senkou span B: midpoint of the range of the last 52 candles, plotted 26 candles into the future
Chikou span: closing price plotted 26 candles into the past
Kumo: area between Senkou pans A and B (kumo means cloud in Japanese)
The most basic use of the tool is to use the Kumo as an area of possible support or resistance.
🔶 TIME THEORY
Current cycles and forecast
Time theory is a critical concept used to identify historical and current market cycles, and use these to forecast the next ones. This concept is based on the Kihon Suchi (translating to "Basic Numbers" in Japanese), these are 9 and 26, and from their combinations we obtain the following sequence:
9, 17, 26, 33, 42, 51, 65, 76, 129, 172, 200, 257
The main idea is that the market moves in cycles with periods set by the Kihon Suchi sequence.
When the cycle has the same exact periods, we obtain the Taito Suchi (translating to "Same Number" in Japanese).
This tool allows traders to identify historical and current market cycles and forecast the next one.
🔹 Time Cycle Identification
Presentation of 4 different modes: SWINGS, HIGHS, KINJUN, and WAVES .
The tool draws a horizontal line at the bottom of the chart showing the cycles detected and their size.
The following settings are used:
Time Cycle Mode: up to 7 different modes
Wave Cycle: Which wave to use when WAVE mode is selected, only active waves in the Wave Theory settings will be used.
Show Time Cycles: keep a cleaner chart by disabling cycles visualisation
Show last X time cycles: how many cycles to display
🔹 Time Cycle Forecast
Showcasing the two forecasting patterns: Kihon Suchi and Taito Suchi
The tool plots horizontal lines, a solid anchor line, and several dotted forecast lines.
The following settings are used:
Show time cycle forecast: to keep things clean
Forecast Pattern: comes in two flavors
Kihon Suchi plots a line from the anchor at each number in the Kihon Suchi sequence.
Taito Suchi plot lines from the anchor with the same size detected in the anchored cycle
Anchor forecast on last X time cycle: traders can place the anchor in any detected cycle
🔶 WAVE THEORY
All waves activated with overlapping
The main idea behind this theory is that markets move like waves in the sea, back and forth (making swing lows and highs). Understanding the current market structure is key to having realistic expectations of what the market may do next. The waves are divided into Simple and Complex.
The following settings are used:
Basic Waves: allows traders to activate waves I, V and N
Complex Waves: allows traders to activate waves P, Y and W
Overlapping waves: to avoid missing out on any of the waves activated
Show last X waves: how many waves will be displayed
🔹 Basic Waves
The three basic waves
The basic waves from which all waves are made are I, V, and N
I wave: one leg moves
V wave: two legs move, one against the other
N wave: Three legs move, push, pull back, and another push
🔹 Complex Waves
Three complex waves
There are other waves like
P wave: contracting market
Y wave: expanding market
W wave: double top or double bottom
🔶 PRICE THEORY
All targets for the current N wave with their calculations
This theory is based on identifying developing N waves and predicting potential price targets based on that developing wave.
The tool displays 4 basic targets (V, E, N, and NT) and 3 extended targets (2E and 3E) according to the calculations shown in the chart above. Traders can enable or disable each target in the settings panel.
🔶 USING EVERYTHING TOGETHER
Please DON'T do this. This is not how you use it
Now the real example:
Daily chart of Nasdaq 100 futures (NQ1!) with our Ichimoku analysis
Time, waves, and price theories go together as one:
First, we identify the current time cycles and wave structure.
Then we forecast the next cycle and possible key price levels.
We identify a Taito Suchi with both legs of exactly 41 candles on each I wave, both together forming a V wave, the last two I waves are part of a developing N wave, and the time cycle of the first one is 191 candles. We forecast this cycle into the future and get 22nd April as a key date, so in 6 trading days (as of this writing) the market would have completed another Taito Suchi pattern if a new wave and time cycle starts. As we have a developing N wave we can see the potential price targets, the price is actually between the NT and V targets. We have a bullish Kumo and the price is touching it, if this Kumo provides enough support for the price to go further, the market could reach N or E targets.
So we have identified the cycle and wave, our expectations are that the current cycle is another Taito Suchi and the current wave is an N wave, the first I wave went for 191 candles, and we expect the second and third I waves together to amount to 191 candles, so in theory the N wave would complete in the next 6 trading days making a swing high. If this is indeed the case, the price could reach the V target (it is almost there) or even the N target if the bulls have the necessary strength.
We do not predict the future, we can only aim to understand the current market conditions and have future expectations of when (time), how (wave), and where (price) the market will make the next turning point where one side of the market overcomes the other (bulls vs bears).
To generate this chart, we change the following settings from the default ones:
Swing length: 64
Show lines: disabled
Forecast pattern: TAITO SUCHI
Anchor forecast: 2
Show last time cycles: 5
I WAVE: enabled
N WAVE: disabled
Show last waves: 5
🔶 SETTINGS
Show Swing Highs & Lows: Enable/Disable points on swing highs and swing lows.
Swing Length: Number of candles to confirm a swing high or swing low. A higher number detects larger swings.
🔹 Ichimoku Kinkō Hyō
Show Lines: Enable/Disable the 5 Ichimoku lines: Kijun sen, Tenkan sen, Senkou span A & B and Chikou Span.
Show Kumo: Enable/Disable the Kumo (cloud). The Kumo is formed by 2 lines: Senkou Span A and Senkou Span B.
Tenkan Sen Length: Number of candles for Tenkan Sen calculation.
Kinjun Sen Length: Number of candles for the Kijun Sen calculation.
Senkou Span B Length: Number of candles for Senkou Span B calculation.
Chikou & Senkou Offset: Number of candles for Chikou and Senkou Span calculation. Chikou Span is plotted in the past, and Senkou Span A & B in the future.
🔹 Time Theory
Show Time Cycle Forecast: Enable/Disable time cycle forecast vertical lines. Disable for better performance.
Forecast Pattern: Choose between two patterns: Kihon Suchi (basic numbers) or Taito Suchi (equal numbers).
Anchor forecast on last X time cycle: Number of time cycles in the past to anchor the time cycle forecast. The larger the number, the deeper in the past the anchor will be.
Time Cycle Mode: Choose from 7 time cycle detection modes: Tenkan Sen cross, Kijun Sen cross, Kumo change between bullish & bearish, swing highs only, swing lows only, both swing highs & lows and wave detection.
Wave Cycle: Choose which type of wave to detect from 6 different wave types when the time cycle mode is set to WAVES.
Show Time Cycles: Enable/Disable time cycle horizontal lines. Disable for better performance.
how last X time cycles: Maximum number of time cycles to display.
🔹 Wave Theory
Basic Waves: Enable/Disable the display of basic waves, all at once or one at a time. Disable for better performance.
Complex Waves: Enable/Disable complex wave display, all at once or one by one. Disable for better performance.
Overlapping Waves: Enable/Disable the display of waves ending on the same swing point.
Show last X waves: 'Maximum number of waves to display.
🔹 Price Theory
Basic Targets: Enable/Disable horizontal price target lines. Disable for better performance.
Extended Targets: Enable/Disable extended price target horizontal lines. Disable for better performance.

Silent IchimokuSilent Ichimoku
attempts to filter out the noise from the Ichimoku indicator By only coloring the bars
Green if the Ichimoku spots an uptrend
Red if Ichimoku spots a downtrend
And Gray if Ichimoku spots consolidation

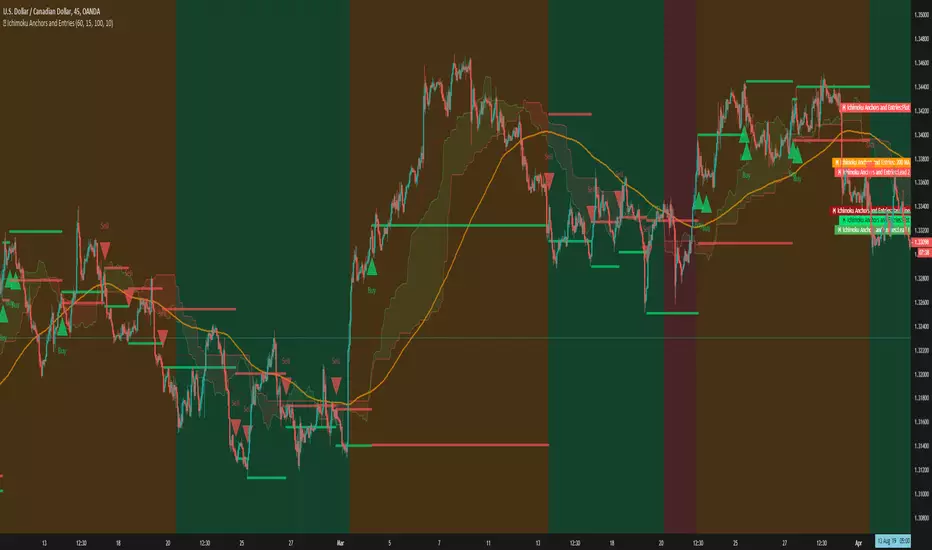
Ichimoku Anchor EntriesThis is an ichimoku MTF entries based on baseline and MA
Requested by user Yusufali
ICHIMOKU MTFMultiple Time Frame Version of Ichimoku Kinko Hyo Indicator.
Created in 1940's by Goichi Hosoda withe the help of University students in Japan.
Ichimoku is one of the best trend following indicators that works nearly perfect in all markets and time frames.
Ichimoku is originally an built in indicator in Tradingview but there are some problems like:
the indicator hast 5 lines but you can change only 4 parameters in the settings menu of Tradingview Charts which you could only control 3 of the lines effectively. A second problem is that Tradingview preferred to use English titles for the ICHIMOKU lines instead of giving them the most common original Japanese ones. (So I rewrite the indicator)
Kijun Sen (blue line): Also called standard line or base line, this is calculated by averaging the highest high and the lowest low for the past 26 periods.
Tenkan Sen (red line): This is also known as the turning line and is derived by averaging the highest high and the lowest low for the past nine periods.
Chikou Span (Plum line): This is called the lagging line. It is today’s closing price plotted 26 periods behind.
Senkou SpanA (green line): The first Senkou line is calculated by averaging the Tenkan Sen and the Kijun Sen and plotted 26 periods ahead.
Senkou SpanB (purple line):
The second Senkou line is determined by averaging the highest high and the lowest low for the past 52 periods and plotted 26 periods ahead.
PERSONALLY I ADVISE YOU TO USE ICHIMOKU WITH DEAFULT LENGTHS (9,26,26,52,26) IN ORDER FOR STOCK MARKETS AND FOREX MARKETS
FOR CRYPTO YOU'D BETTER USE:
10,30,30,60,30 OR 20,60,60,120,60
THE TRICKY THING IS THAT KEEPING THE 1-3-3-6-3 RATIO CONSTANT IS NECESSARY
Here's a link of my Youtube video explaining ICHIMOKU but unfortunately only in TURKISH:
www.youtube.com
Developed by: Goichi Hosoda
Here's the link to a complete list of all my indicators:
tr.tradingview.com
Ichimoku kullanımı anlattığım detaylı video serisini linkten izleyebilirsiniz:
www.youtube.com
İndikatörü geliştiren: Goichi Hosoda

Renko Ichimoku CloudThis script utilizes its source from a non-repainting renko closing price. Renko charts focus solely on price movement and minimize the impacts of time and the extra noise time creates. Employing the renko close helps smooth out the Ichimoku Cloud. Insignificant price movements will not cause a change in the plotted lines of the indicator unless a new threshold is breached or a "brick" is created.
This Ichmoku Cloud includes all standard lines with standard lengths. These include:
Tenken Sen
Kiju Sen
Senkou A/B
Chikou Span
We have also included plotted marks for when there is a Tenken Sen/ Kiju Sen cross and for the Kumo cloud twist.
There are two methods for selecting the box size. Box size is critical for the overall function and efficacy of the plots you will visually see with this indicator. Box size is set automatically using the Average True Range "ATR" or manually using the "Traditional" setting. The simplest way to determine a manual box six is to take the ATR of the given instrument and round it to the nearest decimal place. As an example, if the ATR for the asset is 0.017, you would round that number to 0.02 and utilize this as your traditional box size.
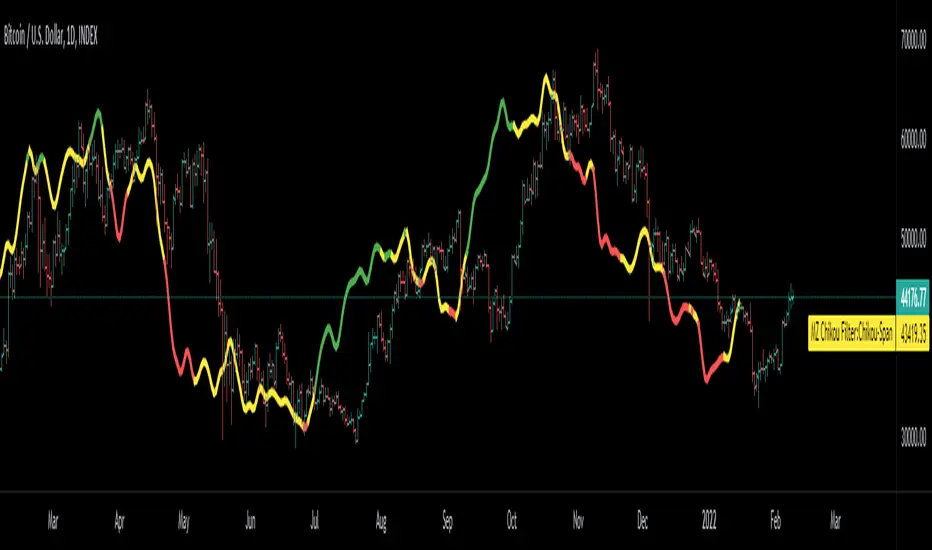
Chikou Filter for Ichimoku CloudThis Indicator enhances functionality of Chikou-Span from Ichimoku Cloud using a simple trend filter.
Methodology
Chikou is basically close value of ticker offset to close and it is a good for indicating if close value has crossed potential Support/Resistance zone from past. Chikou is usually used with 26 period.
Chikou filter uses a lookback length calculated from provided lookback percentage and checks if trend was bullish or bearish within that lookback period.
Bullish : Trend is bullish if Chikou span is above high values of all candles within defined lookback period. Green color shows bullish trend.
Bearish: Trend is bearish if Chikou span is below low values of all candles within defined lookback period. This is indicated by red color.
Reversal / Choppiness : White color indicates that Chikou are swinging around candles within defined lookback period which is an indication of consolidation or trend reversal.
Default Settings
Different source types are included but I've found that (OHLC4+High+Low)/3 is better for Chikou and Symmetrically Weighted Moving Average (SWMA) is also applied but it produce some repainting though. Default period is set to 26 and lookback percentage is 50%. Low percentage would decrease filter's efficiency.
Usage
This filter can be used to check if Chikou crossover has occurred in past. This can be used with Donchain channels, Bollinger Bands or any Moving Average as replacement of High / Low values. I'll use this indicator in all my Ichimoku Cloud studies especially adaptive ones. Filter outputs in Color and Integer format; both can be used as signals definitions.
Ichimoku Cloud OscillatorThis script shows Ichimoku values in a different manner. While studying Ichimoku one thing stuck out to me and that is that the Kijun-Sen line is considered to be the equilibrium of the market, it acts like a magnet and price always returns to it. Taking this into account I made a script that plots the distance from equilibrium as an oscillator.
With that value being an oscillator it allows for some analysis that would have been harder to do looking at the normal ichimoku chart. For example smoothing the value and comparing the distance to the average distance to see if the market reached an extremity (too far from equilibrium). I added a bollinger band for those who are interested in analysing the value in that way but in my experience I do not use it except for noticing if market spiked outside of the band (green and red dots).
It is advised to use this oscillator as a trend analysis tool the same way you would use a money flow. Below a breakdown of current features
- Disequilibrium1: The white sharp wave is the raw distance from Kijun with settings to smooth it out using a WMA
- Disequilibrium2: The blue smooth wave is the smooth distance from Kijun with settings to smooth it further out using a WMA
- Yellow line: The distance of Tenkan-Sen from Kijun-Sen which in alot of ichimoku strategys act as a trend filter or a crossover as market change.
- Green and red zone: The slope of the kumo cloud, color coded to see if kumo is red or green. Use it in the same way you would use money flow on market cypher, it is a longer term trend strength indicator and like all smoothed values it lags behind. You can use this to decide which direction to trade in but not as a signal on it's own.
- Bollinger Band: Acts the same way a bollinger band does, use this to analyse the wave structure, especialy the middle line the same way you would use Disequilibrium2, if the waves are a good distance from this line market can be overbought oversold or it is just a good indication that the trend is strong. Outer bands should be your warning bands as the waves tend to jump back to the middle line when touching those.
Would love some feedback on this as I do not think this can be used for divergences but would like to hear some possible patterns/strategys.
My current strategy is noticing an increasing wave after a squeeze (waves keep getting smaller untill a large trend happens, wave no longer goes to middle and keeps expanding). When I notice this I wait for the white wave to enter the blue and touch the mid bollinger line (small pullback during strong trend) and open a trade in the direction of the trend. I use the green and red zone to decide if the long term direction tells the same to get confluence.

Future Ichimoku LinesFuture Ichimoku Lines Plot: Tenkan-sen next 5 days, Kijun-sen next 10 days, Kumo A next 5 days and Kumo B next 14 days will be display
This will help you forecast the future of price and increase winning probability!
Always remember, risk management is the key of a successful trader
Have a nice trade! :D
Ichimoku Alert Indicator Buy Sell Please Take Trade as per your own risk.
Hi, this my new script which show you correct Ichimoku signals, when price exit cloud.
SELL SIGNAL:
- red line below blue
- green line below price
- price exit cloud bottom
- price below 3 EMA's!
BUY SIGNAL:
- red line above blue
- green line above price
- price exit cloud upper
- price above 3 EMA's!
You can change ichimoku parameters and input 3 EMA's. If u dont want use any of the EMA's then input 1 into them.
Comments
Extended Ichimoku by Grzechu789This script extends capabilities of Ichimoku Indicator adding nondisplaced SSB line (serves as Kijun Sen line) and ability to see Kijun Sen line from higher (or lower) timeframes.
Other than that it's same as original Ichimoku Kinko Hyo Indicator. Enjoy!

Ichimoku Anchors and EntriesThis is an ichimoku scalper that makes trades based off anchor and signal time frames
There consist of 3 types of trades
Weak, Medium and Strong
Red represents weak entries
Medium is represented by orange
And Green is the strong Entries

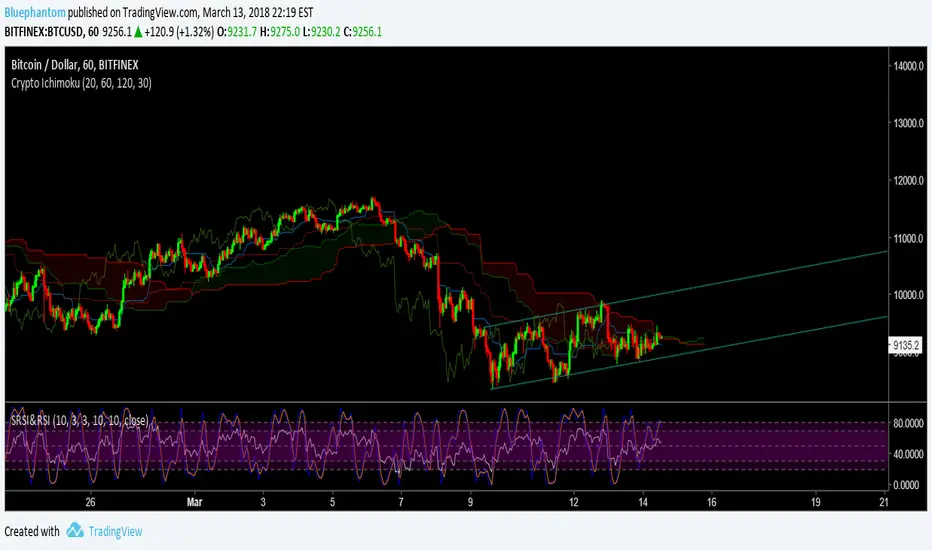
Crypto Ichimoku by BluephantomAs Cryptocurrencies are a 24/7 market I've created a cryptocurrency version of the Ichimoku.
I haven't made any major changes to how the ichimoku works.
Default settings are (20,60,120,30);
you can also try (10,30,60,30).
If you find my Scripts useful and would like to donate:
BTC:
3DVzwAggm2PuQ9y3ENxB8UWe5Sij7L55Nz
LTC:
MDTsyKDp9eshASbMvcwXFM2MRNBDEBbXiA
Simple Ichimoku Kinko Hyo Cloud█ OVERVIEW
This indicator as an educational and showcase the usage of user-defined types or objects (UDT) for Ichimoku Kinko Hyo or Ichimoku Cloud.
█ CREDITS
TradingView

Volume Spread Analysis IchimokuThis version of the popular Ichimoku indicator is modified to let the user choose between his classic mode and the volume-weighted mode.
Every line of the indicator is customizable with this function.
The Kijun and Tenkan lines are choosable from:
1. The normal version, so the average of the high and the low of the selected period
2. The volume mode, so the average price of the selected input ponderated to the volume
The Senkau Span A is the average from the Kijun (fast line) and the Tenkan (slow line) lines and it's choosable from:
1. The normal price version
2. The volume mode
3. The average between points 1 and 2
4. The automatic average between the two fast lines that you've chosen
The Senkau Span B is the slowest line of the indicator, used to determine the long-term trend, and can be chosen from:
1. The normal average price between the high and the low of the selected period
2. The volume average price, using the Volume Weighted Moving Average
The Trama Backline is the popular "LUX Algo" T.R.A.M.A. indicator, which I'm thankful for, and can be fantastically used to display the current trend strength and condition. This line is readable in the following way:
- If the line is moving sideways, the trend may be in a consolidation phase
- If the line is moving upwards or downwards, the trend may be in a trend phase

Ichimoku VariationsThe Ichimoku cloud is traditionally constructed from the highest high and lowest low for a number of periods. This script allows for it to be transformed and calculated like more traditional moving averages (e.g. simple moving average, exponential moving average). Since the Ichimoku is normally a system of moving average-like lines, maybe someone out there will learn something from being able to switch to sma, ema, etc etc.
In general, I think no TA indicator is a magic bullet, and you should just use what you like!
Credit: This script utilizes the "Color Gradient Framework" tutorial by LucF (PineCoders) to create gradient visuals, which are also customizable for the user.
Recommended modes:
default
SMA
EMA
SMMA
WMA
VWMA
Tillson T3
Not Recommended (These moving averages are too fast, and probably will require adjusting settings to something like the 20-60-120-30 to make more sense):
HMA
EHMA
TEMA
ALMA
LSMA

MTF Ichimoku Signal [Takazudo]A multi timeframe Ichimoku Signal indicator. This indicator shows the status of each Ichimoku Signals.
1. TK-Cross
Tenkan-Sen & Kijun-Sen cross status
2. Future Kumo
The newest Kumo color
3. Kumo & Current Relation
The relation between current price & Kumo.
4. Kumo & Chikou-Span Relation
The relation between Kumo & Chikou-Span.
5. Chikou-Span & Candle Cross
Chikou-Span & Candle cross status

Adaptive IchimokuThis is part 10 of 11 in the system named Ninetales/Volt V2 you can find on Tradingview.
No. You may not add custom values, testing all the variables of Ichimoku is a giant pita. You can uncheck ones you dont like though.
