Ichimoku multi-TF bull/bear Grid by SimThis indicator gives you a one look multi-timeframe snapshot of the 4-hour, 12-hour, and 24-hour Ichimoku Cloud conditions. It looks for Tenkan-to-Kijun positioning as well as price relative to cloud. The legend is as follows:
- A red square indicates bearish conditions
- A green square indicates bullish conditions
- An empty slot indicates mixed conditions
- Top row: 24-hour
- Middle row: 12-hour
- Bottom row: 4-hour
Happy trades,
Sim
ค้นหาในสคริปต์สำหรับ "ichimoku"

^-^ Three Ichimoku Clouds ^-^ 4x4 Moving Average x EMA ^-^Three ichimoku clouds
Four moving averages
Four exponential moving averages


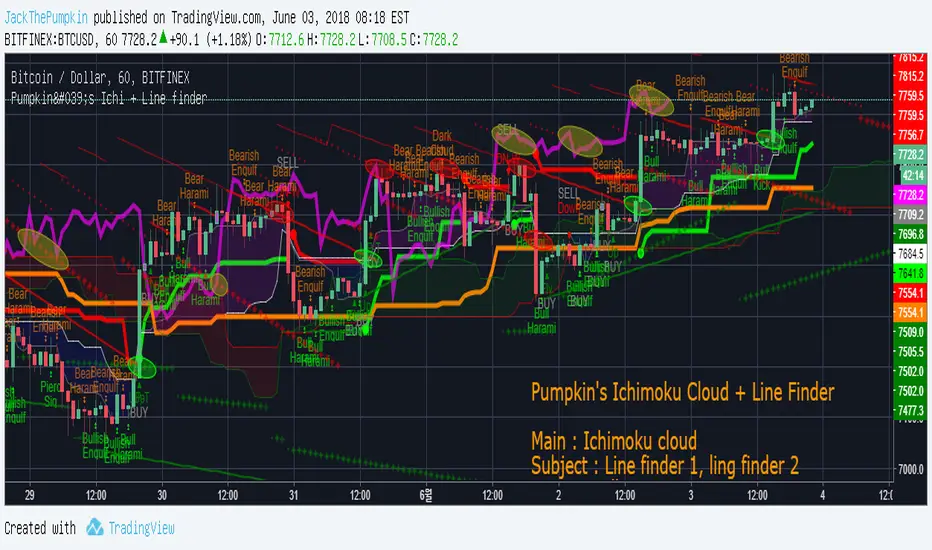
Pumpkin's Ichimoku Cloud & Line FinderMain : Ichimoku Cloud
- Tenkan-sen & Kijun-sen Cloud
- Senkou Span A & Senkou Span B Cloud
- Senkou Span A & Senkou Span B 2nd Cloud
Subject : Line Finder
- 1st : strong
- 2nd : weak
ETC
- Candle Pattern
- ATR line
reference :
1. Ichimoku Signal + Candle Color + Candle Pattern by calinh
2. Candlestick Patterns With EMA by rmwaddelljr
3. Trend Line Finder 9000 by spacetrader
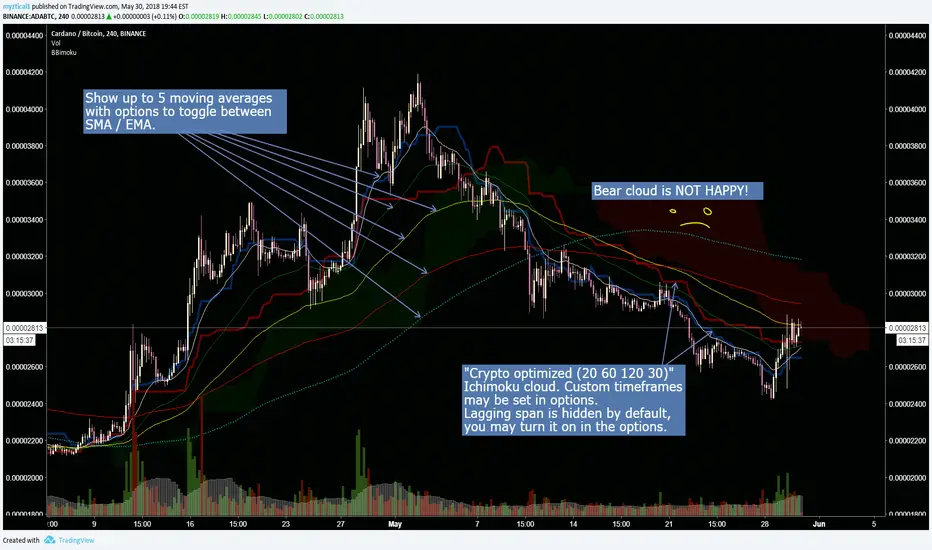
Crypto optimized Ichimoku and 5 variable SMA / EMAThis script has the option for showing up to 5 moving averages with options to toggle between SMA / EMA. Also includes crypto optimized Ichimoku cloud.
********This script was pieced together from various other's contributions from this site, and I cannot remember who the original authors are*******
Im just combining them to help others with free accounts and limited indicator availability like myself.
I hope this can help someone! Thank you and enjoy.


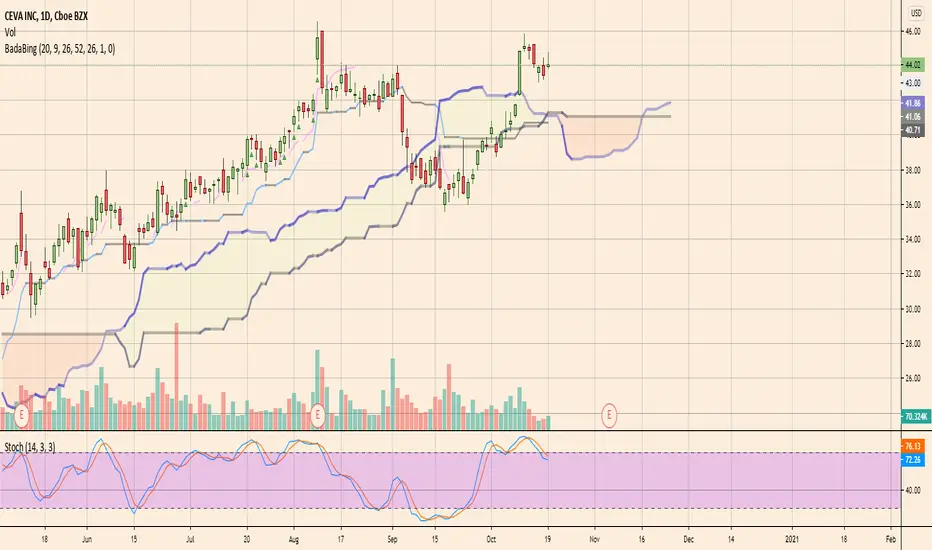
BadaBing Ichimokusignals with a "bada" when the conversionLine crosses the base line
signals with "bing" when:
1. cloud is bullish
2. future cloud is bullish
3. conversion line is above base line
4. base line is above cloud
5. price crosses above conversion line
(the short "bing" is when all the above conditions are false)
this just kind of codifies one of the simplest and safest ichimoku signals
profit taking is not detailed here...
a bada followed shortly by a bing is the best signal
improvements for later:
- I think I maxed out the number of plot calls. maybe need to split ichimoku plot itself from the signals
- add volatility filter using cloud width
- add overextension check by checking distance from conversion line (historically ive used an ATR buffer for this)
Ichimoku Cloud (Log-Space) - perfect trend areaLog space ichimoku cloud which display perfect bearish trend and perfect bullish trend.

Ichimoku Signals v1Plots when the bull/bear Ichimoku signals occur on the chart. The signals it plots are found here: www.ichimokutrader.com
In order from top to bottom it plots the signals as:
- Lagging-Line Cross
- Kumo Twist
- Baseline Cross
- TK-Cross
- Kumo Breakout
The colours on the plot indicate:
--- Bullish ---
- Light Green: Weak
- Medium Green: Neutral
- Dark Green: Strong
--- Bearish ---
- Light Red: Weak
- Medium Red: Neutral
- Dark Red: Strong

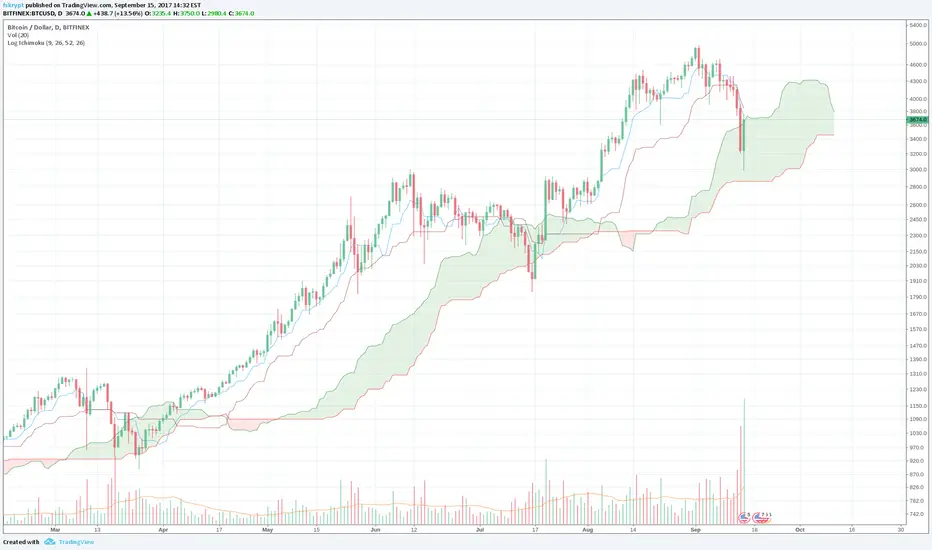
Log-space Ichimoku CloudThis indicator uses identical calculation to Ichimoku indicator except performed in log-space. This is helpful for long-term and highly volatile charts.
Oscars Simple Trend Ichimoku Kijun-senThis super simple Kijun-sen line borrowed from Ichimoku Clouds for trend following.

CM Enhanced Ichimoku Cloud V5Ichimoku Cloud Indicator With Cloud Shading Based On Trend!!!
I’m releasing this Indicator b/c of the New Feature that Allows Coding The Fill of The Cloud To Change Colors Based On Trend. However, I will be releasing a Much More Advanced Version Soon!!!
Current Features - Via Inputs Tab:
- Ability to Turn On/Off Every Plot Individually Via Check Box
- Ability To Turn On/Off Tenkan and Kinjun Crosses (Arrows)
***Features Coming Soon - All Will Have Capability to Turn On/Off:
- Bar Color Change when Entering The Cloud
- Filtered Tenkan and Kinjun Crosses To Plot Only With Trend, only Counter Trend, Or All Crosses
- Plot Arrows When Price Exits The Cloud.
- Plot Arrows When Lagging Line Crosses The Cloud Confirmed, or Not Confirmed by Price.
- Plus More!!!
- Basically Ability To Set Alerts Based On Any Condition!!!
WHAT ARE YOUR REQUESTS FOR FEATURES??? Comment Below.


Ichimoku Cloud (Auto Crypto/Non-Crypto settings)Save the hassle of switching back and forth between crypto and non-crypto settings by using the `syminfo.type` value under the hood.
If it's crypto it uses the 20, 60, 120, 30 settings, otherwise it uses 18, 52, 104, 26 defaults.
You can always override it using the Market Mode input in the settings.
The settings type is displayed in the top right of the chart as either "Crypto Cloud" or "Legacy Cloud" so you know which settings are being applied.

Ichimoku Cloud Anidjarcan be used in any timeframe
price crossing the cloud, buy or sell
blue line crossing red, attention to buy and sell
lagging line, inside prices, doing nothing, indicates trading, market consolidating.

Ichimoku cross and kumo switch Indicator [Mehdihz]This script has both cross and switch indicators.
** For switch indicator without shift, use 1 for Displacement

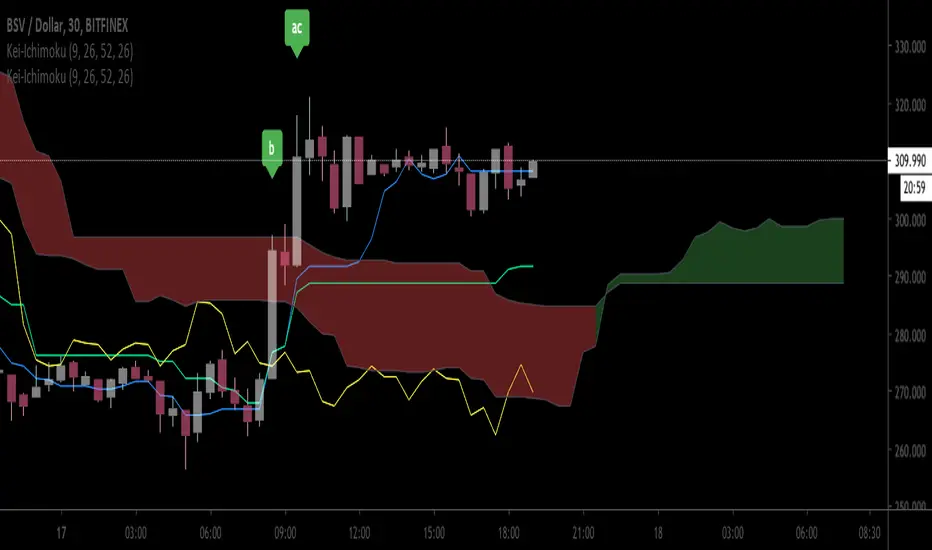
Ichimoku Cloud by Wei V1.3Label Sanyaku events, green for Gold and red for dead
- a: Tenkan sen Kijun Sen cross
- b: Chiko Span Cross Candle
- c: Kumo breakout
I also added a input option to draw chiko span differently. Original Chiko to draw Chiko as originally designed, and false to draw price at 25 bars earlier at current as "chiko span"