Grok's xAI Signal (GXS) Indicator for BTC V6Grok's xAI Signal (GXS) Indicator: A Simple Guide
Imagine trying to decide if Bitcoin is a "buy," "sell," or "wait" without staring at 10 different charts. The GXS Indicator does that for you—it's like a smart dashboard for BTC traders, overlaying signals right on your price chart. It boils down complex market clues into one easy score (from -1 "super bearish" to +1 "super bullish") and flashes green/red arrows or shaded zones when action's needed. No fancy math overload; just clear visuals like tiny triangles for trades, colored clouds for trends, and a bottom "mood bar" (green=up vibe, red=down, gray=meh).
At its core, GXS mixes three big-picture checks:
Price Momentum (50% weight): Quick scans of RSI (overbought/oversold vibes), MACD (speed of ups/downs), EMAs (is price riding the trend wave?), and Bollinger Bands (is the market squeezing for a breakout?). This catches short-term "hot or not" energy.
Network Health (30% weight): A simple "NVT" hack using trading volume vs. price to spot if BTC feels undervalued (buy hint) or overhyped (sell warning). It's like checking if the crowd's too excited or chill.
Trend Strength (20% weight): ADX filter ensures signals only fire in "trending" markets (not choppy sideways noise), plus a MACD boost for extra momentum nudge.
Why this approach? BTC's wild—pure price charts give false alarms in flat times, while ignoring volume/network ignores the "why" behind moves. GXS blends old-school TA (reliable for patterns) with on-chain smarts (crypto-specific "under the hood" data) and a trend gate (skips 70% of bad trades). It's conservative: Signals need the score to cross ±0.08 and a strong trend, reducing noise for swing/position traders. Result? Fewer emotional guesses, more "wait for confirmation" patience—perfect for volatile assets like BTC where hype kills.
Quick Tips to Tweak for Better Results
Start with defaults, then experiment on historical charts (backtest via TradingView's strategy tester if pairing with one):
Fewer False Signals: Bump thresholds to ±0.15 (buy/sell)—trades only on stronger conviction, cutting whipsaws by 20-30% in choppy markets. Or raise ADX thresh to 28 for "only big trends."
Faster/Slower Response: Shorten EMAs (e.g., 5/21) or RSI (10) for quicker scalps; lengthen (12/50) for swing holds. Test on 4H/daily BTC.
Volume Sensitivity: If NVT flips too often, extend its length to 20—smooths on-chain noise in bull runs.
Visual Polish: Crank cloud opacity to 80% for subtler fills; toggle off EMAs if they clutter. Enable table for score breakdowns during live trades.
Risk Tip: Always pair with stops (e.g., 2-3% below signals). On BTC, tweak in bull markets (looser thresh) vs. bears (tighter).
In short, GXS is your BTC "sixth sense"—balanced, not black-box. Tweak small, track win rate, and let trends lead. Happy trading!
ค้นหาในสคริปต์สำหรับ "grok+3有哪些股票"

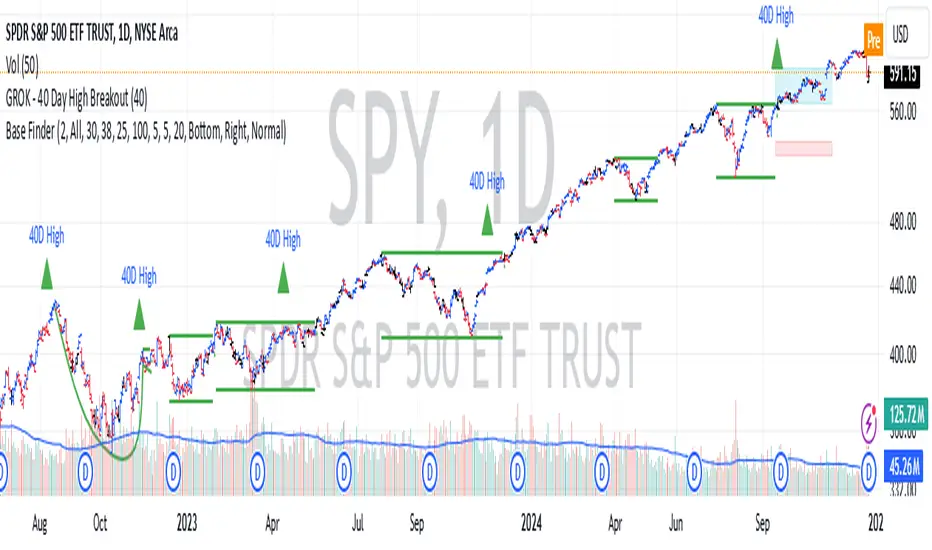
GROK - 40 Day High BreakoutTitle: GROK - Customizable High Breakout Detector
To scan base breakout with Pine Screener
Description:
This Pine Script indicator identifies high breakout patterns based on a user-defined lookback period. By default, it checks for a breakout of the 40-day high, but the period can be adjusted to suit your trading strategy. Key features include:
Custom Lookback Period: Easily modify the number of days for high breakout detection. Lookback period is length of base you want to scan using pine screener.
Visual Alerts: Displays a green triangle above the price bar when a breakout is detected.
Alert Conditions: Built-in alert notifications for automated breakout detection.
Screener Compatibility: Plots breakout signals as a histogram for screener use.
This script is ideal for traders looking to identify strong breakout patterns and incorporate them into their strategies.
How to Use:
Adjust the lookback period in the settings to match your desired breakout criteria.
Add alerts for automated notifications when a breakout is detected.
Use the visual markers and histogram to analyze breakout patterns on your chart.
TAPDA Vision by TSINCHRONISE ft Grok This is the newly created TAPDA vision indictor 🔮
This time I used Grok to make the entire thing, It currently is working but I am refining and will be upgrading some features.
For now it can carry out a number of important tasks for TAPDA traders :
-Highlights FVGs that haven't been tapped within customizable size an time parameters
-Highlights OBs that haven't been tapped within customizable size an time parameters
-Has Option to Highlight PD Arrays in for 3 different specific times of day (optional)
-Has a Dynamic Highlight function which will highlight untapped PD arrays which were formed in the current hour you are using the indicator and adjusts every hour automatically
This is a work in progress but is useable - Updates to come.

Market Breadth: Trends & BreakoutsVisualize the percentage of stocks in an index participating in trends and breakouts/breakdowns.
The default data source is the S & P 500: the percent of stocks above/below the 200 and 50 day moving averages, and the percentage of stocks making new 52 week breakouts/breakdowns. You can pick new data sources in the settings.
The blue band represents the percentage of stocks above/below the 200 day moving average. (It's always 100% in width, unlike say Bollinger bands). The thin blue lines are the same but for the 50 day moving average. The red and green areas represent the percentage of stocks making new 52 week highs/lows.
In the example chart you can see a divergence between the market as a whole which continues up and to the right throughout 2021, where as fewer and fewer stocks were above their own 200 day moving average, causing the blue band to trend down. Before the market turns beginning 2022 you can see more stocks making new 52 week lows, even as other stocks make 52 week highs. After the market tops, the percentage of 52 week lows intensifies and the percentage of stocks below their 200 day moving average is already over 50%.

Origin VWAP: OVWAPDraw a VWAP support/resistance line anchored to the origin of the data series (like a daily VWAP, but from the beginning of time, never resetting).
Ideally the origin would be the first bar after the IPO. Tradingview (or your connected broker) doesn't always have a complete dataset, and in that case the OVWAP will be 'wrong', but converging to the correct value over time.
You can try to simulate this with the built-in VWAP indicator but it has several bugs and limitations. Firstly, the longest time period is century, but it is not 100 years, ie. a rolling century but the beginning of the century: 21 years ago. Secondly, even if your dataset is less than 21 years, if you use a lower time frame then the built-in VWAP's origin becomes the left-most loaded bar (about 5,000 bars ago) - it will draw the wrong value. The new Anchored VWAP drawing tool can't be used on lower time frames as it won't draw the line at all unless it sees the point where you anchored it.
You may want to cut 'n paste this code to use in some larger strategy. Unfortunately that's probably not possible. This script uses the 'resolution=' option of 'study()' set to '1W', so the whole script runs at the 1 week resolution. You would think it would be possible to instead use the 'security()' function to request data at the '1W' resolution, but it just resamples the current data set and so is limited to the rightmost 5,000 bars.
Look in the options to enable standard deviation lines.

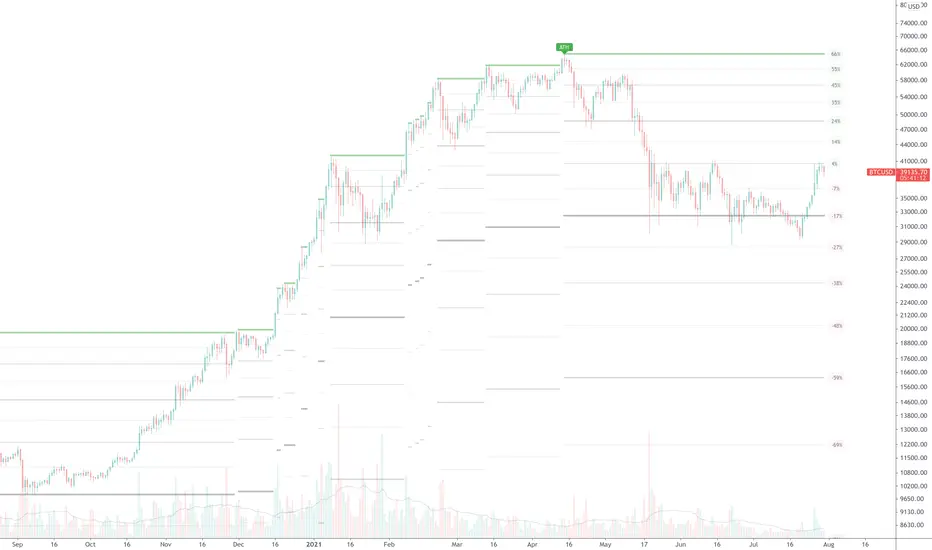
True ATH/ATL w/ labelsPlots the All Time High and All Time Low, with optional labels when a new ATH/ATL is created. Reaches all the way back in history for the true high/low, not limited to the most recent 5000 candles like most scripts. Works on all time frames.
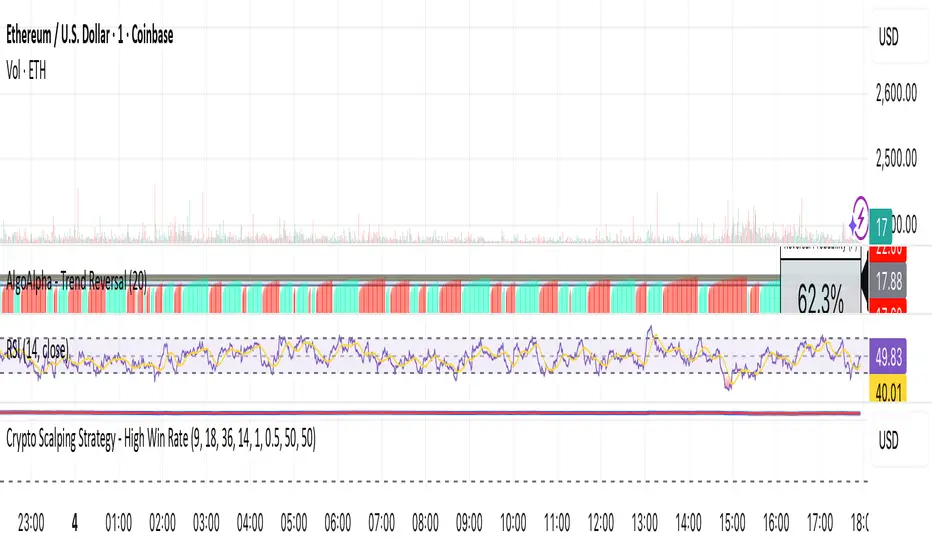
Crypto Scalping Strategy - High Win Rategrok first try. I used grok to create a scalping strategy that is automated for crypto scalp trading on 5-15 min intervals
BONK 1H Long Volatility StrategyGrok 1hr bonk strategy:
Key Changes and Why They’re Made
1. Indicator Adjustments
Moving Averages:
Fast MA: Changed to 5 periods (from, e.g., 9 on a higher timeframe).
Slow MA: Changed to 13 periods (from, e.g., 21).
Why: Shorter periods make the moving averages more sensitive to quick price changes on the 1-hour chart, helping identify trends faster.
ATR (Average True Range):
Length: Set to 10 periods (down from, e.g., 14).
Multiplier: Reduced to 1.5 (from, e.g., 2.0).
Why: A shorter ATR length tracks recent volatility better, and a lower multiplier lets the strategy catch smaller price swings, which are more common hourly.
RSI:
Kept at 14 periods with an overbought level of 70.
Why: RSI stays the same to filter out overbought conditions, maintaining consistency with the original strategy.
2. Entry Conditions
Trend: Requires the fast MA to be above the slow MA, ensuring a bullish direction.
Volatility: The candle’s range (high - low) must exceed 1.5 times the ATR, confirming a significant move.
Momentum: RSI must be below 70, avoiding entries at potential peaks.
Price: The close must be above the fast MA, signaling a pullback or trend continuation.
Why: These conditions are tightened to capture frequent volatility spikes while filtering out noise, which is more prevalent on a 1-hour chart.
3. Exit Strategy
Profit Target: Default is 5% (adjustable from 3-7%).
Stop-Loss: Default is 3% (adjustable from 1-5%).
Why: These levels remain conservative to lock in gains quickly and limit losses, suitable for the faster pace of a 1-hour timeframe.
4. Risk Management
The strategy may trigger more trades on a 1-hour chart. To avoid overtrading:
The ATR filter ensures only volatile moves are traded.
Trading fees (e.g., 0.5% on Coinbase) reduce the net profit to ~4% on winners and -3.5% on losers, requiring a win rate above 47% for profitability.
Suggestion: Risk only 1-2% of your capital per trade to manage exposure.
5. Visuals and Alerts
Plots: Blue fast MA, red slow MA, and green triangles for buy signals.
Alerts: Trigger when an entry condition is met, so you don’t need to watch the chart constantly.
How to Use the Strategy
Setup:
Load TradingView, select BONK/USD on the 1-hour chart (Coinbase pair).
Paste the script into the Pine Editor and add it to your chart.
Customize:
Adjust the profit target (e.g., 5%) and stop-loss (e.g., 3%) to your preference.
Tweak ATR or MA lengths if BONK’s volatility shifts.
Trade:
Look for green triangle signals and confirm with market context (e.g., volume or news).
Enter trades manually or via TradingView’s broker tools if supported.
Exit when the profit target or stop-loss is hit.
Test:
Use TradingView’s Strategy Tester to backtest on historical data and refine settings.
Benefits of the 1-Hour Timeframe
Faster Opportunities: Captures shorter-term uptrends in BONK’s volatile price action.
Responsive: Adjusted indicators react quickly to hourly changes.
Conservative: Maintains the 3-7% profit goal with tight risk control.
Potential Challenges
Noise: The 1-hour chart has more false signals. The ATR and MA filters help, but caution is needed.
Fees: Frequent trading increases costs, so ensure each trade’s potential justifies the expense.
Volatility: BONK can move unpredictably—monitor broader market trends or Solana ecosystem news.
Final Thoughts
Switching to a 1-hour timeframe makes the strategy more active, targeting shorter volatility spikes while keeping profits conservative at 3-7%. The adjusted indicators and conditions balance responsiveness with reliability. Backtest it on TradingView to confirm it suits BONK’s behavior, and always use proper risk management, as meme coins are highly speculative.
Disclaimer: This is for educational purposes, not financial advice. Cryptocurrency trading, especially with assets like BONK, is risky. Test thoroughly and trade responsibly.

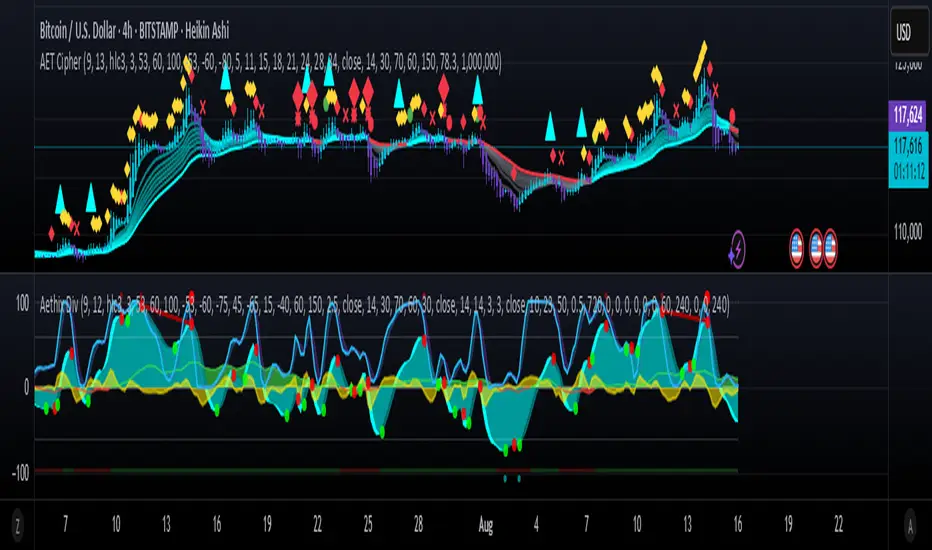
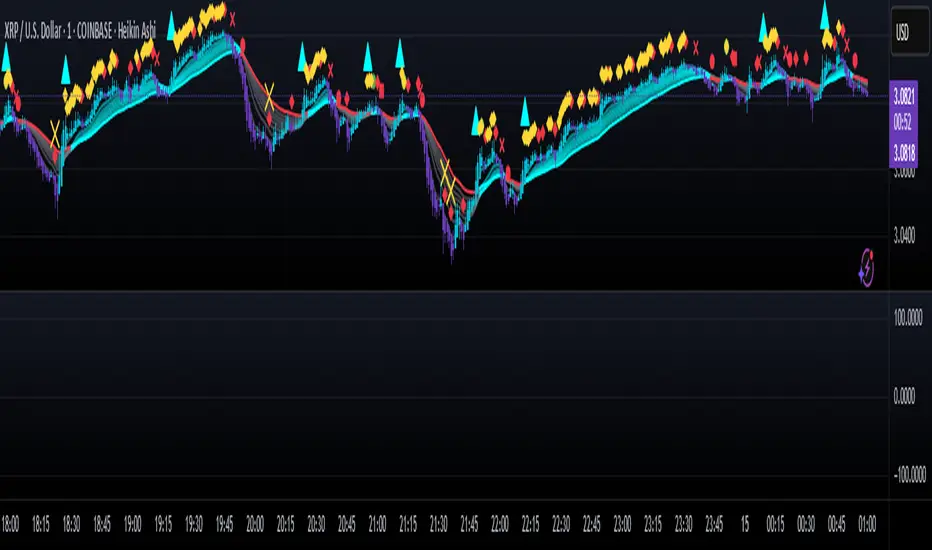
Aethix Cipher Pro2Aethix Cipher Pro: AI-Enhanced Crypto Signal Indicator grok Ai made signal created for aethix users.
Unlock the future of crypto trading with Aethix Cipher Pro—a powerhouse indicator inspired by Market Cipher A, turbocharged for Aethix.io users! Built on WaveTrend Oscillator, 8-EMA Ribbon, RSI+MFI, and custom enhancements like Grok AI confidence levels (70-100%), on-chain whale volume thresholds, and fun meme alerts ("To the moon! 🌕").
Key Features: no whale tabs
WaveTrend Signals: Spot overbought/oversold with levels at ±53/60/100—crosses trigger red diamonds, blood diamonds, yellow X's for high-prob buy/sell entries.
Neon Teal EMA Ribbon: Dynamic 5-34 EMA gradient (bullish teal/bearish red) for trend direction—crossovers plot green/red circles, blue triangles.
RSI+MFI Fusion: Overbought (70+)/oversold (30-) with long snippets for sentiment edges.

Aethix Cipher Pro2Aethix Cipher Pro: AI-Enhanced Crypto Signal Indicator grok Ai made signal created for aethix users.
Unlock the future of crypto trading with Aethix Cipher Pro—a powerhouse indicator inspired by Market Cipher A, turbocharged for Aethix.io users! Built on WaveTrend Oscillator, 8-EMA Ribbon, RSI+MFI, and custom enhancements like Grok AI confidence levels (70-100%), on-chain whale volume thresholds, and fun meme alerts ("To the moon! 🌕").
Key Features:
WaveTrend Signals: Spot overbought/oversold with levels at ±53/60/100—crosses trigger red diamonds, blood diamonds, yellow X's for high-prob buy/sell entries.
Neon Teal EMA Ribbon: Dynamic 5-34 EMA gradient (bullish teal/bearish red) for trend direction—crossovers plot green/red circles, blue triangles.
RSI+MFI Fusion: Overbought (70+)/oversold (30-) with long snippets for sentiment edges.
Aethix Cipher ProAethix Cipher Pro: AI-Enhanced Crypto Signal Indicator grok Ai made signal created for aethix users.
Unlock the future of crypto trading with Aethix Cipher Pro—a powerhouse indicator inspired by Market Cipher A, turbocharged for Aethix.io users! Built on WaveTrend Oscillator, 8-EMA Ribbon, RSI+MFI, and custom enhancements like Grok AI confidence levels (70-100%), on-chain whale volume thresholds, and fun meme alerts ("To the moon! 🌕").
Key Features:
WaveTrend Signals: Spot overbought/oversold with levels at ±53/60/100—crosses trigger red diamonds, blood diamonds, yellow X's for high-prob buy/sell entries.
Neon Teal EMA Ribbon: Dynamic 5-34 EMA gradient (bullish teal/bearish red) for trend direction—crossovers plot green/red circles, blue triangles.
RSI+MFI Fusion: Overbought (70+)/oversold (30-) with long snippets for sentiment edges.
ADR% Extension Levels from SMA 50I created this indicator inspired by RealSimpleAriel (a swing trader I recommend following on X) who does not buy stocks extended beyond 4 ADR% from the 50 SMA and uses extensions from the 50 SMA at 7-8-9-10-11-12-13 ADR% to take profits with a 20% position trimming.
RealSimpleAriel's strategy (as I understood it):
-> Focuses on leading stocks from leading groups and industries, i.e., those that have grown the most in the last 1-3-6 months (see on Finviz groups and then select sector-industry).
-> Targets stocks with the best technical setup for a breakout, above the 200 SMA in a bear market and above both the 50 SMA and 200 SMA in a bull market, selecting those with growing Earnings and Sales.
-> Buys stocks on breakout with a stop loss set at the day's low of the breakout and ensures they are not extended beyond 4 ADR% from the 50 SMA.
-> 3-5 day momentum burst: After a breakout, takes profits by selling 1/2 or 1/3 of the position after a 3-5 day upward move.
-> 20% trimming on extension from the 50 SMA: At 7 ADR% (ADR% calculated over 20 days) extension from the 50 SMA, takes profits by selling 20% of the remaining position. Continues to trim 20% of the remaining position based on the stock price extension from the 50 SMA, calculated using the 20-period ADR%, thus trimming 20% at 8-9-10-11 ADR% extension from the 50 SMA. Upon reaching 12-13 ADR% extension from the 50 SMA, considers the stock overextended, closes the remaining position, and evaluates a short.
-> Trailing stop with ascending SMA: Uses a chosen SMA (10, 20, or 50) as the definitive stop loss for the position, depending on the stock's movement speed (preferring larger SMAs for slower-moving stocks or for long-term theses). If the stock's closing price falls below the chosen SMA, the entire position is closed.
In summary:
-->Buy a breakout using the day's low of the breakout as the stop loss (this stop loss is the most critical).
--> Do not buy stocks extended beyond 4 ADR% from the 50 SMA.
--> Sell 1/2 or 1/3 of the position after 3-5 days of upward movement.
--> Trim 20% of the position at each 7-8-9-10-11-12-13 ADR% extension from the 50 SMA.
--> Close the entire position if the breakout fails and the day's low of the breakout is reached.
--> Close the entire position if the price, during the rise, falls below a chosen SMA (10, 20, or 50, depending on your preference).
--> Definitively close the position if it reaches 12-13 ADR% extension from the 50 SMA.
I used Grok from X to create this indicator. I am not a programmer, but based on the ADR% I use, it works.
Below is Grok from X's description of the indicator:
Script Description
The script is a custom indicator for TradingView that displays extension levels based on ADR% relative to the 50-period Simple Moving Average (SMA). Below is a detailed description of its features, structure, and behavior:
1. Purpose of the Indicator
Name: "ADR% Extension Levels from SMA 50".
Objective: Draw horizontal blue lines above and below the 50-period SMA, corresponding to specific ADR% multiples (4, 7, 8, 9, 10, 11, 12, 13). These levels represent potential price extension zones based on the average daily percentage volatility.
Overlay: The indicator is overlaid on the price chart (overlay=true), so the lines and SMA appear directly on the price graph.
2. Configurable Inputs
The indicator allows users to customize parameters through TradingView settings:
SMA Length (smaLength):
Default: 50 periods.
Description: Specifies the number of periods for calculating the Simple Moving Average (SMA). The 50-period SMA serves as the reference point for extension levels.
Constraint: Minimum 1 period.
ADR% Length (adrLength):
Default: 20 periods.
Description: Specifies the number of days to calculate the moving average of the daily high/low ratio, used to determine ADR%.
Constraint: Minimum 1 period.
Scale Factor (scaleFactor):
Default: 1.0.
Description: An optional multiplier to adjust the distance of extension levels from the SMA. Useful if levels are too close or too far due to an overly small or large ADR%.
Constraint: Minimum 0.1, increments of 0.1.
Tooltip: "Adjust if levels are too close or far from SMA".
3. Main Calculations
50-period SMA:
Calculated with ta.sma(close, smaLength) using the closing price (close).
Serves as the central line around which extension levels are drawn.
ADR% (Average Daily Range Percentage):
Formula: 100 * (ta.sma(dhigh / dlow, adrLength) - 1).
Details:
dhigh and dlow are the daily high and low prices, obtained via request.security(syminfo.tickerid, "D", high/low) to ensure data is daily-based, regardless of the chart's timeframe.
The dhigh / dlow ratio represents the daily percentage change.
The simple moving average (ta.sma) of this ratio over 20 days (adrLength) is subtracted by 1 and multiplied by 100 to obtain ADR% as a percentage.
The result is multiplied by scaleFactor for manual adjustments.
Extension Levels:
Defined as ADR% multiples: 4, 7, 8, 9, 10, 11, 12, 13.
Stored in an array (levels) for easy iteration.
For each level, prices above and below the SMA are calculated as:
Above: sma50 * (1 + (level * adrPercent / 100))
Below: sma50 * (1 - (level * adrPercent / 100))
These represent price levels corresponding to a percentage change from the SMA equal to level * ADR%.
4. Visualization
Horizontal Blue Lines:
For each level (4, 7, 8, 9, 10, 11, 12, 13 ADR%), two lines are drawn:
One above the SMA (e.g., +4 ADR%).
One below the SMA (e.g., -4 ADR%).
Color: Blue (color.blue).
Style: Solid (style=line.style_solid).
Management:
Each level has dedicated variables for upper and lower lines (e.g., upperLine1, lowerLine1 for 4 ADR%).
Previous lines are deleted with line.delete before drawing new ones to avoid overlaps.
Lines are updated at each bar with line.new(bar_index , level, bar_index, level), covering the range from the previous bar to the current one.
Labels:
Displayed only on the last bar (barstate.islast) to avoid clutter.
For each level, two labels:
Above: E.g., "4 ADR%", positioned above the upper line (style=label.style_label_down).
Below: E.g., "-4 ADR%", positioned below the lower line (style=label.style_label_up).
Color: Blue background, white text.
50-period SMA:
Drawn as a gray line (color.gray) for visual reference.
Diagnostics:
ADR% Plot: ADR% is plotted in the status line (orange, histogram style) to verify the value.
ADR% Label: A label on the last bar near the SMA shows the exact ADR% value (e.g., "ADR%: 2.34%"), with a gray background and white text.
5. Behavior
Dynamic Updating:
Lines update with each new bar to reflect new SMA 50 and ADR% values.
Since ADR% uses daily data ("D"), it remains constant within the same day but changes day-to-day.
Visibility Across All Bars:
Lines are drawn on every bar, not just the last one, ensuring visibility on historical data as well.
Adaptability:
The scaleFactor allows level adjustments if ADR% is too small (e.g., for low-volatility symbols) or too large (e.g., for cryptocurrencies).
Compatibility:
Works on any timeframe since ADR% is calculated from daily data.
Suitable for symbols with varying volatility (e.g., stocks, forex, cryptocurrencies).
6. Intended Use
Technical Analysis: Extension levels represent significant price zones based on average daily volatility. They can be used to:
Identify potential price targets (e.g., take profit at +7 ADR%).
Assess support/resistance zones (e.g., -4 ADR% as support).
Measure price extension relative to the 50 SMA.
Trading: Useful for strategies based on breakouts or mean reversion, where ADR% levels indicate reversal or continuation points.
Debugging: Labels and ADR% plot help verify that values align with the symbol’s volatility.
7. Limitations
Dependence on Daily Data: ADR% is based on daily dhigh/dlow, so it may not reflect intraday volatility on short timeframes (e.g., 1 minute).
Extreme ADR% Values: For low-volatility symbols (e.g., bonds) or high-volatility symbols (e.g., meme stocks), ADR% may require adjustments via scaleFactor.
Graphical Load: Drawing 16 lines (8 upper, 8 lower) on every bar may slow the chart for very long historical periods, though line management is optimized.
ADR% Formula: The formula 100 * (sma(dhigh/dlow, Length) - 1) may produce different values compared to other ADR% definitions (e.g., (high - low) / close * 100), so users should be aware of the context.
8. Visual Example
On a chart of a stock like TSLA (daily timeframe):
The 50 SMA is a gray line tracking the average trend.
Assuming an ADR% of 3%:
At +4 ADR% (12%), a blue line appears at sma50 * 1.12.
At -4 ADR% (-12%), a blue line appears at sma50 * 0.88.
Other lines appear at ±7, ±8, ±9, ±10, ±11, ±12, ±13 ADR%.
On the last bar, labels show "4 ADR%", "-4 ADR%", etc., and a gray label shows "ADR%: 3.00%".
ADR% is visible in the status line as an orange histogram.
9. Code: Technical Structure
Language: Pine Script @version=5.
Inputs: Three configurable parameters (smaLength, adrLength, scaleFactor).
Calculations:
SMA: ta.sma(close, smaLength).
ADR%: 100 * (ta.sma(dhigh / dlow, adrLength) - 1) * scaleFactor.
Levels: sma50 * (1 ± (level * adrPercent / 100)).
Graphics:
Lines: Created with line.new, deleted with line.delete to avoid overlaps.
Labels: Created with label.new only on the last bar.
Plots: plot(sma50) for the SMA, plot(adrPercent) for debugging.
Optimization: Uses dedicated variables for each line (e.g., upperLine1, lowerLine1) for clear management and to respect TradingView’s graphical object limits.
10. Possible Improvements
Option to show lines only on the last bar: Would reduce visual clutter.
Customizable line styles: Allow users to choose color or style (e.g., dashed).
Alert for anomalous ADR%: A message if ADR% is too small or large.
Dynamic levels: Allow users to specify ADR% multiples via input.
Optimization for short timeframes: Adapt ADR% for intraday timeframes.
Conclusion
The script creates a visual indicator that helps traders identify price extension levels based on daily volatility (ADR%) relative to the 50 SMA. It is robust, configurable, and includes debugging tools (ADR% plot and labels) to verify values. The ADR% formula based on dhigh/dlow

SPX Year-End 2025 Targets by AnalystsJust year end analyst targets for SPX as of 02 October 2025, as answered by Grok

Aethix Cipher DivergencesAethix Cipher Divergences v6
Core Hook: Custom indicator inspired by VuManChu B, Grok-enhanced for crypto intel—blends WaveTrend (WT) oscillator with multi-divergences for buy/sell circles (green/teal buys #00FFFF, red sells) and dots (divs, gold overbought alerts).
Key Features:
WaveTrend Waves: Dual waves (teal WT1, darker teal WT2) with VWAP (purple for neon vibe), overbought/oversold lines, crosses for signals.
Divergences: Regular/hidden for WT, RSI, Stoch—red bearish, green bullish dots; extra range for deeper insights.
RSI + MFI Area: Colored area (green positive, red negative) for sentiment/volume flow.
Stochastic RSI: K/D lines with fill for overbought/oversold trends.
Schaff Trend Cycle: Purple line for cycle smoothing.
Sommi Patterns: Flags (pink bearish, blue bullish) and diamonds for HTF patterns, purple higher VWAP.
MACD Colors on WT: Dynamic WT shading based on MACD for enhanced reads.

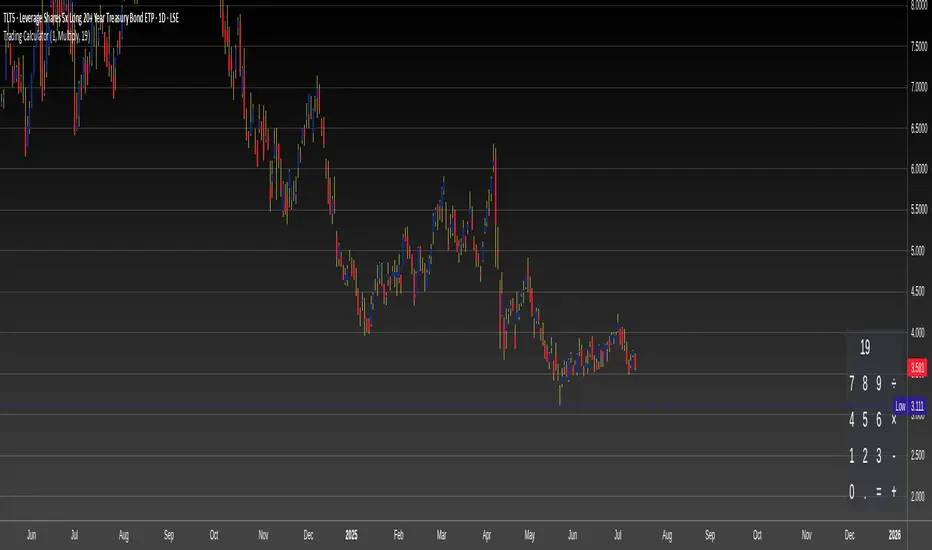
Trading CalculatorTrading Calculator Indicator
VIBE CODED WITH GROK 3
The Trading Calculator is a Pine Script indicator designed to perform quick and useful trading-related calculations directly on your chart. It allows traders to execute basic arithmetic operations—such as addition, subtraction, multiplication, and division—as well as calculate percent change and average using either numerical values or trading variables (e.g., close, open, high, low, volume). The indicator displays its results in a table that resembles a calculator interface, making it both functional and visually intuitive. Unlike typical indicators, it does not overlay on the price chart but instead appears in a separate pane.
Inputs
Formula (new | old): First value or variable (e.g., 100, close, close ). Example: close uses the current closing price.
Operator: Mathematical operation (e.g., Plus, Minus, Multiply). Example: Plus adds the two inputs.
Second Input: Second value or variable (e.g., 50, open, close ). Example: open uses the current opening price.
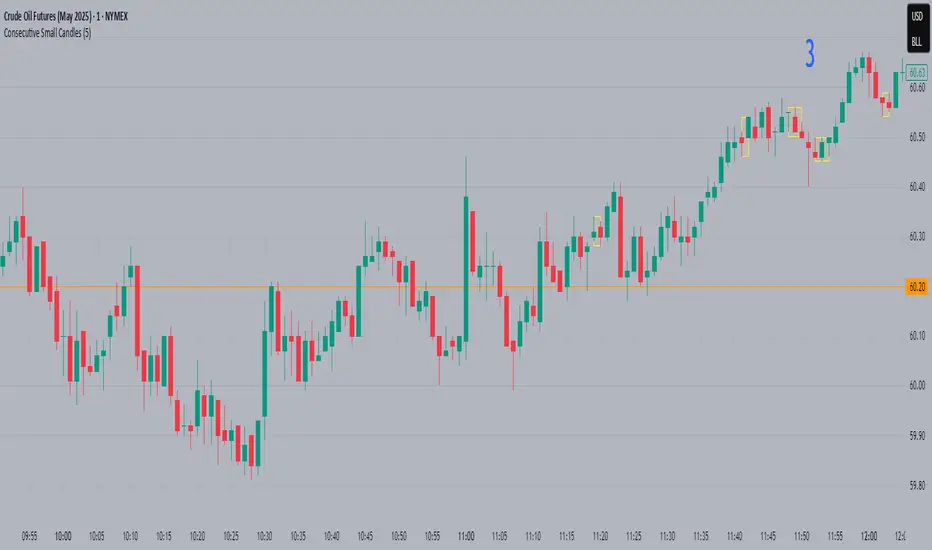
Consecutive Small CandlesThis script identifies relatively "small" candles based on their being smaller than a maximum size you set based on the instrument and your own criteria. Default is 5, as I use this indicator largely on CL which rarely has candles smaller than 3 ticks but frequently greater than 5.
It identifies 2 or more consecutive candles to help identify patterns similar to Bob Volman's Double Doji Break methodolgy. Written by Grok 3.
Momentum Volume Divergence (MVD) EnhancedMomentum Volume Divergence (MVD) Enhanced is a powerful indicator that detects price-momentum divergences and momentum suppression for reversal trading. Optimized for XRP on 1D charts, it features dynamic lookbacks, ATR-adjusted thresholds, and SMA confirmation. Signals include strong divergences (triangles) and suppression warnings (crosses). Includes a detailed user guide—try it out and share your feedback!
Setup: Add to XRP 1D chart with defaults (mom_length_base=8, vol_length_base=10). Signals: Red triangle (sell), Green triangle (buy), Orange cross (bear warning), Yellow cross (bull warning). Confirm with 5-day SMA crossovers. See full guide for details!
Disclaimer: This indicator is for educational purposes only, not financial advice. Trading involves risk—use at your discretion.
Momentum Volume Divergence (MVD) Enhanced Indicator User Guide
Version: Pine Script v6
Designed for: TradingView
Recommended Use: XRP on 1-day (1D) chart
Date: March 18, 2025
Author: Herschel with assistance from Grok 3 (xAI)
Overview
The Momentum Volume Divergence (MVD) Enhanced indicator is a powerful tool for identifying price-momentum divergences and momentum suppression patterns on XRP’s 1-day (1D) chart. Plotted below the price chart, it provides clear visual signals to help traders spot potential reversals and trend shifts.
Purpose
Detect divergences between price and momentum for buy/sell opportunities.
Highlight momentum suppression as warnings of fading trends.
Offer actionable trading signals with intuitive markers.
Indicator Components
Main Plot
Volume-Weighted Momentum (vw_mom): Blue line showing momentum adjusted by volume.
Above 0 = bullish momentum.
Below 0 = bearish momentum.
Zero Line: Gray dashed line at 0, separating bullish/bearish zones.
Key Signals
Strong Bearish Divergence:
Marker: Red triangle at the top.
Meaning: Price makes a higher high, but momentum weakens, confirmed by a drop below the 5-day SMA.
Action: Potential sell/short signal.
Strong Bullish Divergence:
Marker: Green triangle at the bottom.
Meaning: Price makes a lower low, but momentum strengthens, confirmed by a rise above the 5-day SMA.
Action: Potential buy/long signal.
Bearish Suppression:
Marker: Orange cross at the top + red background.
Meaning: Strong bullish momentum with low volume in a volume downtrend, suggesting fading strength.
Action: Warning to avoid longs or exit early.
Bullish Suppression:
Marker: Yellow cross at the bottom + green background.
Meaning: Strong bearish momentum with low volume in a volume uptrend, suggesting fading weakness.
Action: Warning to avoid shorts or exit early.
Debug Plots (Optional)
Volume Ratio: Gray line (volume vs. its MA) vs. yellow line (threshold).
Momentum Threshold: Purple lines (positive/negative momentum cutoffs).
Smoothed Momentum: Orange line (raw momentum).
Confirmation SMA: Purple line (price trend confirmation).
Labels
Text labels (e.g., "Bear Div," "Bull Supp") mark detected patterns.
How to Use the Indicator
Step-by-Step Trading Process
1. Monitor the Chart
Load your XRP 1D chart with the indicator applied.
Observe the blue vw_mom line and signal markers.
2. Spot a Signal
Primary Signals: Look for red triangles (strong_bear) or green triangles (strong_bull).
Warnings: Note orange crosses (suppression_bear) or yellow crosses (suppression_bull).
3. Confirm the Signal
For Strong Bullish Divergence (Buy):
Green triangle appears.
Price closes above the 5-day SMA (purple line) and a recent swing high.
Optional: Volume ratio (gray line) exceeds the threshold (yellow line).
For Strong Bearish Divergence (Sell):
Red triangle appears.
Price closes below the 5-day SMA and a recent swing low.
Optional: Volume ratio (gray line) falls below the threshold (yellow line).
4. Enter the Trade
Long:
Buy at the close of the signal bar.
Stop loss: Below the recent swing low or 2 × ATR(14) below entry.
Short:
Sell/short at the close of the signal bar.
Stop loss: Above the recent swing high or 2 × ATR(14) above entry.
5. Manage the Trade
Take Profit:
Aim for a 2:1 or 3:1 risk-reward ratio (e.g., risk $0.05, target $0.10-$0.15).
Or exit when an opposite suppression signal appears (e.g., orange cross for longs).
Trailing Stop:
Move stop to breakeven after a 1:1 RR move.
Trail using the 5-day SMA or 2 × ATR(14).
Early Exit:
Exit if a suppression signal appears against your position (e.g., suppression_bull while short).
6. Filter Out Noise
Avoid trades if a suppression signal precedes a divergence within 2-3 days.
Optional: Add a 50-day SMA on the price chart:
Longs only if price > 50-SMA.
Shorts only if price < 50-SMA.
Example Trades (XRP 1D)
Bullish Trade
Signal: Green triangle (strong_bull) at $0.55.
Confirmation: Price closes above 5-SMA and $0.57 high.
Entry: Buy at $0.58.
Stop Loss: $0.53 (recent low).
Take Profit: $0.63 (2:1 RR) or exit on suppression_bear.
Outcome: Price hits $0.64, exit at $0.63 for profit.
Bearish Trade
Signal: Red triangle (strong_bear) at $0.70.
Confirmation: Price closes below 5-SMA and $0.68 low.
Entry: Short at $0.67.
Stop Loss: $0.71 (recent high).
Take Profit: $0.62 (2:1 RR) or exit on suppression_bull.
Outcome: Price drops to $0.61, exit at $0.62 for profit.
Tips for Success
Combine with Price Levels:
Use support/resistance zones (e.g., weekly pivots) to confirm entries.
Monitor Volume:
Rising volume (gray line above yellow) strengthens signals.
Adjust Sensitivity:
Too many signals? Increase div_strength_threshold to 0.7.
Too few signals? Decrease to 0.3.
Backtest:
Review 20-30 past signals on XRP 1D to assess performance.
Avoid Choppy Markets:
Skip signals during low volatility (tight price ranges).
Troubleshooting
No Signals:
Lower div_strength_threshold to 0.3 or mom_threshold_base to 0.2.
Check if XRP’s volatility is unusually low.
False Signals:
Increase sma_confirm_length to 7 or add a 50-SMA filter.
Indicator Not Loading:
Ensure the script compiles without errors.
Customization (Optional)
Change Colors: Edit color.* values (e.g., color.red to color.purple).
Add Alerts: Use TradingView’s alert menu for "Strong Bearish Divergence Confirmed," etc.
Test Other Assets: Experiment with BTC or ETH, adjusting inputs as needed.
Disclaimer
This indicator is for educational purposes only and not financial advice. Trading involves risk, and past performance does not guarantee future results. Use at your own discretion.
Setup: Use on XRP 1D with defaults (mom_length_base=8, vol_length_base=10). Signals: Red triangle (sell), Green triangle (buy), Orange cross (bear warning), Yellow cross (bull warning). Confirm with 5-day SMA cross. Stop: 2x ATR(14). Profit: 2:1 RR or suppression exit. Full guide available separately!

ALN Sessions - for NQ2/24/25 - v1
This script does not calculate any stats.
It uses the sessions and stats from NQStats/ALNSessions
Option to draw boxes around the session times.
Options to adjust the table text/background colors/position.
The logic will determine how the Asia and London sessions interact.
Once the New York session starts (8am), it will then display the appropriate stats.
Script quirk...fyi. The script removes the stats table at 6PM.
That's just how it works. I used grok to assist with the code, and it got funky. It works, so I left it that way.
The appropriate stats table will then be displayed when the next New York session begins.
---
There is another table I used just for troubleshooting to show the values of the Asia/London session highs/lows. This can just be ignored.
3/3/25 - republished.
