Correlation with Matrix TableCorrelation coefficient is a measure of the strength of the relationship between two values. It can be useful for market analysis, cryptocurrencies, forex and much more.
Since it "describes the degree to which two series tend to deviate from their moving average values" (1), first of all you have to set the length of these moving averages. You can also retrieve the values from another timeframe, and choose whether or not to ignore the gaps.
After selecting the reference ticker, which is not dependent from the chart you are on, you can choose up to eight other tickers to relate to it. The provided matrix table will then give you a deeper insight through all of the correlations between the chosen symbols.
Correlation values are scored on a scale from 1 to -1
A value of 1 means the correlation between the values is perfect.
A value of 0 means that there is no correlation at all.
A value of -1 indicates that the correlation is perfectly opposite.
For a better view at a glance, eight level colors are available and it is possible to modify them at will. You can even change level ranges by setting their threshold values. The background color of the matrix's cells will change accordingly to all of these choices.
The default threshold values, commonly used in statistics, are as follows:
None to weak correlation: 0 - 0.3
Weak to moderate correlation: 0.3 - 0.5
Moderate to high correlation: 0.5 - 0.7
High to perfect correlation: 0.7 - 1
Remember to be careful about spurious correlations, which are strong correlations without a real causal relationship.
(1) www.tradingview.com
ค้นหาในสคริปต์สำหรับ "gaps"

ICT Fair Value Gap [LM]Hello traders,
I would like to present you ICT Fair Value Gap script. The idea is the same as in my other script to look form imbalances. I have improved the previous script from teaching of ICT and created this script to train the eye to see those gaps. Shrinking option also shows if the gap has been already filled and also in case gap is filled you can get alert in case you will set it up .
The script has two settings:
general settings - definition of volatility condition for middle candle
box settings - setting for boxes, box colors, shrinking
I hope you enjoy it,
Lukas

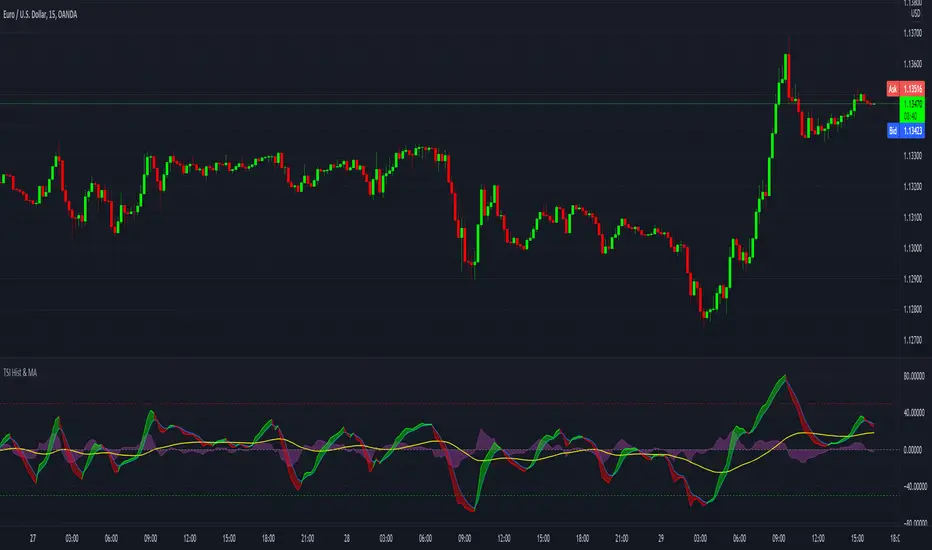
TSI with histogram and MA - SamXThis is an enhanced TSI. The others I've found on here have generally lacked sufficient settings context and/or alert definitions, so I made this version to address those gaps. In addition to that, I also added a way to plot a user-customizable moving average line of the TSI to better help identify trending conditions across TSI swings.
Alert(), alertcondition() or strategy alerts?Variety of possibilities offered by PineScript, especially thanks to recent additions, created some confusion. Especially one question repeats quite often - which method to use to trigger alerts?
I'm posting this to clarify and give some syntax examples. I'll discuss these 3 methods in chronological order, meaning - in the order they were introduced to PineScript.
ALERTCONDITION() - it is a function call, which can be used only in study-type script. Since years ago, you could create 2 types of a script: strategy and study. First one enables creating a backtest of a strategy. Second was to develop scripts which didn't require backtesting and could trigger alerts. alertcondition() calls in strategy-type scripts were rejected by Pine compiler. On the other hand compiling study-type scripts rejected all strategy...() calls. That created difficulties, because once you had a nice and backtested strategy, you had to rip it off from all strategy...() function calls to convert your script to study-type so you could produce alerts. Maintenance of two versions of each script was necessary and it was painful.
"STRATEGY ALERTS" were introduced because of alertcondition() pains. To create strategy alert, you need to click "Add alert" button inside Strategy Tester (backtester) and only there. Alerts set-up this way are bound with the backtester - whenever backtester triggers an order, which is visible on the chart, alert is also fired. And you can customize alert message using some placeholders like {{strategy.order.contracts}} or {{ticker}}.
ALERT() was added last. This is an alerts-triggering function call, which can be run from strategy-type script. Finally it is doable! You can connect it to any event coded in PineScript and generate any alert message you want, thanks to concatenation of strings and wrapping variables into tostring() function.
Out of these three alertcondition() is obviously archaic and probably will be discontinued. There is a chance this makes strategy/study distinction not making sense anymore, so I wouldn't be surprised if "studies" are deprecated at some point.
But what are the differences between "Strategy alerts" and alert()? "Strategy alerts" seem easier to set-up with just a few clicks and probably easier to understand and verify, because they go in sync with the backtester and on-chart trade markers. It is especially important to understand how they work if you're building strategy based on pending orders (stop and limit) - events in your code might trigger placing pending order, but alert will be triggered only (and when) such order is executed.
But "Strategy Alerts" have some limitations - not every variable you'd like to include in alert message is available from PineScript. And maybe you don't need the alert fired when the trade hit a stop-loss or take-profit, because you have already forwarded info about closing conditions in entry alert to your broker/exchange.
Alert() was added to PineScript to fill all these gaps. Is allows concatenating any alert message you want, with any variable you want inside it and you can attach alert() function at any event in your PineScript code. For example - when placing orders, crossing variables, exiting trades, but not explicitly at pending orders execution.
The Verdict
"Strategy Alerts" might seem a better fit - easier to set-up and verify, flexible and they fire only when a trade really happens, not producing unnecessary mess when each pending order is placed. But these advantages are illusionary, because they don't give you the full-control which is needed when trading with real money. Especially when using pending orders. If an alert is fired when price actually hit a stop-order or limit-order level, and even if you are executing such alert within 1 second thanks to a tool like TradingConnector, you might already be late and you are making entry at a market price. Slippage will play a great role here. You need to send ordering alert when logical conditions are met - then it will be executed at the price you want. Even if you need to cancel all the pending orders which were not executed. Because of that I strongly recommend sticking to ALERT() when building your alerts system.
Below is an example strategy, showing syntax to manage placing the orders and cancelling them. Yes, this is another spin-off from my TradingView Alerts to MT4 MT5 . As usual, please don't pay attention to backtest results, as this is educational script only.
P.S. For the last time - farewell alertcondition(). You served us well.

Volatility GuppyBased on my previous script "Turtle N Normalized," this script plots the CM SuperGuppy on the value of N to identify changing trends in the volatility of any instrument.
Turtle rules taken from an online PDF:
"The Turtles used a concept that Richard Dennis and Bill Eckhardt called N to represent the underlying volatility of a particular market.
N is simply the 20-day exponential moving average of the True Range, which is now more commonly known as the ATR. Conceptually, N represents the average range in price movement that a particular market makes in a single day, accounting for opening gaps. N was measured in the same points as the underlying contract.
The Turtles built positions in pieces which we called Units. Units were sized so that 1 N represented 1% of the account equity. Thus, a unit for a given market or commodity can be calculated using the following formula:
Unit = 1% of Account/(N x Dollars per Point)"
To normalize the Unit formula, this script instead takes the value of (close/N). Dollars per point = 1 for stocks and crypto, but will change depending on the contract specifications for individual futures .
"Since the Turtles used the Unit as the base measure for position size, and since those units were volatility risk adjusted, the Unit was a measure of both the risk of a position, and of the entire portfolio of positions."
When the EMA's are green, volatility is decreasing.
When the EMA's are red, volatility is increasing.
When the EMA's are grey, the trend is changing.

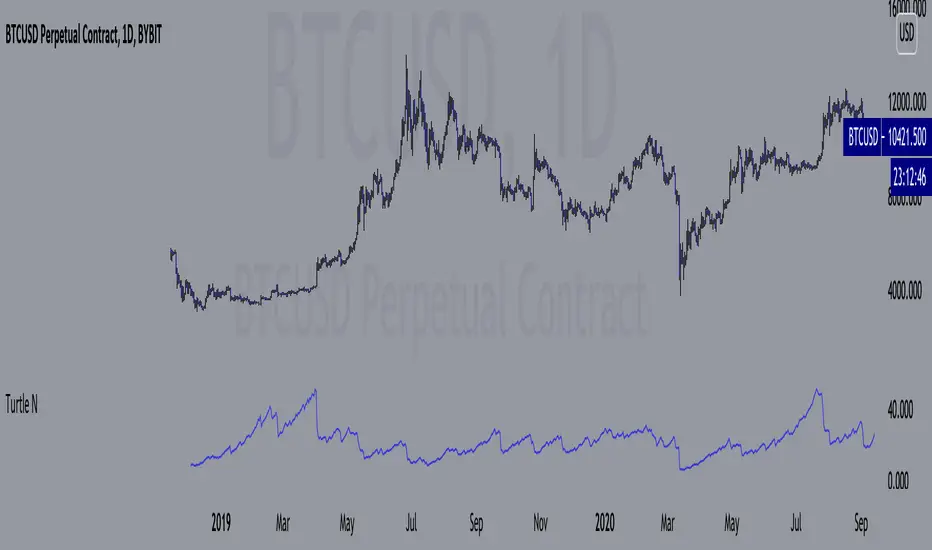
Turtle N NormalizedSimple script that calculates the normalized value of N. Rules taken from an online PDF containing the original Turtle system:
"The Turtles used a volatility-based constant percentage risk position sizing algorithm. The Turtles used a concept that Richard Dennis and Bill Eckhardt called N to represent the underlying volatility of a particular market.
N is simply the 20-day exponential moving average of the True Range, which is now more commonly known as the ATR. Conceptually, N represents the average range in price movement that a particular market makes in a single day, accounting for opening gaps. N was measured in the same points as the underlying contract.
The Turtles built positions in pieces which we called Units. Units were sized so that 1 N represented 1% of the account equity. Thus, a unit for a given market or commodity can be calculated using the following formula:
Unit = 1% of Account/(N x Dollars per Point)"
To normalize the Unit formula, this script instead takes the value of (close/N). Dollars per point = 1 for stocks and crypto, but will change depending on the contract specifications for individual futures.
"Since the Turtles used the Unit as the base measure for position size, and since those units were volatility risk adjusted, the Unit was a measure of both the risk of a position, and of the entire portfolio of positions."
When the value of N is high, volatility is low and you should be more risk-on.
When the value of N is low, volatility is high and you should be more risk-off.
True Accumulation/DistributionAccumulation/Distribution is developed by Marc Chaikin to provide insight into strength of a trend by measuring flow of buy and sell volume.
The fact that A/D only factors current period's range for calculating the volume multiplier causes problem with price gaps. They are ignored or even misinterpreted.
True Accumulation/Distribution solves the problem by using True Range instead of only relying on current period's high and low.
In this example you can see when a gap has occurred in Amazon Inc.'s daily chart True A/D has handled it better than Accumulation/Distribution which a bearish close in period's range has caused it to misinterpret the strong buy pressure as sell volume.

Grover Llorens Activator Strategy AnalysisThe Grover Llorens Activator is a trailing stop indicator deeply inspired by the parabolic SAR indicator, and aim to provide early exit points and reversal detection. The indicator was posted not so long ago, you can find it here :
Today a strategy using the indicator is proposed, and its profitability is analyzed on 3 different markets with the main time frame being 1 hour, remember that lower time frames involve lower absolute price changes, therefore we are way more affected by the spread, and we can require a larger position sizing depending on our investment target, trading higher time-frames is always a good practice and this is why 1 hour is selected. Based on the result we might make various conclusions regarding the indicator accuracy and might have ideas on future improvements of the indicator.
I'am not great when it comes to strategy design, i still hope to share correct and useful information in this post, let me know your thoughts on the post format and if i should make more of these.
Setup And Rules
The analysis is solely based on the indicator signals, money management isn't taken into account, this allow us to have an idea on the indicator robustness and resilience, particularly on extremely volatile markets and ones exhibiting a chaotic structure, altho it is normally good practice to close any position before a market closure in order to avoid any potential major gaps.
The settings used are 480 for length and 14 for mult, this create relatively mid term signals that are suited for a trend indicator such as the Grover Llorens Activator, unfortunately we can't infer the indicator optimal settings, thats how it is with any technical indicator anyway.
Here are the rules of our strategy :
long : closing price cross over the indicator
short : closing price cross under the indicator
We use constant position sizing, once a signal is triggered all the previous positions are closed.
Description Of The Statistics Used
Various statistics are presented in this post, here is a brief description of the main ones :
Percent Profitability (higher = better): Percentage of winning trades, that is : winning trades/total number of trades × 100
Maximum Drawdown (lower = better) : The highest difference between a peak and a valley in the balance, that is : peak - valley , in percentage : (peak - valley)/peak × 100
Profit Factor (higher = better) : Gross profit divided by gross loss, values under 1 represent gross losses superior to the gross profits
Remember that more volatility = more risk, since higher absolute price changes can logically cause larger losses.
EURUSD
The first market analyzed is the Forex market with the EURUSD major pair with a position sizing of 1000 units (1 micro lot). Since October EURUSD is not showing any particular strong trend but posses a discrete rising motion, fortunately cycles can be observed.
The equity was rising until two trades appeared causing a decline in the equity. Before October a bearish market could be observed.
We can see that the equity is rising, the trend still posses various retracements that affect our indicator, however we can see that the indicator totally nail the end of the trend, thats the power of converging toward the price.
In short :
$ 86.63 net profit
340 closed trades
37.65 % profitable (thats a lot of loosing trades)
1.19 profit factor
$ 76.67 max drawdown
Applying a spread would create negative results (in general the average spread is used), not a great start...
BTCUSD
The cryptocurrency market is relatively more volatile than others, which also mean potentially higher returns, we test the indicator using certainly the most traded cryptocurrency, BTCUSD. We will use a position sizing of 1 unit.
In the case of BTCUSD the strategy balance is relatively stationary around the initial capital, with of course high dispersion.
from september to december the market is bearish with various ranging periods, no apparent cycles can be observed, except maybe in the ranging period of october, this ranging period is followed by a non linear trend (relatively parabolic) that the indicator failed to capture in its integrity (this is a recurrent problem and it is starting to piss me off xD).
In short :
$ 2010.64 net profit (aka how i bet the crypto market)
395 closed trades
38.23 % profitable
1.036 profit factor
$ 5738.01 max drawdown (aka how i lost to the crypto market)
AMD
AMD stand for Advanced Micro Devices and is a company focused on the development of computer technology, i love the microprocessor market and i really like AMD who start this year in a pretty great way with a net bullish trend.
The performance of the indicator on AMD is decent (at last !) with the equity producing many new higher highs. The indicator performance still drop in the middle end of 2019 with a large equity drawdown of 17$ caused by the gap of august 8. Unfortunately AMD, like lot of well behaving stocks can only tells us that the indicator has good performances on heavily trending markets with no excess of noise or chaotic structures.
In short :
$ 17.86 net profit (Enough for a consistent lunch)
295 closed trades
36.27 % profitable
1.414 profit factor
$ 10.37 max drawdown.
Conclusion
A strategy using the recently proposed Grover Llorens activator has been presented. We can easily conclude that the indicator can't possibly generate long term returns under chaotic and volatile markets, and could even produce unnecessary trades in trending markets without much parasitic fluctuations such as noise and retracements (think about a simple linear trend) since the indicator converge toward the price and would therefore automatically cross over/under the trend, thus guaranteeing a false signal.
However we have seen its ability to provide accurate early reversal detection shine from time to time, thus over performing lagging indicators in this aspect, however the duration of price fluctuations isn't fixed at a certain period, the rate of convergence should be way faster during volatile fluctuations, of moderate speed during more cyclic fluctuations, and really slow with apparent long term trends, this could be achieved by making the indicator adaptive, but it won't really make it necessarily perform better.
That said i still believe that converging trend indicators are really interesting and aim to capture the non lasting behavior of price fluctuations, they shouldn't receive so much hate (think about the poor p-sar).
Thanks for reading !

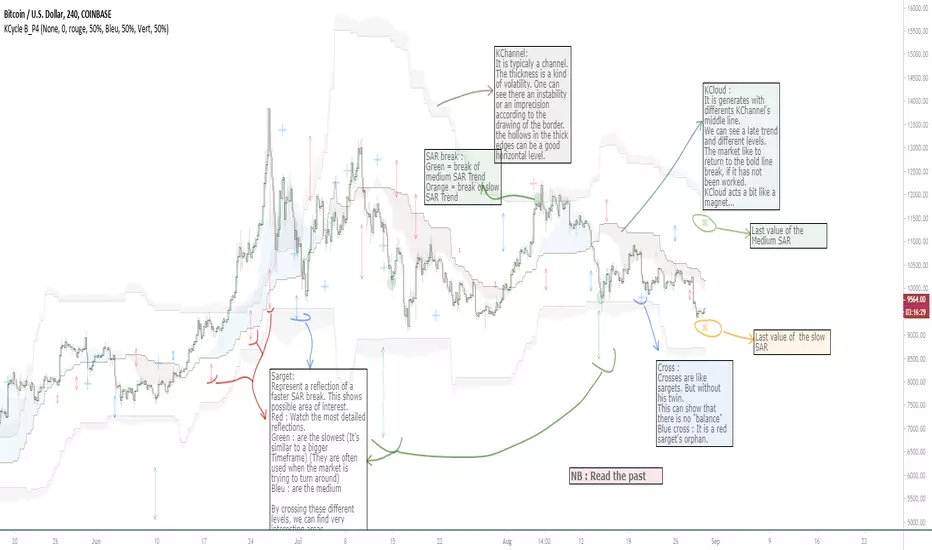
OVL_Kikoocycle Beta_Pine3This script use :
- A custom Chande Kroll Stop for generate the channel
- Some custom Parabolic S.A.R for generate cycles
This script can be separated into 3 categories:
- Channel Kroll generator : one layer for the actual interval and a layer for a Large Timeframe .(with ratio)
- "Range" generator : one layer for actual Interval and a layer for a Large Timeframe.(with automique ratio)
-Targets generator : one layer for actual interval with different trend.
"Channel Kroll" :
- I "hijack" the Chande Kroll Stop formula with custom parameters for generate this channel. Overall, it works like other types of channels like BB, etc... A midline and two borders. The thickness of the borders are relatively important here. A thick border shows some resistance of the area. And so the probability of seeing the market return to its first contact is stronger. While a very thin and vertical border would rather play the role of a breach, a bit like the idea of gaps. Often the market seems to want to go after several cycles.
You can activate its Large TimeFrame version, its midline is strong and fine borders helps to judge the risk.
SARget + "SAR Limited" :
- (S.A.R + targets) The philosophy of this function is simple... When a small cycle is broken, it creates a mark on a higher cycle. So on until the SAR called "SAR Limited". For simplicity, imagine a fractal image but inverted ... Break the small figure, it will mark the larger figure at this time but to get there you still have to make the way to the small figure.
Targets are : cross ("+") for fast targets(hidden by default because, theire work only on lower interval), squares (for medium trend), Xcross(for large trend) and red cross(they try to find a large contexte). When a target proc, it is for later (market need some cycles for going to, but it is relative to your interval). This gives you speculative goals.
Why 2 targets for a same type and a triangle with a 90deg angle : This give a potential area for management.The triangle help to visualize the SAR and to juge the market reaction. You need to adapte your trade with that...
Targets may be slightly too far because I am a bad coder... Currently the targets appear at the moment of rupture but it would be necessary to wait for the end of the breaking movement. Which can bring a positional error if the break is violent.
RnG and LTF RnG :
- Attempt to generate a Fibo range for each cycle and see interressing areas to enter or exit. This is played with the same philosophy as the Fibo extensions and retracement.
When a new RnG is generated, do not rush. It appears showing 50/50 for both sides. When a new RnG is generated, do not rush. It appears showing 50/50 for both sides. As long as the market is out of the middle zone (the 3 lines) keep in mind the past RnG.
When the market is out of range, you can use the FibRetracement tool for have extensions. One point at each end, as on the presentation graph. (Values 1.14, 1.272, 1.414, 1.618, 1.786, 2, 2.4 and 4 work well.) If too extrem you can active the LTF version.
Never fomo a break, market like to pull a level... Observe and be patient.
It's easier to use than to explain xD
NB : Do not use the LTF as context. For this, it is better to look at a higher interval.
I invite you to look in the style tab of the script and deselect the plots named UNCHECKEME, this will ease your browser.

Anchor ZonesL.A. Little, who wrote two books on trend trading, explained a key timing concept called anchor zones which was used, within his trading system, to enter and exit the market at appropriate times.
Anchor zones are formed from anchor bars. An anchor bar is a bar that has one or more of these components: wide range, high volume or gaps. For this script we're going to require two or more of the components. When an anchor bar forms, we'll note the high and low of the bar and draw a zone across time as prices develops. For this script, we'll also note the open and close of the candle to hint at other levels of support or resistance. The boundaries of these zones can act as support or resistance, but they also mark out the areas where price can often get trapped.
A breakout from these zones on high volume can suggest the beginning of a new trend. In general, anchor zones are a good compliment to price action strategies. For more information on how to use these, refer to L.A. Little's books.
References
onlinelibrary.wiley.com
www.tradingsetupsreview.com
Want to Learn?
If you'd like the opportunity to learn Pine but you have difficulty finding resources to guide you, take a look at this rudimentary list: docs.google.com
The list will be updated in the future as more people share the resources that have helped, or continue to help, them. Follow me on Twitter to keep up-to-date with the growing list of resources.
Suggestions or Questions?
Don't even kinda hesitate to forward them to me. My (metaphorical) door is always open.


Smart Money Zones - CleanA comprehensive smart money concepts indicator that identifies institutional trading zones and provides multi-timeframe trend analysis.
KEY FEATURES:
- Fair Value Gaps (FVG) - Detects bullish and bearish imbalance zones
- Order Blocks (OB) - Identifies institutional support/resistance areas
- Multi-Timeframe Panel - Shows trend direction across 7 timeframes (1m, 5m, 15m, 30m, 1H, 4H, 1D)
- Zone Strength Classification - Rates zones as Very Strong, Strong, Medium, or Weak
- Automatic Mitigation Tracking - Monitors when zones get filled
CUSTOMIZABLE SETTINGS:
- Toggle FVG and Order Block display
- Adjustable zone limits and detection sensitivity
- Optional trend filter using moving average
- Customizable panel position and size
- Choose to remove or fade mitigated zones
IDEAL FOR:
- Scalpers and day traders
- Smart money concept traders
- Multi-timeframe analysis
- Identifying high-probability entry zones
The indicator helps traders align with institutional order flow by marking key price levels where smart money has left imbalances or made significant moves.
Color-coded zones make it easy to spot bullish (green/blue) and bearish (red/orange) areas at a glance. The multi-timeframe panel ensures you're trading in alignment with higher timeframe trends.

IFVG BIASIFVG Bias Dashboard (15M / 30M / 1H / 4H)A clean, multi-timeframe ICT-inspired directional bias dashboard based on Implied Fair Value Gaps (IFVG).This indicator tracks the current bullish or bearish bias derived from the most recent valid Implied Fair Value Gap on four key higher timeframes: 15-minute, 30-minute, 1-hour, and 4-hour. It displays the results in an easy-to-read table directly on your chart — perfect for quickly assessing alignment across timeframes without switching charts.How It Works (ICT-Style IFVG Logic)Detects classic three-candle IFVGs:Bullish IFVG: Current low > high two bars ago (aggressive buying leaving an inefficiency).
Bearish IFVG: Current high < low two bars ago (aggressive selling).
When an IFVG forms, it sets the bias to match its direction (Bullish = +1, Bearish = -1).
The bias remains persistent until either:A new IFVG forms in the opposite direction, or
Price closes beyond the opposite boundary of the current IFVG (mitigation/invalidation), which flips the bias.
This creates a simple yet effective "last valid IFVG" bias that only changes on meaningful price action.
FeaturesMulti-timeframe analysis via request.security() on 15M, 30M, 1H, and 4H.
Compact table in the top-right corner showing:Timeframe (TF)
Current Bias: "Bullish" (solid green background) or "Bearish" (solid red background)
No repainting on historical bars; table updates only on the last confirmed bar.
Lightweight and overlay-friendly — does not draw boxes or lines, focusing purely on bias direction.
Ideal ForICT / Smart Money Concepts (SMC) traders looking for higher-timeframe confluence.
Confirming trend direction before taking lower-timeframe entries.
Spotting potential bias shifts when an IFVG is mitigated on higher timeframes.
A straightforward tool for staying aligned with institutional order flow inefficiencies across multiple timeframes. Add it to your chart and instantly see where the bias stands!

SMC Post-Analysis Lab [PhenLabs]📊 SMC Post-Analysis Lab
Version: PineScript™ v6
📌 Description
The SMC Post-Analysis Lab is a dedicated hindsight analysis tool built for traders who want to understand what really happened during any historical trading period. Unlike forward-looking indicators, this tool lets you scroll back through time and instantly receive algorithmic classification of market states using Smart Money Concepts methodology.
Whether you’re reviewing a losing trade, studying a successful session, or building your pattern recognition skills, this indicator provides immediate context. The expansion-aware algorithm processes price action within your selected window and outputs clear, actionable classifications ranging from Parabolic Expansion to Consolidation Inducements.
Stop relying on subjective post-trade analysis. Let the algorithm objectively tell you whether institutional players were accumulating, distributing, or running inducements during your trades.
🚀 Points of Innovation
First indicator specifically designed for SMC-based post-trade review rather than live signal generation
Dual-mode analysis system allowing both dynamic scrollback and precise date selection
Expansion-aware classification algorithm that weighs range position against net displacement
Real-time efficiency metrics calculating directional quality of price movement
Integrated visual FVG detection within the analysis window only
Interactive table with clickable date range adjustment via chart interface
🔧 Core Components
Pivot Detection Engine: Uses configurable pivot length to identify significant swing highs and lows for structure break detection
Window Calculator: Determines active analysis zone based on either bar offset or timestamp boundaries
Data Aggregator: Tracks window open, high, low, close and counts bullish/bearish structure break events
State Classification Algorithm: Applies hierarchical logic to determine market state from six possible classifications
Visual Renderer: Draws structure breaks, FVG boxes, and window highlighting within the active zone
🔥 Key Features
Sliding Window Mode: Use the Scroll Back slider to dynamically move your analysis zone backwards through history bar-by-bar
Date Range Mode: Select specific start and end timestamps for precise session or trade review
Six Market State Classifications: Parabolic Expansion (Bull/Bear), Bullish/Bearish Order Flow, Accumulation/Distribution Reversal, and Consolidation/Inducement
Range Position Percentile: See exactly where price closed relative to the window’s high-low range as a percentage
Bull/Bear Event Counter: Quantified count of structure breaks in each direction during the analysis period
Efficiency Calculation: Net move divided by total range reveals trending quality versus chop
🎨 Visualization
Blue Window Highlight: Active analysis zone is clearly marked with blue background shading on the chart
Structure Break Lines: Dashed lines appear at each bullish or bearish structure break within the window
FVG Boxes: Fair Value Gaps automatically render as semi-transparent boxes in bullish or bearish colors
Dashboard Table: Top-right positioned table displays State, Analysis description, and Metrics in real-time
Color-Coded States: Each classification uses distinct coloring for immediate visual recognition
Interactive Tip Row: Optional help text guides users on clicking the table to adjust date range
📖 Usage Guidelines
General Configuration
Analysis Mode: Default is Sliding Window. Choose Date Range for specific timestamp analysis.
Sliding Window Settings
Scroll Back (Bars): Default 0. Increase to move window backwards into history.
Window Width (Bars): Default 100. Range 20-50 for scalping, 100+ for swing analysis.
Date Range Settings
Start Date: Select the beginning timestamp for your analysis period.
End Date: Select the ending timestamp for your analysis period.
Visual Settings
Show Help Tip: Default true. Toggle to hide instructional row in dashboard.
Bullish Color: Default teal. Customize for bullish elements.
Bearish Color: Default red. Customize for bearish elements.
SMC Parameters
Pivot Length: Default 5. Lower values (3-5) catch minor breaks. Higher values (10+) focus on major swings.
✅ Best Use Cases
Post-trade review to understand why entries succeeded or failed
Session analysis to identify institutional activity patterns
Trade journaling with objective algorithmic classifications
Pattern recognition training through historical scrollback
Identifying whether stop hunts were inducements or legitimate breaks
Comparing your real-time read versus what the algorithm detected
⚠️ Limitations
Designed for historical analysis only, not live trade signals
Classification accuracy depends on appropriate pivot length for the timeframe
FVG detection uses simple gap logic without mitigation tracking
State classification is based on window data only, not broader context
Requires manual scrolling or date input to review different periods
💡 What Makes This Unique
Purpose-Built for Review: Unlike most indicators focused on live signals, this is designed specifically for post-trade analysis
Expansion-Aware Logic: Algorithm weighs both position in range AND directional efficiency for accurate state detection
Interactive Date Control: Click the dashboard table to reveal draggable anchors for window adjustment directly on chart
🔬 How It Works
1. Window Definition:
User selects either Sliding Window or Date Range mode
System calculates which bars fall within the active analysis zone
Active zone receives blue background highlighting
2. Data Collection:
Algorithm captures window open, running high, running low, and current close
Structure breaks are detected when price crosses above last pivot high or below last pivot low
Bullish and bearish events are counted separately
3. State Classification:
Range Position calculates where close sits as percentage of high-low range
Efficiency calculates net move divided by total range
Hierarchical logic applies priority rules from Parabolic states down to Consolidation
4. Output Rendering:
Dashboard table updates with State title, Analysis description, and Metrics
Visual elements render within window only to keep chart clean
Colors reflect bullish, bearish, or neutral classification
💡 Note:
This indicator is intended for educational and review purposes. Use it to develop your understanding of Smart Money Concepts by analyzing what institutional order flow looked like during historical periods. Combine insights with your own analysis methodology for best results.

Strat Structure Engine + Trapped TradersStrat Structure Engine + Trapped Traders – Detailed Description
This script identifies high-probability market structure patterns known as “The Strat” setups, specifically focusing on 3-bar → Failed 2, 2-bar → Failed 2, and Failed 2 → Failed 2 (“Dragon’s Tail”) sequences. It is designed to help traders visualize potential reversals, trapped traders, and exhaustion points directly on the chart, combining price action, volatility, and volume metrics to grade signal strength.
Key Features:
3-Bar → Failed 2 (Tiered Scoring):
Detects a 3-bar structure followed immediately by a strict Failed 2 bar.
Evaluates the setup using four criteria:
3-bar range relative to ATR
Failed 2 close position relative to the 3-bar midpoint
Failed 2 body-to-range ratio
Volume relative to recent average
Assigns a tier (A+, A, B, or —) to indicate reliability, giving traders a graded view of signal strength.
2-Bar → Failed 2 (A+ Only):
Identifies strict 2-bar structures immediately followed by a Failed 2 bar.
Uses a similar evaluation system as 3→F2 but filters only for the strongest A+ setups.
Highlights signals where price shows strong directional rejection and high probability for reversal.
Dragon’s Tail – Failed 2 → Failed 2:
Captures consecutive Failed 2 bars in opposite directions, a classic trapped-trader scenario.
Signals both bullish and bearish sequences on bar close, helping traders spot potential quick reversals.
How It Works:
Uses ATR to contextualize bar ranges and volatility.
Incorporates volume averaging to detect unusually high trading activity that validates the strength of a Failed 2 setup.
Strict bar evaluation ensures only fully-formed, confirmed patterns are labeled, reducing noise and false signals.
Optional labels and alerts allow traders to track these structures in real-time or on bar close.
Practical Trading Use:
Ideal for spotting short-term exhaustion points, trapped traders, and reversal zones.
Can be used alongside liquidity zones, VWAP, and fair value gaps to refine entries and exits.
Traders can focus on high-tier signals (A+ / A) for higher probability trades, while lower-tier signals (B) indicate caution or context setups.
Customization Options:
Toggle visibility for each pattern type (3→F2, 2→F2, F2→F2).
Adjust ATR length and volume average period for different instruments or timeframes.
Alerts are available for all major setups, enabling integration with automated monitoring or manual execution strategies.
Summary:
The Strat Structure Engine + Trapped Traders script combines price action structure, volatility, and volume analysis to visualize high-probability reversal setups. By highlighting both strict pattern confirmations and tiered reliability, it provides traders with actionable insight into potential turning points, trapped trader scenarios, and high-conviction market moves without relying on external scripts or assumptions.

Account GuardianAccount Guardian: Dynamic Risk/Reward Overlay
Introduction
Account Guardian is an open-source indicator for TradingView designed to help traders evaluate trade setups before entering positions. It automatically calculates Risk-to-Reward ratios based on market structure, displays visual Stop Loss and Take Profit zones, and provides real-time position sizing recommendations.
The indicator addresses a fundamental question every trader should ask before entering a trade: "Does this setup make mathematical sense?" Account Guardian answers this question visually and numerically, helping traders avoid impulsive entries with poor risk profiles.
Core Functionality
Account Guardian performs four primary functions:
Detects swing highs and swing lows to identify logical stop loss placement levels
Calculates Risk-to-Reward ratios for both long and short setups in real-time
Displays visual SL/TP zones on the chart for immediate trade planning
Computes position sizing based on your account size and risk tolerance
The goal is to provide traders with instant feedback on whether a potential trade meets their minimum risk/reward criteria before committing capital.
How It Works
Swing Detection
The indicator uses pivot point detection to identify recent swing highs and swing lows on the chart. These swing points serve as logical areas for stop loss placement:
For Long Trades: The most recent swing low becomes the stop loss level. Price breaking below this level would invalidate the bullish thesis.
For Short Trades: The most recent swing high becomes the stop loss level. Price breaking above this level would invalidate the bearish thesis.
The swing detection lookback period is configurable, allowing you to adjust sensitivity based on your trading timeframe and style.
It automatically adjusts the tp and sl when it is applied to your chart so it is always moving up and down!
Risk/Reward Calculation
Once swing levels are identified, the indicator calculates:
Entry Price: Current close price (where you would enter)
Stop Loss: Recent swing low (for longs) or swing high (for shorts)
Risk: Distance from entry to stop loss
Take Profit: Entry plus (Risk × Target Multiplier)
R:R Ratio: Reward divided by Risk
The R:R ratio is then evaluated against your configured thresholds to determine if the setup is valid, marginal, or poor.
Visual Elements
SL/TP Zones
When enabled, the indicator draws colored boxes on the chart showing:
Red Zone: Stop Loss area - the region between your entry and stop loss
Green/Gold/Red Zone: Take Profit area - colored based on R:R quality
The color coding provides instant visual feedback:
Green: R:R meets or exceeds your "Good R:R" threshold (default 3:1)
Gold: R:R meets minimum threshold but below "Good" (between 2:1 and 3:1)
Red: R:R below minimum threshold - setup should be avoided
Swing Point Markers
Small circles mark detected swing points on the chart:
Green circles: Swing lows (potential support / long SL levels)
Red circles: Swing highs (potential resistance / short SL levels)
Dashboard Panel
The dashboard in the top-right corner displays comprehensive trade planning information:
R:R Row: Current Risk-to-Reward ratio for long and short setups
Status Row: VALID, OK, BAD, or N/A based on R:R thresholds
Stop Loss Row: Exact price level for stop loss placement
Take Profit Row: Exact price level for take profit placement
Pos Size Row: Recommended position size based on your risk parameters
Risk $ Row: Dollar amount at risk per trade
Position Sizing Logic
The indicator calculates position size using the formula:
Position Size = Risk Amount / Risk per Unit
Where:
Risk Amount = Account Size × (Risk Percentage / 100)
Risk per Unit = Entry Price - Stop Loss Price
For example, with a $10,000 account risking 1% per trade ($100), if your entry is at 100 and stop loss at 98 (risk of 2 per unit), your position size would be 50 units.
Input Parameters
Swing Detection:
Swing Lookback: Number of bars to look back for pivot detection (default: 10). Higher values find more significant swing points but may be slower to update.
Target Multiplier: Multiplier applied to risk to calculate take profit distance (default: 2). A value of 2 means TP is 2× the distance of SL from entry.
Risk/Reward Thresholds:
Minimum R:R: Minimum acceptable Risk-to-Reward ratio (default: 2.0). Setups below this show as "BAD" in red.
Good R:R: Threshold for excellent setups (default: 3.0). Setups at or above this show as "VALID" in green.
Account Settings:
Account Size ($): Your trading account size in dollars (default: 10,000). Used for position sizing calculations.
Risk Per Trade (%): Percentage of account to risk per trade (default: 1.0%). Professional traders typically risk 0.5-2% per trade.
Display:
Show SL/TP Zones: Toggle visibility of the colored zone boxes on chart (default: enabled)
Show Dashboard: Toggle visibility of the information panel (default: enabled)
Analyze Direction: Choose to analyze Long only, Short only, or Both directions (default: Both)
How to Use This Indicator
Basic Workflow:
Add the indicator to your chart
Configure your account size and risk percentage in the settings
Set your minimum and good R:R thresholds based on your trading rules
Look at the dashboard to see current R:R for potential long and short entries
Only consider trades where the status shows "VALID" or at minimum "OK"
Use the displayed SL and TP levels for your order placement
Use the position size recommendation to determine lot/contract size
Interpreting the Dashboard:
VALID (Green): Excellent setup - R:R meets your "Good" threshold. This is the ideal scenario for taking a trade.
OK (Gold): Acceptable setup - R:R meets minimum but isn't optimal. Consider taking if other confluence factors align.
BAD (Red): Poor setup - R:R below minimum threshold. Avoid this trade or wait for better entry.
N/A (Gray): Cannot calculate - usually means no valid swing point detected yet.
Best Practices:
Use this indicator as a filter, not a signal generator. It tells you IF a trade makes sense, not WHEN to enter.
Combine with your existing entry strategy - use Account Guardian to validate setups from other analysis.
Adjust the swing lookback based on your timeframe. Lower timeframes may need smaller lookback values.
Be honest with your account size input - accurate position sizing requires accurate inputs.
Consider the target multiplier carefully. Higher multipliers mean larger potential reward but lower probability of hitting TP.
Alerts
The indicator includes four alert conditions:
Good Long Setup: Triggers when long R:R reaches or exceeds your "Good R:R" threshold
Good Short Setup: Triggers when short R:R reaches or exceeds your "Good R:R" threshold
Bad Long Setup: Triggers when long R:R falls below your minimum threshold
Bad Short Setup: Triggers when short R:R falls below your minimum threshold
These alerts can help you monitor multiple charts and get notified when favorable setups appear.
Technical Implementation
The indicator is built using Pine Script v6 and includes:
Pivot-based swing detection using ta.pivothigh() and ta.pivotlow()
Dynamic box drawing for visual SL/TP zones
Table-based dashboard for clean information display
Color-coded visual feedback system
Persistent variable tracking for swing levels
Code Structure:
// Swing Detection
float swingHi = ta.pivothigh(high, swingLen, swingLen)
float swingLo = ta.pivotlow(low, swingLen, swingLen)
// R:R Calculation for Long
float longSL = recentSwingLo
float longRisk = entry - longSL
float longTP = entry + (longRisk * targetMult)
float longRR = (longTP - entry) / longRisk
// Position Sizing
float riskAmount = accountSize * (riskPct / 100)
float posSize = riskAmount / longRisk
Limitations
The indicator uses historical swing points which may not always represent optimal SL placement for your specific strategy
Position sizing assumes you can trade fractional units - adjust accordingly for instruments with minimum lot sizes
R:R calculations assume linear price movement and don't account for gaps or slippage
The indicator doesn't predict price direction - it only evaluates the mathematical viability of a setup
Swing detection has inherent lag due to the lookback period required for pivot confirmation
Recommended Settings by Trading Style
Scalping (1-5 minute charts):
Swing Lookback: 5-8
Target Multiplier: 1-2
Minimum R:R: 1.5
Good R:R: 2.0
Day Trading (15-60 minute charts):
Swing Lookback: 8-12
Target Multiplier: 2
Minimum R:R: 2.0
Good R:R: 3.0
Swing Trading (4H-Daily charts):
Swing Lookback: 10-20
Target Multiplier: 2-3
Minimum R:R: 2.5
Good R:R: 4.0
Why Risk/Reward Matters
Many traders focus solely on win rate, but profitability depends on the combination of win rate AND risk/reward ratio. Consider these scenarios:
50% win rate with 1:1 R:R = Breakeven (before costs)
50% win rate with 2:1 R:R = Profitable
40% win rate with 3:1 R:R = Profitable
60% win rate with 1:2 R:R = Losing money
Account Guardian helps ensure you only take trades where the math works in your favor, even if you're wrong more often than you're right.
Disclaimer
This indicator is provided for educational and informational purposes only. It is not intended as financial, investment, trading, or any other type of advice or recommendation.
Trading involves substantial risk of loss and is not suitable for all investors. The calculations provided by this indicator are based on historical price data and mathematical formulas that may not accurately predict future price movements.
Position sizing recommendations are estimates based on user inputs and should be verified before placing actual trades. Always consider factors such as leverage, margin requirements, and broker-specific rules when determining actual position sizes.
The Risk-to-Reward ratios displayed are theoretical calculations based on swing point detection. Actual trade outcomes will vary based on market conditions, execution quality, and other factors not captured by this indicator.
Past performance does not guarantee future results. Users should thoroughly test any trading approach in a demo environment before risking real capital. The authors and publishers of this indicator are not responsible for any losses or damages arising from its use.
Always consult with a qualified financial advisor before making investment decisions.

Anurag Institutional Swing Trader Pro [Robust]nstitutional Swing Flow is a comprehensive, multi-timeframe system designed for swing traders who want to align with "Smart Money" rather than fight against it.
Unlike standard indicators that rely solely on price crossovers, this script analyzes the underlying order flow—tracking stealth accumulation, volume anomalies, and institutional footprints—to generate high-probability swing setups.
Key Features (The "Smart Money" Logic)
1. Institutional Footprints
Stealth Accumulation/Distribution: Detects when price is held in a tight range despite high volume (a classic sign of institutions building a position).
Smart Money Divergence: Identifies when price makes a lower low but Money Flow (OBV/Accumulation-Distribution) makes a higher high.
Fair Value Gaps (FVG): Automatically plots Bullish and Bearish imbalance zones where price is likely to retrace before continuing the trend.
2. Safety First (Risk Management)
Real Earnings Detection: Automatically checks upcoming earnings dates. If an earnings report is within 5 days (adjustable), the script blocks new signals to prevent gambling on binary events.
Visual Exits: Plots dynamic Stop Loss and Take Profit levels on the chart the moment a trade is taken, along with "SL Hit" or "TP Hit" markers for visual backtesting.
3. The "Confluence Score" Dashboard A sophisticated dashboard in the top-right corner rates every setup on a scale of 0 to 100 based on:
Multi-Timeframe Trend: Is the Weekly, Daily, and 4H trend aligned?
Relative Strength: Is the asset outperforming the SPY benchmark?
Volatility: Is the asset in a "Squeeze" (Bollinger Band compression)?
Momentum: RSI, MACD, and CMF confirmation.
Only setups with a score > 65 (adjustable) trigger a BUY or SELL signal.
How to Use
Timeframe: Optimized for 4-Hour (4H) and Daily (D) charts. (Avoid using on <15m charts due to multi-timeframe calculations).
The Signal: Wait for a large "CALL" or "PUT" label.
The Confirmation: Check the Dashboard. Ideally, look for a "Squeeze: YES" combined with a high Institutional Buy Score.
The Exit: Follow the Red (Stop Loss) and Green (Take Profit) lines plotted automatically.
Disclaimer
This tool is for educational purposes only. Swing trading involves risk. Always confirm signals with your own analysis and risk management rules.

Session Opening Bar RangeSession Opening Bar Range (OBR) - Advanced Opening Range Indicator with Statistical Analysis
Overview
The Session First Bar Range (FBR) indicator is a comprehensive tool that captures and projects key levels based on the first bar of a user-defined trading session. Unlike traditional daily opening range indicators, this script allows traders to focus on specific session windows (New York RTH, London, Asia, etc.) and analyze price behavior relative to the initial momentum established in that session's opening bar.
What makes this indicator unique is its combination of three distinct projection methodologies: statistical analysis based on historical range data, Fibonacci extensions, and fixed-point rotation levels commonly used by institutional traders. To our knowledge, this is the only opening range indicator that incorporates statistical standard deviation levels calculated from historical first bar ranges, making it both a technical and probabilistic tool.
Core Concept
The opening range concept is based on the principle that the initial price action of a trading session often sets the tone for the remainder of that session.
Professional traders have long observed that:
The first bar's high and low act as key reference points
Price often respects or breaks these levels with significance
Expansion beyond the opening range tends to occur in measurable increments
This indicator takes these observations and enhances them with:
Historical probability analysis - "Based on the last 60 sessions, price typically extends X standard deviations beyond the opening range"
Proportional projections - Fibonacci-based extensions showing where measured moves typically target
Fixed-point rotations - Institutional rotation levels (e.g., 65 points for NQ, 15 points for ES)
How It Works
Session Detection & First Bar Capture
The indicator uses Pine Script's time() function with timezone support to precisely detect when a trading session begins. When the first bar of the selected timeframe occurs within the session window, the script captures:
High (H): The high of the first bar
Low (L): The low of the first bar
Mid (M): The midpoint (hl2) of the first bar
Critical Detail: These levels are fixed from the first bar only - they do not update as the session progresses. This differs from many "opening range" indicators that use a time period (e.g., first 30 minutes). Here, you select the bar timeframe (default 5-minute), and only that single first bar's range is captured.
Statistical Level Calculation
The indicator maintains a rolling array of the last N session's first bar ranges (default: 60 sessions). For each new session, it calculates:
Average Range: Mean of historical first bar ranges
Standard Deviation: Volatility of those ranges
Projection Levels: High/Low ± (Average Range + Std Dev × Multiplier)
This provides probability-based levels. For example, a +2σ level suggests: "Historically, price extending this far beyond the opening range is a 2-standard-deviation event (approximately 95th percentile)."
Fibonacci Extensions
Using the first bar range as the base unit (100%), the indicator projects Fibonacci levels:
100% extension: One full range above the high / below the low
1.618x extension: (Default) Golden ratio projection
2.618x, 3.618x extensions: Additional Fibonacci levels
Calculation: Range = H - L, then Target = H + (Range × Multiplier) for upside projections.
OR Rotation Levels
These are fixed-point increments from the first bar's high and low. Unlike percentage-based methods, rotations use absolute point values:
NQ traders often use 65-point increments
ES traders often use 15-point increments
Gold/bonds use different values
The indicator draws 5 levels above the high (R+1 through R+5) and 5 below the low (R-1 through R-5), each separated by your specified point increment.
Features:
Session Options
Pre-configured Sessions:
New York RTH (9:30am - 4:00pm)
New York Futures (8:00am - 5:00pm)
London (2:00am - 8:00am)
Asia (7:00pm - 2:00am)
Midnight to 5pm
ZB/Gold/Silver OR (8:20am - 4:00pm)
CL OR (9:00am - 4:00pm)
Custom Session: Define your own start/end times in HHMM format
Timezone Support: All sessions respect the selected timezone (default: America/New_York)
Customizable Timeframe
Select any timeframe for the first bar (1min, 5min, 15min, etc.)
Default: 5-minute bars
Important: This is the timeframe for the first bar capture, independent of your chart's timeframe
Display Options
Historical Ranges: Show/hide past session ranges (with configurable limit to manage performance)
Line Styles: Choose between Solid, Dashed, or Dotted for range lines and midline
Label Position: Left or Right side of range
Show Prices: Optionally display actual price values on labels
Custom Colors: Fully customizable colors for all components
Statistical Levels
Lookback Period: Number of historical sessions to analyze (default: 60)
Two Multiplier Levels: Default 1σ and 2σ, fully adjustable
Separate styling: Different line styles (dashed vs dotted) for each sigma level
Optional Labels: Show/hide sigma notation labels
Fibonacci Extensions
Four Extension Levels: 100%, 1.618x, 2.618x, 3.618x (all customizable)
Bidirectional: Projections both above and below the opening range
Optional Labels: Toggle percentage/multiplier labels
OR Rotation Levels
Configurable Increment: Set the point value for your instrument
Five Levels Each Direction: R±1 through R±5
Dynamic Labels: Show both rotation number and point value (e.g., "R+1 (65)")
Three Line Styles: Solid, Dashed, or Dotted
How to Use
Setup
Add the indicator to your chart
Select your trading session from the dropdown
Set the timeframe for first bar capture (typically 5-15 minutes)
Configure which projection methods you want to see (Statistical, Fibonacci, and/or Rotations)
For Day Traders
Scenario: Trading NQ during New York RTH
Session: Select "New York RTH (9:30am - 4:00pm)"
Timeframe: 5-minute (captures 9:30-9:35 bar)
Enable: OR Rotations with 65-point increments
Strategy:
Watch for acceptance/rejection at rotation levels
Use R+1/R-1 as initial profit targets
R+2/R-2 as extended targets
Statistical levels show when price is in "outlier" territory
and rotation levels
Performance Notes
The indicator limits objects to stay within TradingView's constraints (500 max)
If you enable all features, reduce "Maximum Historical Ranges" to prevent slowdown
Typical configuration: 10-20 historical ranges with all features enabled works well
Settings Guide
Session Settings
Session: Choose from pre-configured sessions or "Custom"
Custom Session Start/End: HHMM format (e.g., "0930" for 9:30am)
Timezone: Critical for accurate session detection
Opening Bar Format
Timeframe: The bar size for capturing the first bar's range
Show Midline: Toggle the mid-point line
Show Historical Ranges: Display previous sessions (recommended: leave ON)
Maximum Historical Ranges: Limit history to manage performance (1-500)
Range Style / MidLine Style: Solid, Dashed, or Dotted
Position: Label placement (Left or Right)
Show Prices: Include actual price values on labels
Statistical Levels
Lookback Periods: How many historical first bar ranges to analyze (default: 60)
Std Dev Multiplier 1/2: The sigma levels to project (default: 1.0 and 2.0)
All visual settings (colors, line width, label size)
Fibonacci Extensions
Show Fib Extensions: Enable/disable Fibonacci projections
Measured Move Extensions 1-4: The multipliers (default: 1.618, 2.618, 3.618, 4.618)
Visual customization options
OR Rotations
Rotation Increment: The point value for your instrument
NQ: 65 points
ES: 15 points
Adjust for other instruments based on their typical rotation behavior
Show Rotation Labels: Display level numbers and point values
Visual customization options
Use Cases
Gap Trading: When price gaps away from previous day's close, the first bar range shows the initial gap acceptance/rejection zone
Breakout Confirmation: Price breaking and holding above the first bar high with volume suggests trend day potential. Rotation levels provide measured targets.
Reversal Identification: Price reaching +2σ statistical level = rare event, potential exhaustion
Range Bound Days: Price oscillating between first bar high/low suggests range-bound session; trade reversals at extremes
Institutional Level Awareness: OR Rotations at 65 points (NQ) align with levels professional traders watch
Technical Notes
The indicator uses request.security() with lookahead=barmerge.lookahead_on to ensure the first bar levels are captured correctly
All drawing objects (lines, labels, fills) are managed in arrays with automatic cleanup to prevent memory issues
The statistical calculations use array.avg() and array.stdev() for accurate probability estimates
Rotation levels use individual line variables (like Fibonacci) rather than loops for reliability
Summary
This indicator is original in its combination of three distinct methodologies for projecting levels from a session's opening range:
Statistical Analysis - No other opening range indicator (to our knowledge) calculates standard deviation projections from historical first bar ranges
Time-Based Session Flexibility - Most OR indicators use only daily or fixed time periods; this allows any custom session window
Multiple Projection Methods - Traders can use statistical, Fibonacci, AND rotation levels together or separately

Multi-Fractal Trading Plan [Gemini] v22Multi-Fractal Trading Plan
The Multi-Fractal Trading Plan is a quantitative market structure engine designed to filter noise and generate actionable daily strategies. Unlike standard auto-trendline indicators that clutter charts with irrelevant data, this system utilizes Fractal Geometry to categorize market liquidity into three institutional layers: Minor (Intraday), Medium (Swing), and Major (Institutional).
This tool functions as a Strategic Advisor, not just a drawing tool. It calculates the delta between price and structural pivots in real-time, alerting you when price enters high-probability "Hot Zones" and generating a live trading plan on your dashboard.
Core Features
1. Three-Tier Fractal Engine The algorithm tracks 15 distinct fractal lengths simultaneously, aggregating them into a clean hierarchy:
Minor Structure (Thin Lines): Captures high-frequency volatility for scalping.
Medium Structure (Medium Lines): Identifies significant swing points and intermediate targets.
Major Structure (Thick Lines): Maps the "Institutional" defense lines where trend reversals and major breakouts occur.
2. The Strategic Dashboard A dynamic data panel in the bottom-right eliminates analysis paralysis:
Floor & Ceiling Targets: Displays the precise price levels of the nearest Support and Resistance.
AI Logic Output: The script analyzes market conditions to generate a specific command, such as "WATCH FOR BREAKOUT", "Near Lows (Look Long?)", or "WAIT (No Setup)".
3. "Hot Zone" Detection Never miss a critical test of structure.
Dynamic Alerting: When price trades within 1% (adjustable) of a Major Trend Line, the indicator’s labels turn Bright Yellow and flash a warning (e.g., "⚠️ WATCH: MAJOR RES").
Focus: This visual cue highlights the exact moment execution is required, reducing screen fatigue.
4. The Quant Web & Markers
Pivot Validation: Deep blue fractal markers (▲/▼) identify the exact candles responsible for the structure.
Inter-Timeframe Web: Faint dotted lines connect Minor pivots directly to Major pivots, visualizing the "hidden" elasticity between short-term noise and long-term trend anchors.
5. Enterprise Stability Engine Engineered to solve the "Vertical Line" and "1970 Epoch" glitches common in Pine Script trend indicators. This engine is optimized for Futures (NQ/ES), Forex, and Crypto, ensuring stability across all timeframes (including gaps on ETH/RTH charts).
Operational Guide
Consult the Dashboard: Before executing, check the "Strategy" output. If it says "WAIT", the market is in chop. If it says "WATCH FOR BOUNCE", prepare your entry criteria.
Monitor Hot Zones: A Yellow Label indicates price is testing a major liquidity level. This is your signal to watch for a rejection wick or a high-volume breakout.
Utilize the Web: Use the faint web lines to find "confluence" where a short-term pullback aligns with a long-term trend line.
Configuration
Show History: Toggles "Ghost Lines" (Blue) to display historical structure and broken trends.
Fractal Points: Toggles the geometric pivot markers.
Hot Zone %: Adjusts the sensitivity of the Yellow Warning system (Default: 1%).
Max Line Length: A noise filter that removes stale or "spiderweb" lines that are no longer statistically relevant.

ICT Liquidity Sweep/Swing Fail Pattern V.1# ICT Liquidity Sweep/Swing Fail Pattern V.1
## Indicator Description & User Guide
---
## 📊 Indicator Overview
**Name:** ICT Liquidity Sweep/Swing Fail Pattern V.1
**Type:** Support/Resistance & Liquidity Detection
**Trading Style:** ICT Concepts (Inner Circle Trader)
**Best Timeframes:** 1M, 5M, 15M, 1H
---
## 🎯 Core Features
### 1. **Support & Resistance Lines**
- Automatically draws key swing high and swing low levels
- Based on significant pivot points in price structure
- Updates dynamically as new swings form
### 2. **"X" Mark - Liquidity Sweep**
- **Symbol:** X marker on chart
- **Meaning:** Indicates a liquidity sweep (stop hunt)
- **What it shows:** Price briefly moved beyond a key level to trigger stops, then reversed
- **Trading significance:** High-probability reversal zones after liquidity is taken
### 3. **"SFP" Label - Swing Failure Pattern**
- **Symbol:** SFP text label
- **Meaning:** Swing Failure Pattern detected
- **What it shows:** Price attempted to make a new high/low but failed and reversed sharply
- **Trading significance:** Strong reversal signal - smart money rejecting the level
---
## 📈 How to Use This Indicator
### Entry Setup Strategy:
#### **For SHORT Trades (Sell):**
1. Wait for **SFP** to appear at a swing high
2. Look for **X marker** confirming liquidity sweep above the high
3. **Entry Zone (Red Box):** Enter SHORT positions when price returns to this zone
4. **Stop Loss:** Place above the red zone (above the swept high)
5. **Take Profit (Green Box):** Target the green zone below
#### **For LONG Trades (Buy):**
1. Wait for **SFP** to appear at a swing low
2. Look for **X marker** confirming liquidity sweep below the low
3. **Entry Zone (Green Box):** Enter LONG positions when price returns to this zone
4. **Stop Loss:** Place below the green zone (below the swept low)
5. **Take Profit (Red Box):** Target the red zone above
---
## 🎨 Color Coding System
| Color | Zone Type | Usage |
|-------|-----------|-------|
| 🔴 **Red Box** | Stop Loss / Supply Zone | Place SL here for LONG trades / Entry zone for SHORT trades |
| 🟢 **Green Box** | Take Profit / Demand Zone | Target zone for LONG trades / Place SL here for SHORT trades |
| ❌ **X Mark** | Liquidity Sweep Point | Stop hunt occurred - reversal likely |
| 📝 **SFP Label** | Swing Failure Pattern | Failed breakout - strong reversal signal |
---
## 💡 Trading Examples
### Example 1: SHORT Trade (As shown in your chart)
```
1. SFP appears at swing high (Red zone around 4,000)
2. X marker confirms liquidity sweep above the high
3. Entry: SHORT when price re-enters red zone
4. Stop Loss: Above red zone (e.g., 4,002)
5. Take Profit: Green zone below (3,964-3,972)
6. Risk:Reward = 1:3+
```
### Example 2: LONG Trade
```
1. SFP appears at swing low (Green zone)
2. X marker confirms liquidity sweep below the low
3. Entry: LONG when price re-enters green zone
4. Stop Loss: Below green zone
5. Take Profit: Previous red zone above
6. Risk:Reward = 1:2 minimum
```
---
## ⚠️ Important Trading Rules
### ✅ DO:
- Wait for BOTH SFP and X marker confirmation
- Enter on price returning to the zone (not on first touch)
- Use proper position sizing (1-2% risk per trade)
- Combine with market structure analysis
- Look for confluences (orderblocks, fair value gaps)
### ❌ DON'T:
- Trade against the higher timeframe trend
- Enter without confirmation signals
- Ignore the colored zones for SL/TP placement
- Overtrade - wait for quality setups
- Move stop loss to breakeven too early
---
## 🔧 Indicator Settings (Typical)
**Adjustable Parameters:**
- Swing Length: Number of bars to identify swing points
- Show/Hide X markers
- Show/Hide SFP labels
- Zone opacity and colors
- Line thickness
---
## 📚 ICT Concepts Explained
### **Liquidity Sweep:**
Smart money intentionally pushes price beyond key levels to trigger retail stop losses, then reverses to their intended direction. The X marker identifies these moments.
### **Swing Failure Pattern (SFP):**
Price attempts to make a new high/low but lacks follow-through, indicating weak momentum and likely reversal. Similar to a "false breakout" but more specific to swing structures.
### **Supply & Demand Zones:**
- **Red zones** = Areas where selling pressure overwhelmed buyers
- **Green zones** = Areas where buying pressure overwhelmed sellers
- These zones act as magnets for price to return and react
---
## 🎓 Best Practices
1. **Confluence is Key:**
- Combine with daily/weekly bias
- Check for orderblocks nearby
- Look for imbalances (FVG)
2. **Session Timing:**
- Best during London/New York sessions
- Avoid low liquidity periods
3. **Risk Management:**
- Never risk more than 1-2% per trade
- Use proper lot sizing
- Take partial profits at key levels
4. **Timeframe Correlation:**
- Check higher timeframe for bias
- Enter on lower timeframe for precision
- Exit based on higher timeframe targets
---
## 📞 Support & Updates
**Version:** 1.0
**Compatibility:** TradingView Pine Script v5
**Updates:** Regular improvements based on ICT methodology
---
## ⚡ Quick Reference Card
| Signal | Action | SL Placement | TP Target |
|--------|--------|--------------|-----------|
| SFP + X at High | SHORT at Red Zone | Above Red | Green Zone |
| SFP + X at Low | LONG at Green Zone | Below Green | Red Zone |
**Remember:** The indicator shows you WHERE to trade, but YOU decide WHEN based on confirmation and market context.
---
*Disclaimer: This indicator is a tool for technical analysis. Always use proper risk management and never trade with money you cannot afford to lose.*

SMC Strategy Tool v1.0 - Institutional SuiteDescription: The SMC Strategy Tool v1.0 is a comprehensive technical analysis suite designed for traders following the Smart Money Concepts (SMC) methodology. It combines market structure, institutional liquidity zones, and mathematical pivots to provide a high-probability trading environment.
Key Features:
Automatic Market Structure: Real-time detection of CHoCH (Change of Character) and BOS (Break of Structure) based on price action confirmation.
Institutional Order Flow (FVG): Identifies Fair Value Gaps with a dynamic mitigation system (boxes disappear once the price fills the inefficiency).
Premium & Discount Zones: Automatically calculates the current trading range and highlights the "cheap" (Discount) and "expensive" (Premium) areas for optimal entry.
Daily Pivot Points: Seamless integration of Daily Pivots (P, R1-R3, S1-S3) for institutional confluence.
Live Analytics Dashboard: A clean, non-intrusive table monitoring Market Phase, RSI (Momentum), and ATR (Volatility).
Smart Alerts: Built-in logic for "Discount Entry" during Bullish trends and "Premium Entry" during Bearish trends.
How to Trade:
Identify the Trend: Look at the Dashboard for the current Market Phase (Bullish/Bearish).
Wait for Value: Do not chase the price. Wait for the price to return to the Discount Zone (for Longs) or Premium Zone (for Shorts).
Find Confluence: The highest probability trades occur when a Discount/Premium entry aligns with an FVG and a Daily Pivot level.
Confirmation: Check the RSI cell. If it's red/green, the move might be exhausted; wait for a neutral reading or a structural reaction.
Available Alerts:
Trend Shift (CHoCH): Get notified immediately when the market structure shifts (e.g., from Bearish to Bullish).
Trend Continuation (BOS): Signals when the current trend is confirmed by a new structural break.
Discount Zone Entry (Long Bias): Notifies you when the price enters the Discount Zone while the Market Phase is Bullish. This prevents FOMO buying at high prices.
Premium Zone Entry (Short Bias): Notifies you when the price enters the Premium Zone while the Market Phase is Bearish. This ensures you are selling at institutional "expensive" prices.
How to set up Alerts:
Click the Alerts icon in the right sidebar.
Under Condition, select: SMC Strategy Tool v1.0 - Institutional Suite.
Select "Any alert() function call" (or Qualsiasi chiamata alla funzione alert()).
Choose your preferred notification method (Popup, Email, or App notification).
The alert message will automatically include the Ticker, Timeframe, and the specific action to take!

NQ Hourly Retracements - 12y Stats with LevelsHour Stats with Levels - TradingView Indicator Description
IMPORTANT: NQ FUTURES ONLY
This indicator is specifically designed for and calibrated to NQ (Nasdaq-100 E-mini) futures only. The statistical data is derived exclusively from 13 years of NQ price action (2013-2025). Do not use this indicator on any other asset, ticker, or market as the statistics will not be applicable and may lead to incorrect trading decisions.
Overview
"Hour Stats with Levels" is a statistical analysis indicator that provides real-time probability-based insights into hourly price behavior patterns. The indicator combines historical pattern recognition with live price action to help traders anticipate potential sweep and reversal scenarios within each trading hour.
Originality and Core Concept
This indicator is based on a comprehensive statistical analysis of 12y years of 1-minute NQ futures data, examining a specific price pattern: when an hourly candle opens inside the previous hour's range. Unlike generic support/resistance indicators, this tool provides hour-specific, context-aware probabilities based on 30,000+ historical occurrences of this pattern.
The originality lies in three key areas:
Pattern-Specific Statistics: Rather than applying generic technical analysis, the indicator only activates when the current hour opens within the previous hour's range, providing relevant statistics for this exact scenario.
Context-Aware Probabilities: Statistics are differentiated based on whether the current hour opened above or below the previous hour's open, recognizing that bullish and bearish opening contexts produce different behavioral patterns.
Comprehensive Retracement Tracking: The indicator tracks four independent retracement levels after a sweep occurs, showing the probability of price returning to: the swept level itself (90+% probability), the 50% level, the current hour's open, and the opposite extreme.
How It Works
The Core Pattern
The indicator monitors a specific price structure:
Setup Condition: The current hourly candle opens inside (between) the previous hour's high and low
Sweep Event: Price then breaks above the previous high (high sweep) or below the previous low (low sweep)
Retracement Analysis: After a sweep, the indicator tracks whether price retraces to key levels
Statistical Foundation
The underlying analysis processed 1-minute bar data from 2013-2025, identifying every instance where an hourly candle opened inside the previous hour's range. For each occurrence, the system tracked:
Whether the high, low, or both were swept during that hour
The distance of the sweep measured as a percentage of the previous hour's range
Whether price retraced to four key levels: the swept level, the 50% point, the current open, and the opposite extreme
These measurements were aggregated for all 24 hours of the trading day, with separate statistics for bullish contexts (opening above previous open) and bearish contexts (opening below previous open), creating 48 unique statistical profiles.
Sweep Distance Percentiles
The "reversal levels" are drawn based on historical sweep distance distributions:
25th Percentile: 75% of historical sweeps were larger than this distance. This represents a conservative reversal zone where smaller, contained sweeps typically reverse.
Median (50th Percentile): The midpoint of all historical sweep distances. Half of all sweeps reversed before reaching this level, half extended beyond it.
75th Percentile: Only 25% of sweeps extended beyond this distance. This represents an extended sweep zone where price has historically shown exhaustion.
For example, if the previous hour's range was 20 points and the median high sweep distance is 40% of range, the median reversal level would be placed 8 points above the previous high.
How to Use the Indicator
Sweeps were calculated using 1m data - as such, it's recommended to use the indicator on a 1min chart
Visual Components
Hour Delimiter (Gray Vertical Line)
Marks the start of each new hour
Helps identify when new statistics become active
Sweep Markers
Green "H" label: High sweep has occurred this hour
Red "L" label: Low sweep has occurred this hour
Markers appear on the exact bar where the sweep happened
Target Levels (Blue Lines)
Prev Open: Previous hour's opening price
Prev High: Previous hour's highest price (sweep target)
Prev Low: Previous hour's lowest price (sweep target)
Prev 50%: Midpoint of previous hour's range
Current Open: Current hour's opening price (key retracement target)
Reversal Levels (Purple Dashed Lines)
Positioned beyond the previous high/low based on historical sweep percentiles
Three levels above previous high (for high sweeps)
Three levels below previous low (for low sweeps)
These represent statistically-derived zones where sweeps typically exhaust
The Statistics Table
The table dynamically updates each hour and displays different statistics based on whether the current hour opened above or below the previous hour's open.
Status Row
Shows current state: waiting for sweep, or which sweep(s) have occurred
If waiting, indicates which sweep is more probable based on historical data
SWEEP PROBABILITIES Section
High Sweep: Historical probability (%) that price will sweep the previous high this hour
Low Sweep: Historical probability (%) that price will sweep the previous low this hour
Both Sweeps: Historical probability (%) that price will sweep both levels this hour
These probabilities are derived from counting how many times each pattern occurred in similar historical contexts. For example, "High Sweep: 73.18%" means that in 73.18% of historical occurrences where the hour opened in this same context (same hour of day, same position relative to previous open), price swept the previous high before the hour closed.
AFTER HIGH SWEEP → Section
These statistics activate only after a high sweep has occurred. They show the probability of price retracing to various levels:
→ Prev High: Probability that price returns to (or below) the level it just swept. This is typically 90%+ because sweeps often act as "false breakouts" or liquidity grabs before reversal.
→ 50% Level: Probability that price retraces at least halfway back into the previous hour's range. This represents a moderate retracement.
→ Current Open: Probability that price retraces all the way back to where the current hour opened. This indicates a complete reversal of the sweep move.
→ Prev Low: Probability that price retraces entirely through the previous range to touch the opposite extreme. This represents a full reversal pattern.
AFTER LOW SWEEP → Section
Mirror of the above, but for low sweeps:
→ Prev Low: Retracement to the swept low level (90%+ probability)
→ 50% Level: Retracement to middle of range
→ Current Open: Full retracement to current hour's open
→ Prev High: Complete reversal to opposite extreme
Important Note on Retracement Statistics: These percentages are tracked independently. A 90% probability of returning to the swept level doesn't mean there's only a 10% chance of deeper retracement. Price can (and often does) retrace through multiple levels sequentially. The percentages show how many times price reached at least that level, not where it stopped.
Trading Applications
Anticipating Sweeps
When an hour opens inside the previous range, check the probabilities. If "High Sweep: 70%" and "Low Sweep: 30%", you know there's a 70% historical likelihood of an upside sweep occurring this hour. This doesn't guarantee it will happen, but provides statistical context for potential setups.
Reversal Trading
The most reliable pattern in the data is the 90%+ retracement probability to swept levels. When a sweep occurs, traders can anticipate a retracement back to at least the swept level in the vast majority of cases. The reversal level percentiles help identify where sweeps may exhaust.
Position Management
The retracement probabilities help manage existing positions. For example, if you're long and a high sweep occurs, you know there's a 90%+ chance of at least some retracement to the swept level, which might inform profit-taking or stop-loss decisions.
Confluence with Current Open
The "Current Open" retracement statistics (typically 60-70%) highlight the magnetic quality of the hour's opening price. After a sweep, price frequently returns to test this level.
Customization Options
The indicator offers extensive visual customization:
Toggle on/off: hour delimiters, sweep markers, target levels, reversal levels, statistics table
Customize colors, line widths, and styles for all visual elements
Adjust label sizes and table position
Show/hide individual target levels and reversal percentiles
Limitations and Considerations
Pattern-Specific: The indicator only provides statistics when the current hour opens inside the previous hour's range. If the hour opens outside this range (gaps up or down), the statistics are not applicable.
Historical Probabilities: The percentages represent historical frequencies, not predictions. A 70% probability means it happened 70% of the time historically, not that it will definitely happen 7 out of 10 times going forward.
NQ-Specific Calibration: All statistics are derived from NQ futures data. Market behavior, volatility, and patterns differ across assets.
Hour-Specific Behavior: Different hours show dramatically different statistics. For example, the 9 AM EST hour (market open) shows much higher sweep probabilities (80%+) than the 5 PM EST hour (30-50%) due to differing liquidity and volatility conditions.
No Guarantee of Execution: While a 90% retracement probability is high, it means 10% of the time, price did NOT retrace. Always use proper risk management.
Technical Notes
The indicator uses hourly timeframe data via request.security() to determine previous hour values
Sweep detection occurs in real-time on the chart's timeframe
Statistics are hardcoded from the comprehensive backtested analysis (not calculated on-the-fly)
The indicator stores static values at the start of each hour to ensure consistency as the hour progresses
All percentage values are rounded to one decimal place for clarity
This indicator provides a statistically-grounded framework for understanding hourly price behavior in NQ futures. By combining real-time pattern detection with comprehensive historical analysis, it offers traders probabilistic insights to inform decision-making process within the specific context of each trading hour.
