Gann Square 9 Cross Cardinal Table ConceptThis indicator was intended as educational purpose only for Gann Square 9, specifically to show Cross and Cross Cardinal.
This indicator was build upon The Tunnel Thru The Air Or Looking Back From 1940, written by WD Gann.
Indikator ini bertujuan sebagai pendidikan sahaja untuk Gann Square 9, khusus untuk menunjukkan Cross dan Cross Cardinal.
Indikator ini dibina berdasarkan buku The Tunnel Thru The Air Or Looking Back From 1940, ditulis oleh WD Gann.
Indicator features :
1. Font size from tiny to huge.
2. For desktop display only, not for mobile.
3. All values can be selected individually.
Kemampuan indikator :
1. Saiz font dari paling kecil ke paling besar.
2. Untuk paparan desktop sahaja, bukan untuk mobile.
3. Semua nilai boleh dipilih secara individu.
FAQ
1. Credits / Kredit
WD Gann, The Tunnel Thru The Air Or Looking Back From 1940
Ganzilla
2. Page involved / Muka Surat terlibat
195 - 198
3. Code Usage / Penggunaan Kod
Free to use for personal usage.
Bebas untuk kegunaan peribadi.
Left : All values off / Kiri : Semua nilai off
Right : All values on / Kanan : Semua nilai on
Left : All Cross / Kiri : Semua Cross
Right : All Cross Cardinal/ Kanan : Semua Cross Cardinal
Left : Random Usage / Kiri : Kegunaan Random
Right : Ideal Usage / Kanan : Kegunaan Ideal
ค้นหาในสคริปต์สำหรับ "gann"

GannLSVZO Indicator [Algo Alert]The Volume Zone oscillator breaks up volume activity into positive and negative categories. It is positive when the current closing price is greater than the prior closing price and negative when it's lower than the prior closing price. The resulting curve plots through relative percentage levels that yield a series of buy and sell signals, depending on level and indicator direction.
The Gann Laplace Smoothed Volume Zone Oscillator GannLSVZO is a refined version of the Volume Zone Oscillator, enhanced by the implementation of the upgraded Discrete Fourier Transform, the Laplace Stieltjes Transform. Its primary function is to streamline price data and diminish market noise, thus offering a clearer and more precise reflection of price trends.
By combining the Laplace with Gann Swing Entries and Exits (orange X) and with Ehler's white noise histogram, users gain a comprehensive perspective on volume-related market conditions.
HOW TO USE THE INDICATOR:
The default period is 2 but can be adjusted after backtesting. (I suggest 5 VZO length and NoiceR max length 8 as-well)
The VZO points to a positive trend when it is rising above the 0% level, and a negative trend when it is falling below the 0% level. 0% level can be adjusted in setting by adjusting VzoDifference. Oscillations rising below 0% level or falling above 0% level result in a natural trend.
ORIGINALITY & USFULLNESS:
Personal combination of Gann swings and Laplace Stieltjes Transform of a price which results in less noise Volume Zone Oscillator.
The Laplace Stieltjes Transform is a mathematical technique that transforms discrete data from the time domain into its corresponding representation in the frequency domain. This process involves breaking down a signal into its individual frequency components, thereby exposing the amplitude and phase characteristics inherent in each frequency element.
This indicator utilizes the concept of Ehler's Universal Oscillator and displays a histogram, offering critical insights into the prevailing levels of market noise. The Ehler's Universal Oscillator is grounded in a statistical model that captures the erratic and unpredictable nature of market movements. Through the application of this principle, the histogram aids traders in pinpointing times when market volatility is either rising or subsiding.
The Gann swings and the Gan swing strategy is developed by meomeo105, this Gann high and low algorithm forms the basis of the EMA modification.
DETAILED DESCRIPTION:
My detailed description of the indicator and use cases which I find very valuable.
What is oscillator?
Oscillators are chart indicators that can assist a trader in determining overbought or oversold conditions in ranging (non-trending) markets.
What is volume zone oscillator?
Price Zone Oscillator measures if the most recent closing price is above or below the preceding closing price.
Volume Zone Oscillator is Volume multiplied by the 1 or -1 depending on the difference of the preceding 2 close prices and smoothed with Exponential moving Average.
What does this mean?
If the VZO is above 0 and VZO is rising. We have a bullish trend. Most likely.
If the VZO is below 0 and VZO is falling. We have a bearish trend. Most likely.
Rising means that VZO on close is higher than the previous day.
Falling means that VZO on close is lower than the previous day.
What if VZO is falling above 0 line?
It means we have a high probability of a bearish trend.
Thus the indicator returns 0 and Strategy closes all it's positions when falling above 0 (or rising bellow 0) and we combine higher and lower timeframes to gauge the trend.
What is approximation and smoothing?
They are mathematical concepts for making a discrete set of numbers a
continuous curved line.
Laplace Stieltjes Transform approximation of a close price are taken from aprox library.
Key Features:
You can tailor the Indicator/Strategy to your preferences with adjustable parameters such as VZO length, noise reduction settings, and smoothing length.
Volume Zone Oscillator (VZO) shows market sentiment with the VZO, enhanced with Exponential Moving Average (EMA) smoothing for clearer trend identification.
Noise Reduction leverages Euler's White noise capabilities for effective noise reduction in the VZO, providing a cleaner and more accurate representation of market dynamics.
Choose between the traditional Fast Laplace Stieltjes Transform (FLT) and the innovative Double Discrete Fourier Transform (DTF32) soothed price series to suit your analytical needs.
Use dynamic calculation of Laplace coefficient or the static one. You may modify those inputs and Strategy entries with Gann swings.
I suggest using "Close all" input False when fine-tuning Inputs for 1 TimeFrame. When you export data to Excel/Numbers/GSheets I suggest using "Close all" input as True, except for the lowest TimeFrame. I suggest using 100% equity as your default quantity for fine-tune purposes. I have to mention that 100% equity may lead to unrealistic backtesting results. Be avare. When backtesting for trading purposes use Contracts or USDT.

Geometric Price-Time Triangle Calculator═══════════════════════════════════════════════════
GEOMETRIC PRICE-TIME TRIANGLE CALCULATOR
═══════════════════════════════════════════════════
Calculates Point C of a geometric triangle using different rotation angles from any selected price swing. Based on Bradley F. Cowan's Price-Time Vector (PTV) methods from "Four-Dimensional Stock Market Structures and Cycles."
📐 WHAT IT DOES
────────────────────────────────────────────────────
Select two points (A and B) on any swing, choose an angle, and the indicator calculates where Point C would be mathematically. It's just vector rotation applied to price charts.
This shows you where Point C lands in both price AND time based on pure geometry - not a prediction, just a calculation.
🎯 FEATURES
────────────────────────────────────────────────────
✓ 10 Different Angles
• Gann ratios: 18.435° (1x3), 26.565° (1x2), 45° (1x1), 63.435° (2x1), 71.565° (3x1)
• Other angles: 30°, 60°, 90°, 120°, 150°
✓ Visual Triangle
• Adjustable colors and opacity for points A, B, C
• Line styles: Solid, Dashed, Dotted
• Extend lines: None, Left, Right, Both
✓ Crosshair at Point C
• Shows where Point C is located
• Vertical line = bar position
• Horizontal line = price level
✓ Data Table
• Shows all calculations
• Price-to-Bar ratio
• Point C location (price and bars from A/B)
• Toggle on/off
🔧 HOW TO USE
────────────────────────────────────────────────────
1. Pick your swing start date (Point A)
2. Pick your swing end date (Point B) - make sure these dates capture the actual high/low of your swing
3. Choose an angle from the dropdown
4. Look at Point C - that's where the geometry puts it
Different angles = different Point C locations. Whether price actually goes there is up to the market.
📊 THE ANGLES
────────────────────────────────────────────────────
- 18.435° (1x3) - Shallow rotation
- 26.565° (1x2) - Moderate rotation
- 45° (1x1) - Gann's balanced ratio
- 60° - Equilateral triangle (default)
- 63.435° (2x1) - Steeper rotation
- 71.565° (3x1) - Very steep rotation
- 90° - Right angle
- 120°-150° - Obtuse angles
💡 PRACTICAL USE
────────────────────────────────────────────────────
→ See where geometric patterns would complete
→ Test if your market respects certain angles
→ Find where multiple angles converge
→ Compare projected Point C to actual price action
→ Use 90° to see symmetrical price/time relationships
→ Backtest historical swings to see what worked
⚙️ HOW IT WORKS
────────────────────────────────────────────────────
1. Takes your AB swing
2. Calculates the BA vector (reverse direction)
3. Normalizes price and time using Price-to-Bar ratio
4. Rotates the vector by your selected angle
5. Converts back to chart coordinates
Basic trigonometry. That's all it is.
📚 BACKGROUND
────────────────────────────────────────────────────
Based on Bradley F. Cowan's Price-Time Vector (PTV) concept from "Four-Dimensional Stock Market Structures and Cycles" and W.D. Gann's geometric angle analysis. Cowan observed that markets sometimes complete geometric patterns. This tool calculates where those patterns would complete mathematically. Whether price actually respects these geometric relationships is something you need to test yourself.
⚠️ IMPORTANT
────────────────────────────────────────────────────
- This is geometric calculation, not prediction
- Point C shows where the math puts it, not where price will go
- Some angles might work for your market, some won't
- Test it yourself on historical data
- Price-to-Bar Ratio stays constant regardless of angle
- Don't trade based on this alone
- Works on all timeframes and assets
🎨 CUSTOMIZATION
────────────────────────────────────────────────────
- Show/hide triangle
- Individual colors for A, B, C points
- Adjust opacity (0-100)
- Line styles for each triangle side
- Extend lines left/right/both/none
- Show/hide data table
- Crosshair color and width
- Customizable table colors
═══════════════════════════════════════════════════

Gann & Fibonacci Analysis for MSTRYes! Below is a step-by-step guide to performing Gann Analysis on MSTR in TradingView for the last year.
Step 1: Set Up the Chart
Open TradingView and search for MSTR (MicroStrategy).
Select the 1-day (D) timeframe to analyze the past year.
Set your chart to logarithmic scale (⚙ Settings → Scale → Log).
Enable grid lines for alignment (⚙ Settings → Appearance → Grid Lines).
Step 2: Identify Key Highs and Lows (Last Year)
Find the 52-week high and 52-week low for MSTR.
As of now:
52-Week High: ~$999 (March 2024).
52-Week Low: ~$280 (October 2023).
Step 3: Plot Gann Angles
Using TradingView's Gann Fan Tool:
Select "Gann Fan" (Press / and type “Gann Fan” to find it).
Start at the 52-week low (~$280, October 2023) and drag upwards.
Adjust the angles to match key levels:
1x1 (45°) → Main trendline
2x1 (26.5°) → Strong uptrend
4x1 (15°) → Weak trendline
1x2 (63.75°) → Strong resistance
Repeat the process from the 52-week high (~$999, March 2024) downward to see bearish angles.
Step 4: Apply Fibonacci & Gann Retracement Levels
Using Fibonacci Retracement:
Select "Fibonacci Retracement" tool.
Draw from 52-week high ($999) to 52-week low ($280).
Enable key Fibonacci levels:
23.6% ($816)
38.2% ($678)
50% ($640)
61.8% ($550)
78.6% ($430)
Watch for price reactions near these levels.
Using Gann Retracement Levels:
Select "Gann Box" in TradingView.
Draw from 52-week high ($999) to low ($280).
Enable key Gann retracement levels:
12.5% ($912)
25% ($850)
37.5% ($768)
50% ($640)
62.5% ($550)
75% ($480)
87.5% ($350)
Identify confluences with Gann angles and Fibonacci levels.
Step 5: Identify Significant Dates & Time Cycles
Use "Date Range" Tool in TradingView.
Mark major turning points:
High → Low: ~180 days (Half-year cycle).
Low → High: ~90 days (Quarter cycle).
Use Square-Outs (Time = Price method):
Example: If MSTR hit $500, check 500 days from key events.
Mark key anniversaries of past highs/lows for possible reversals.
Step 6: Analyze and Trade Execution
✅ If MSTR is at a Gann angle + Fibonacci level + key date → Expect a reaction.
✅ Use RSI, MACD, and Volume for extra confirmation.
✅ Set Stop-Loss at nearest Gann support/resistance.

Gann Square 4 Table Concept Alternate UIThis indicator was intended as educational purpose only for Gann Square 4, specifically to show Cross Cardinal.
This indicator was build upon The Tunnel Thru The Air Or Looking Back From 1940, written by WD Gann .
This build was improved based on Gann Square 4 Cross Cardinal Table Concept by grouping similar values after selected to save time.
User Interface also was improved.
Indikator ini bertujuan sebagai pendidikan sahaja untuk Gann Square 4, khusus untuk menunjukkan Cross Cardinal.
Indikator ini dibina berdasarkan buku The Tunnel Thru The Air Or Looking Back From 1940, ditulis oleh WD Gann .
Binaan ini telah ditambah baik berdasarkan Gann Square 4 Cross Cardinal Table Concept dengan mengumpulkan nilai yang sama setelah dipilih untuk menjimatkan masa.
User Interface juga telah ditambah baik.
Indicator features :
1. Font size from tiny to huge.
2. For desktop display only, not for mobile.
3. All values can be selected by group.
Kemampuan indikator :
1. Saiz font dari paling kecil ke paling besar.
2. Untuk paparan desktop sahaja, bukan untuk mobile.
3. Semua nilai boleh dipilih secara berkumpulan.
FAQ
1. Credits / Kredit
WD Gann , The Tunnel Thru The Air Or Looking Back From 1940
Ganzilla
2. Page involved / Muka Surat terlibat
195 - 198
3. Code Usage / Penggunaan Kod
Free to use for personal usage.
Bebas untuk kegunaan peribadi.
4. Previous build / Binaan sebelum ini
Gann Square 4 Cross Cardinal Table Concept
5. Related build / Binaan berkaitan
Gann Square 9 Cross Cardinal Table Concept
Left : Even array number / Kiri : Array nombor genap
Right : Odd array number / Kanan : Array nombor ganjil

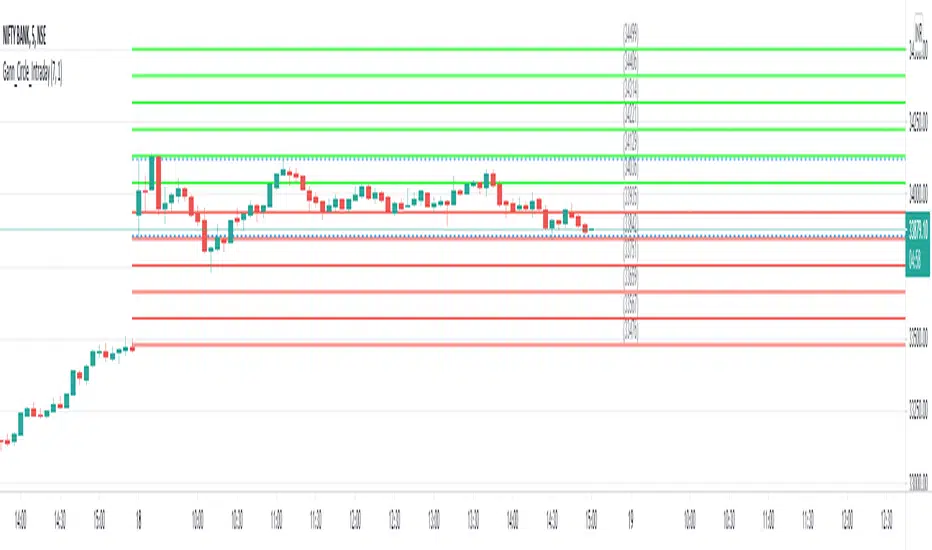
Gann Circle Intraday LevelsThis indicator is an intraday version of Gann Circle Swing Levels indicator. It further divides the Gann Circle into the Eighths in order to generate intraday Levels.
Introduction
This indicator is based on W. D. Gann's Square of 9 Chart and can be interpreted as the Gann Circle / Gann Wheel / 360 Degree Circle Chart or Square of the Circle Chart for intraday usage.
Spiral arrangement of numbers on the Square of 9 chart creates a very unique square root relationship amongst the numbers on the chart. If you take any number on the Square of 9 chart, take the square root of the number, then add 2 to the root and re-square it, resulting in one full 360 degree cycle (i.e. a 360 degree Circle) out from the center of the chart.
For example,
the square root of 121 = 11,
11 + 2 = 13,
and the square of 13 = 169
The number 169 is one full 360 degree cycle out (with reference to 121) from the center of the Square of 9 chart. If we further divide the circle in eight equal parts of 45 degree each, following intermediate resistance levels (ascending) would be generated:
127 (45 degree)
133 (90 degree)
139 (135 degree)
145 (180 degree)
151 (225 degree)
157 (270 degree)
163 (315 degree)
Similarly, if you take any number on the Square of 9 chart, take the square root of the number, then subtract 2 from the root and re-square it, resulting in one full 360 degree inward rotation towards the center of the chart.
For example,
the square root of 565 = 23.77,
23.77 - 2 = 21.77,
and the square of 21.77 = 473.93 (approximately equal to 474, which is directly below 565 on the Square of 9 chart)
The number 474 is one full 360 degree inward rotation (with reference to 565) towards the center of the chart. If we further divide the circle in eight equal parts of 45 degree each, following intermediate support levels (descending) would be generated:
553 (45 degree)
541 (90 degree)
529 (135 degree)
518 (180 degree)
507 (225 degree)
496 (270 degree)
485 (315 degree)
How to Use this Indicator ?
This indicator is designed to generate Gann Circle Intraday Levels based on HIGH and LOW of the opening bar for the day. You may use the bar interval (1 minute, 3 minutes, 5 minutes, 15 minutes etc.) which is suitable for the underlying instrument. Support and resistance lines for the day would be generated only after confirmation of the opening bar of the day.
Input :
Number of Gann Levels (Number of Gann Levels to be projected)
Color codes for the Support and Resistance Levels
Output :
Gann Support or Resistance Levels:
HIGH and LOW of the Opening bar for the day (dashed BLUE lines)
Support levels calculated with reference to the HIGH of the opening bar
Resistance levels calculated with reference to the LOW of the opening bar
Gann Square of 144 (Master Price & Time)🔹 What this tool does
Draws a 144-unit square in price & time (0 → 144)
Plots all key horizontal & vertical levels:
0, 18, 36, 48, 54, 72, 90, 96, 108, 126, 144
Highlights the main 1/2 level (72) as thick midline
Marks 1/3 and 2/3 (48 & 96) as special harmonic levels
Draws internal diagonals (0–144, 144–0 and sub-squares)
Plots an 8-ray Gann fan from the 0-point (0 → 36 / 72 / 108 / 144 etc.)
Keeps price–time ratio consistent inside the box:
the 1×1 angle has a fixed slope = price_per_bar
The idea: once the square is calibrated to a major swing, you can study how price respects these angles and harmonic zones over time.
🔧 Inputs & how to set it up correctly
Choose your timeframe
Works best on Daily and Weekly charts.
Use one timeframe consistently when calibrating the square.
Start offset (bars back)
Start offset (bars back) shifts the whole square left/right.
Increase the value to move the square further into the past, decrease it to move it closer to the current bars.
Box width (bars)
Box width (bars) = how many bars the square spans horizontally.
Bigger value = projects the structure further into the future.
Example: 288 bars ≈ 2×144 units in time, 720 bars for longer-term projection, etc.
Bottom price
Bottom price is your 0-level in price.
Usually set this to a major swing low (cycle low, bear market low, important pivot).
The bottom-left corner of the square conceptually sits at:
(start_offset_bar, bottom_price)
Price per bar (slope 1×1) (if your version has this input)
This defines the slope of the 1×1 angle (main Gann angle).
Recommended way to set it:
Pick a major impulsive move from Swing Low → Swing High.
Measure:
Price range = High − Low
Number of bars between them.
Compute:
price_per_bar = price_range / number_of_bars
Use that as your 1×1 value in the input.
Now the main diagonal from 0 to 144 represents the true Gann 1×1 for that swing.
Important: The 1×1 angle is mathematically correct (price-per-bar), even if it does not always look like a perfect 45° line visually in TradingView due to chart scaling.
📖 How to read the Square of 144
Horizontal levels
0 = anchor price (bottom)
18, 36, 48, 54, 72, 90, 96, 108, 126, 144 = key price harmonics
72 (1/2) often acts as major support/resistance
48 & 96 (1/3 and 2/3) are strong “vibration” levels
Vertical levels
Same units but in time (bars).
When important pivots in price occur near these verticals, you get time–price confluence.
Midlines (1/2)
The thick horizontal and vertical lines at 72 mark the center of the square.
Crossings around these often signal important cycle turns.
1/3 & 2/3 zones (48–54 and 90–96)
These narrow bands are powerful reversal / decision zones.
Price often reacts strongly there or accelerates if they break.
Gann fan from 0-point
These rays represent major trends:
1×1 equivalent (main diagonal)
Faster & slower angles (e.g. 2×1, 1×2, etc depending on configuration)
If price breaks one fan angle cleanly, it often “falls” or “climbs” toward the next one.
🎯 Practical use cases
Project future support/resistance zones based on a major low.
See where price is in the square: early in the cycle (0–36), mid (around 72), or late (108–144).
Watch how price respects:
midlines (72),
1/3 and 2/3 bands (48–54, 90–96),
and the fan angles from 0.
Combine with your own price action / Fibonacci / trend tools – this is not a signal generator, but a time–price map.
⚠️ Notes & limitations
This tool is for educational & analytical purposes only.
It does not generate buy/sell signals.
Visual 45° angles in TradingView can change when you zoom or rescale the chart.
→ The script keeps the internal price-per-bar logic stable, even if the drawing looks steeper/flatter when zooming.
Always confirm zones with price action, volume, and higher timeframe context.

Gann Astronomical Turning PointsThis is a comprehensive Pine Script that implements W.D. Gann's astronomical theories to identify potential market turning points. Here's a detailed breakdown of the script:
Overview
The script identifies and displays astronomical events (sun angles, moon phases, and Mercury retrogrades) that Gann theorists believe correlate with market turning points. It also analyzes historical price performance following these events to provide statistical significance.
Key Components
1. Input Parameters
Date Range: Users can set the analysis period (start and end dates)
Display Options: Toggle visibility of different astronomical events and tables
Analysis Settings: Configure the lookback period for price change analysis (1-20 days)
2. Astronomical Calculations
The script includes several functions to calculate celestial positions:
getDaysSinceEpoch(t): Calculates days since January 1, 2000 (reference point)
getSunLongitude(t): Computes the Sun's position in the ecliptic (0-360°)
getMoonPhase(t): Determines the Moon's phase angle relative to the Sun
getMercuryLongitude(t): Calculates Mercury's position in the ecliptic
3. Gann Critical Angles (Sun Events)
The script identifies when the Sun reaches four critical angles that Gann considered significant:
0° Aries (Spring Equinox)
90° Cancer (Summer Solstice)
180° Libra (Fall Equinox)
270° Capricorn (Winter Solstice)
These are detected by tracking when the Sun's longitude crosses these specific angles.
4. Moon Phases
Four key moon phases are identified:
New Moon: Moon passes between Earth and Sun
First Quarter: Moon is 90° east of Sun
Full Moon: Moon is opposite the Sun
Last Quarter: Moon is 270° east of Sun
5. Mercury Retrograde Periods
The script detects when Mercury appears to move backward in its orbit:
Identifies start and end dates of retrograde motion
Displays these periods as highlighted zones on the chart
6. Price Change Analysis
For each astronomical event, the script:
Calculates the percentage price change over a user-defined lookback period
Categorizes changes as positive or negative
Stores this data for statistical analysis
7. Statistical Significance
The script calculates several metrics for each event type:
Average Price Change: Mean percentage change following events
Up/Down Ratio: Number of positive vs. negative changes
Accuracy Percentage: How often the dominant direction occurred
8. Visual Elements
The script includes multiple display components:
Event Labels
Sun Angles: Orange sun symbols displayed above price bars
Moon Phases: Moon phase emojis displayed below price bars
Mercury Retrograde: Red boxes highlighting the retrograde periods
Information Tables
Events Table: Shows upcoming and recent astronomical events
Significance Analysis Table: Displays statistical performance of each event type
Forecast Section: Identifies the next upcoming event and predicted direction
9. Forecasting Functionality
The script predicts market direction for the next astronomical event based on:
Historical average price change for that event type
Statistical accuracy of previous similar events
Color-coded forecast (green for bullish, red for bearish)
This script offers an interesting implementation of Gann's astronomical theories, but should be used as part of a broader analysis rather than as a standalone trading system.
Disclaimer: This indicator is for educational purposes only. Past performance does not guarantee future results. Always conduct your own research and risk assessment before trading.

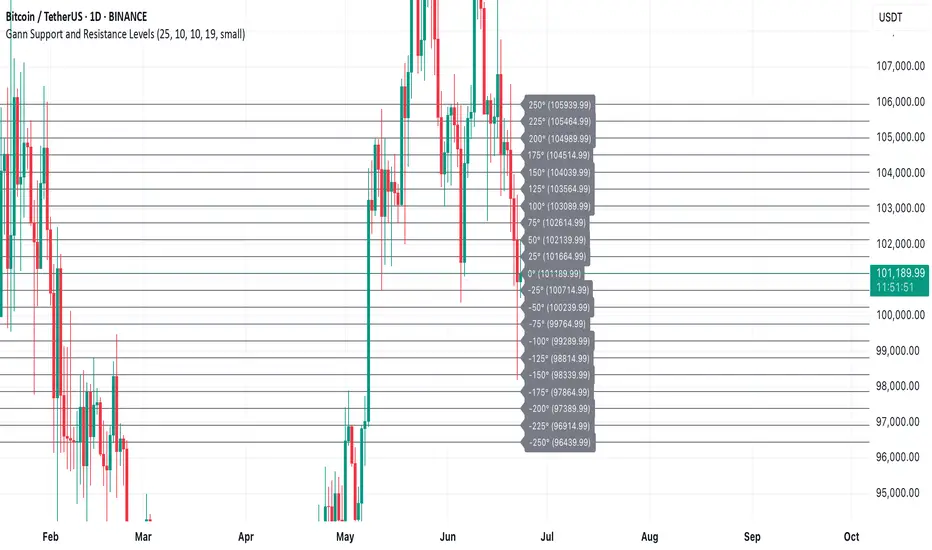
Gann Support and Resistance LevelsThis indicator plots dynamic Gann Degree Levels as potential support and resistance zones around the current market price. You can fully customize the Gann degree step (e.g., 45°, 30°, 90°), the number of levels above and below the price, and the price movement per degree to fine-tune the levels to your strategy.
Key Features:
✅ Dynamic levels update automatically with the live price
✅ Adjustable degree intervals (Gann steps)
✅ User control over how many levels to display above and below
✅ Fully customizable label size, label color, and text color for mobile-friendly visibility
✅ Clean visual design for easy chart analysis
How to Use:
Gann levels can act as potential support and resistance zones.
Watch for price reactions at major degrees like 0°, 90°, 180°, and 270°.
Can be combined with other technical tools like price action, trendlines, or Gann fans for deeper analysis.
📌 This tool is perfect for traders using Gann theory, grid-based strategies, or those looking to enhance their visual trading setups with structured levels.
SW Gann DaysGann pressure days, named after the famous trader W.D. Gann, refer to specific days in a trading month that are believed to have significant market influence. These days are identified based on Gann's theories of astrology, geometry, and market cycles. Here’s a general outline of how they might be understood:
1. **Market Cycles**: Gann believed that markets move in cycles and that certain days can have heightened volatility or trend changes. Traders look for specific dates based on historical price movements.
2. **Timing Indicators**: Pressure days often align with key economic reports, earnings announcements, or geopolitical events that can cause price swings.
3. **Mathematical Patterns**: Gann used angles and geometric patterns to predict price movements, with pressure days potentially aligning with these calculations.
4. **Historical Patterns**: Traders analyze past data to identify dates that historically show strong price reactions, using this to predict future behavior.
5. **Astrological Influences**: Some practitioners incorporate astrological elements, believing that celestial events (like full moons or planetary alignments) can impact market psychology.
Traders might use these concepts to make decisions about entering or exiting positions, but it’s important to note that Gann's methods can be complex and are not universally accepted in trading communities.

Gann RetracementThe indicator is based on W. D. Gann's method of retracement studies. Gann looked at stock retracement action in terms of Halves (1/2), Thirds (1/3, 2/3), Fifths (1/5, 2/5, 3/5, and 4/5) and more importantly the Eighths (1/8, 2/8, 3/8, 4/8, 5/8, 6/8, and 7/8). Needless to say, {2, 3, 5, 8} are the only Fibonacci numbers between 1 to 10. These ratios can easily be visualized in the form of division of a Circle as follows :
Divide the circle in 12 equal parts of 30 degree each to produce the Thirds :
30 x 4 = 120 is 1/3 of 360
30 x 8 = 240 is 2/3 of 360
The 30 degree retracement captures fundamental geometric shapes like a regular Triangle (120-240-360), a Square (90-180-270-360), and a regular Hexagon (60-120-180-240-300-360) inscribed inside of the circle.
Now, divide the circle in 10 equal parts of 36 degree each to produce the Fifths :
36 x 2 = 72 is 1/5 of 360
36 x 4 = 144 is 2/5 of 360
36 x 6 = 216 is 3/5 of 360
36 x 8 = 288 is 4/5 of 360
where, (72-144-216-288-360) is a regular Pentagon.
Finally, divide the circle in 8 equal parts of 45 degree each to produce the Eighths :
45 x 1 = 45 is 1/8 of 360
45 x 2 = 90 is 2/8 of 360
45 x 3 = 135 is 3/8 of 360
45 x 4 = 180 is 4/8 of 360
45 x 5 = 225 is 5/8 of 360
45 x 6 = 270 is 6/8 of 360
45 x 7 = 315 is 7/8 of 360
where, (45-90-135-180-225-270-315-360) is a regular Octagon.
How to Use this indicator ?
The indicator generates Gann retracement levels between any two significant price points, such as a high and a low.
Input :
Swing High (significant high price point, such as a top)
Swing Low (significant low price point, such as a bottom)
Degree (degree of retracement)
Output :
Gann retracement levels (color coded as follows) :
Swing High and Swing Low (BLUE)
50% retracement (ORANGE)
Retracements between Swing Low and 50% level (RED)
Retracements between 50% level and Swing High (LIME)

Doubled Numbered Square of Nine Progression | RegressionThe Doubled Number Square of Nine Progression | Regression Indicator enables forecasting of support and resistance levels using the SQ9 progression or regression from a user-selected pivot price. The indicator also plots adjustable pivots on both the chart and the Square of Nine.
How to use to forecast support and resistance levels:
1. Select a Pivot Point: Choose a top or bottom pivot to use as the starting point. Select High or Low in the indicator to set the correct price to the pivot.
2. Set Price Increment or Decrement: Select a price increment to advance the starting price on the Square of Nine (for example 1 or -0.01).
3. Rotate to add or decrease the number of rungs on the Square on Nine: Rotate the Square of Nine and adjust the dimensions. The horizontal levels correlate to the rotation of the Square of Nine.
4. Plot Levels: Select a Square of Nine angle to plot the support and resistance levels based on the selected increments. These levels auto expand and decrease depending on the number of rotations in step 3. The price values from each of the selected diagonal or cardinal cross are applied to the chart with labels on both left and right. Left labels represent the cell the time variable and the right label is price.
5. Review Levels: Conduct a simple review of the plotted support and resistance levels in relation to recent market pivots.
6. Identify Correlations: Identify the Square of Nine cardinal cross or diagonal cross angle that correlates with the most market pivots.
7. The indicator plots user-adjustable pivots on both candles/bars and displays their placement on the Square of Nine in both Progression and Regression. The close price is plotted on the Square of Nine in real-time with a white background. This helps users identify which angles the highs and lows favor from the selected pivot. The pivot levels' colors can be adjusted.
Each market has its tendencies, favoring specific angles from the cardinal or diagonal cross. The basic idea is to choose between the diagonal cross and cardinal cross angles to forecast support and resistance levels.
Settings:
Overview:
Example on Forecasting Support and resistance level using this indicator:
In the image above, I'm progressing from the significant low at a rate of $200 per cell. Based on the plotted pivots, I've selected the 315-degree angle on the diagonal cross as it aligns with a few recent pivots. Now, I've drawn a vertical line to show that as we add rungs to the Square of Nine, we introduce support and resistance levels based on the identified angle that aligns with these early pivots from the low.
In the image below, I've moved forward in time to show how the initial angle selected based on the early pivot forecasted support and resistance levels around the high in BTC. Do not expect the price to turn sharply at the levels the indicator generates, but use it to help identify SQ9 levels that may form market turns. As P. Mikula mentions in his work, "The Square of Nine successfully defines market price swings but it does not make the market form pivots."
This indicator includes enhancements made to the Gann Square of Nine indicator originally created by @ThiagoSchmitz.
This indicator is inspired by the methodologies detailed by Patrick Mikula in his book " The Definitive Guide to Forecasting using W.D Gann's Square of Nine ." I recommend checking it out. He also mentions another use case as a Price and Time chart in his " Gann Scientific Method Unveiled, Volume 2 ." FYI, I am not affiliated with Patrick Mikula in any way.
Known Issues:
Close price plotted on the Square of Nine in Regression "from a high pivot" takes a current candle to close in order to be plotted. Progression works as expected.

Gann Square 9 Price Line Helper (Experimental)This indicator was intended as educational purpose only for Gann Square 9, specifically to show Cross and Cross Cardinal.
This indicator was build upon The Tunnel Thru The Air Or Looking Back From 1940, written by WD Gann .
Values shown is theoretical for basic understanding and may not represent actual market trend.
This pine script for educational purpose as basic understanding only, not recommend for actual trade and use at your on risk.
Indicator features :
1. Font size for table from tiny to huge.
2. Table can change position or hide.
2. For desktop display only, not for mobile.
3. All values can be selected individually or group to display individual or group lines and labels.
FAQ
1. Credits
WD Gann , The Tunnel Thru The Air Or Looking Back From 1940
2. Page involved
195 - 198
3. Code Usage
Free to use for personal usage.

Double Numbered Triangle Chart Progression | RegressionThe Double-Numbered Triangle Progression | Regression Indicator enables forecasting of support and resistance levels by progressing or regressing on the Triangle Chart from a user-selected pivot price. The indicator also plots adjustable pivots on both the chart and the Triangle Price and Time Chart.
How to use to forecast support and resistance levels:
1. Select a Pivot Point: Set the correct price to the pivot by selecting High or Low in the indicator.
2. Set Price Increment: Choose a price increment to adjust the starting price on the Triangle Chart (e.g., 1 or -0.01).
3. Rotate to adjust the number of levels on the Triangle Chart.
4. Plot Levels: Choose the Left Edge, Center, or Right Edge of the Triangle Chart to plot support and resistance levels. These levels automatically expand or decrease depending on the number of levels in step 3. The selected angle's price values are applied to the chart with labels on both sides. The left labels represent the time variable, and the right labels indicate the price. The time variable is used in conjunction with my other indicator "Price and Longitude Angles." The same goes for the Double Numbered Square of Nine indicator.
5. Review Levels: Examine the plotted support and resistance levels with recent market pivots.
6. Identify Correlations: Find the Triangle edge or center that aligns with the most market pivots.
7. The indicator plots user-adjustable pivots on both candles/bars and shows their placement on the Triangle Chart in both Progression and Regression. This visualization helps users identify which angles the highs and lows favor from the selected pivot. Pivot levels' colors can be customized. The close price is plotted on the Triangle Chart in real time with a white background.
Each market has its tendencies, favoring specific angles from the Triangle Chart. The basic idea is to choose between the Left edge, Center, or Right edge of the Triangle to forecast support and resistance levels.
Settings:
Overview:
Example of Forecasting Support and resistance level using this indicator:
In the image above, I am regressing from the significant high at a rate of $-0.008 per cell as shown on the main info label. Based on the plotted pivots, I have chosen the right edge of the triangle as it aligns with these recent pivots. I have drawn a lime green vertical line to indicate that as we add layers to the triangle chart, we introduce support and resistance levels based on the identified angle that aligns with these early pivots from the high.
In the image below, I've moved forward in time to illustrate how the initial angle chosen based on the early pivots forecasted support and resistance levels on $DOGE. Do not expect the price to turn sharply at the levels the indicator generates. As P. Mikula mentions in his work, and I apply the same with the Triangle Chart, " The Square of Nine successfully defines market price swings but does not cause the market to form pivots. "
This indicator is inspired by the methodologies detailed by Patrick Mikula in his book, The Definitive Guide to Forecasting using W.D Gann's Square of Nine. I recommend checking it out. He also mentions another use case as a Triangle Price and Time chart in his book, Gann Scientific Method Unveiled, Volume 2, where you can use my open-source indicator "Price and Longitude Angle" alongside both the Doubled Numbered Square of Nine and this Triangle Chart indicator.
FYI, I am not affiliated with Patrick Mikula in any way.
Planned improvements include adding two more angles: Left Center column and Right Center column as additional options to select.
FYI: Please ensure you select the high when regressing from a high. Also, make sure to add enough layers on the Triangle to see all the pivots. Once you've identified an angle, you can hide the table to gain back space on the chart. Use rounding precision for lower prices.

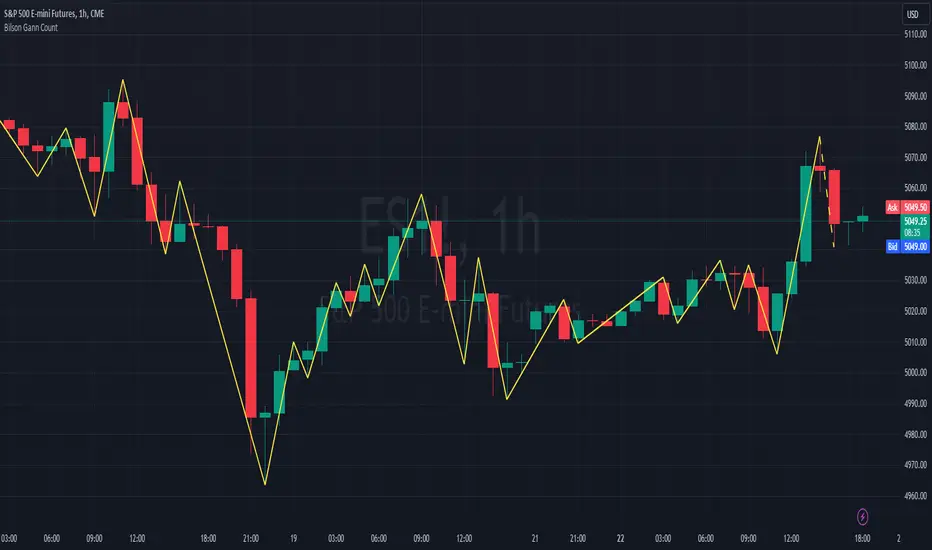
Bilson Gann CountGann counting is a method for identifying swing points,trends, and overall market structure. It simplifies price action by drawing short trend lines that summarize moves.
There's essentially 4 types of bar/candle.
Up bar - Higher high and higher low than previous bar
Down bar - Lower high and lower low than previous bar
Inside bar - Lower high and higher low than previous bar
Outside bar - Higher high and lower low than previous bar
We use these determinations to decide how the trendline moves through the candles.
Up bars we join to the high, down bars we join to the low, inside bars are ignored.
There are other indicators that already exist which do this, the difference here is how we handle outside bars.
Other gann counting methods skip outside bars, this method determines how to handle the outside bar after the outside bar is broken.
examples
UP -> OUTSIDE -> UP = Outside bar treated as swing low
UP -> OUTSIDE -> DOWN = Outside bar treated as swing high
DOWN -> OUTSIDE -> UP = Outside bar treated as swing low
DOWN -> OUTSIDE -> DOWN = Outside bar treated as swing high
Gann's square of 9 overextended indicatorThis indicator is inspired by the book “The Definitive Guide to Forecasting Using W.D. Gann’s Square of Nine”. It’s designed to identify overextended price levels in the market.
The indicator uses the concept of Gann’s Square of 9, which is a method for forecasting price movements by observing geometric relationships between price and time. It calculates the square root of the price, then subtracts the square root of a simple moving average of the price. The difference is then converted to degrees to create the indicator values.
The indicator plots four horizontal lines, representing two upper and two lower thresholds. When the indicator crosses these lines, it suggests that the price may be overextended and a reversal could be imminent.
Please note that the Price Multiplier parameter needs to be adjusted for each timeframe and security to ensure accurate results. This is because different securities and timeframes can have different price scales, and the multiplier helps to normalize the price data for the calculation.
The indicator also includes a Moving Average Size parameter, which determines the length of the simple moving average used in the calculation.
This indicator can be a useful tool for traders looking to identify potential reversal points in the market. However, like all indicators, it should be used in conjunction with other forms of analysis and it’s not recommended to rely solely on this indicator for trading decisions.


Gann CalculatorThis indicator plots gann levels.
Go to settings and enter the latest gann level.
Enjoy..

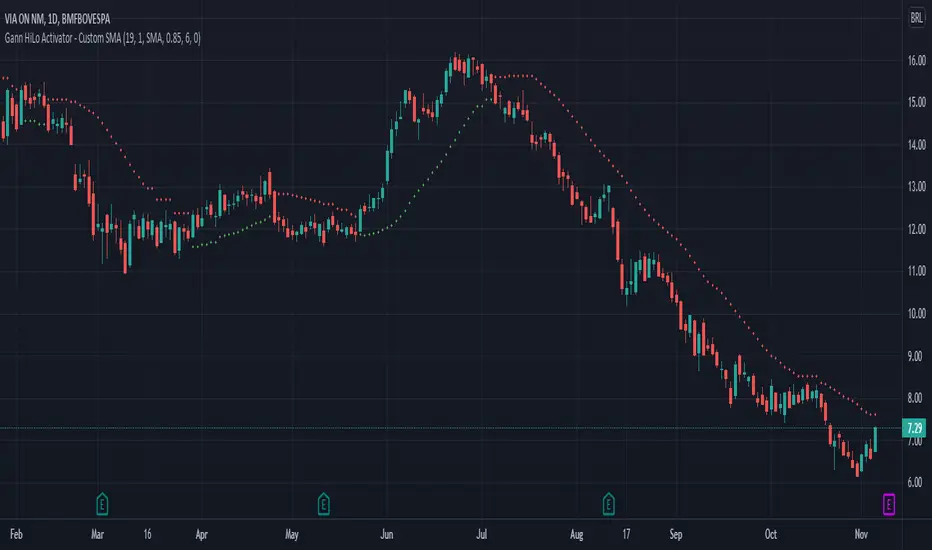
Gann HiLo Activator Strategy█ OVERVIEW
Strategy based on the Gann Hilo Activator . This is a trend following strategy, which means it will go long (and close the previous short position) once the price closes above the high SMA, and go short (and close the previous long position) once the price closes below the low SMA.
█ PARAMETERS
- Length
- Displace (or offset): default is 1
- Begin from start: strategy will run since the beggining
- From year, month, day: Choose an specific date to start backtesting (must disable the parameter above to work)
█ HOW TO USE
After choosing the start date to run the strategy, you can change the length field and look at the backtest results to find the most optimal settings for the current symbol.
This strategy was tested on the stock and crypto market with good results. Hope you enjoy!
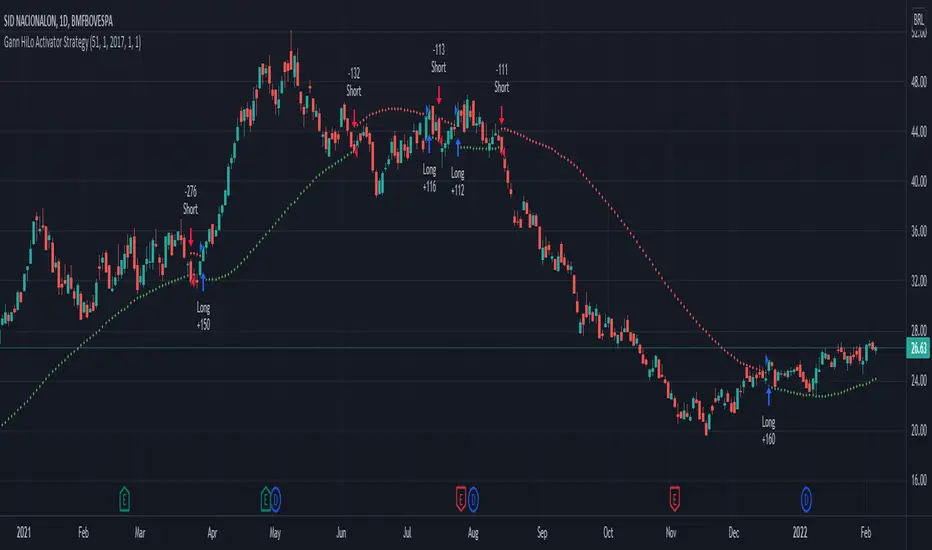
Gann HiLo ActivatorThe HiLo Activator study is a trend-following indicator introduced as part of the Gann Swing trading strategy. In addition to indicating the current trend direction, this can be used as both entry signal and trailing stop.
There are many scripts already published for this indicator, but I've found they didn't match the original one.
So here it is the Gann HiLo Activator as originally developed by Robert Krausz, in a 1998 article in the Stocks & Commodities magazine.
I've also added the option to select the type of Moving Average you would like to use.
Hope you enjoy!
Gann Fan Analysis v 3.0The openness of this community is amazing and I have gained a lot from being a member. Hopefully you think this is useful so I can give something back.
This indicator constructs a reference framework of Support and Resistance levels based on Gann Fan ratios. Two fans are created: Support or Bullish fan, and a Resistance or Bearish fan. The origin of the analysis is the lowest pivot in the analysis window set by the length input. The upper bound of the analysis is the highest pivot in the analysis window. This is the only user input that affects the fan calculation. The remaining user input controls the visualization of the fans. The fan calculations are updated as the high and low within the analysis window change. The resistance fan range is based on an assumed 70% retracement.
Indicator also highlights the active Support and Resistance lines of each fan. An alert is also included, based on the price crossing one of these active levels.
Currently I can't figure out how to get the analysis to extend beyond 278 or so bars (not sure what the limitation is) so it isn't really useful for intraday timeframes, but it is reliable on daily and above. I use it on a Weekly view with the analysis length set to 52, and on a daily timeframe with the length set to 260.
I included fractal visualization using Ricardo Santos' Fractals v9 script as a means of confirming the Gann Fan pivots. The two methods seems to correlate well, in my opinion.
The coding is terrible, I'm sure, so please overlook that as this my first complex effort. I'm a total amateur!
Gann ProgressionsThis is my attempt at progressions along the Gann wheel. Theoretically this script advances a numeral 45 degrees along the square of nine. The degree chosen (negative for bearish projections) can of course be customized and further subdivided as per your needs, but there is a slight flaw in the calculations that I am asking the community to take a look at, hopefully you all can give me a hand here. While the majority of the figures are correct, there seems to be some very slight discrepancies in the prices projected. If you are a Gann user, then you know how accurate they can be and as such, the discrepancies are not tolerable. Take a peek and let me know what you see that I am missing. Hope this script becomes helpful for all users.
Gann Square (Weekly) + Auto-Fit Helper v6Helps show best fit for the Gann Square on the weekly log scale chart
