All-in-One SMC: CHOCH | BOS | FVG | OB | LiquidityThis script combines:
BOS (Break of Structure)
CHOCH (Change of Character)
Bullish & Bearish FVGs
Mitigation Order Blocks
Liquidity grabs (equal highs/lows)
Discount / Premium zones (relative to equilibrium)
ค้นหาในสคริปต์สำหรับ "fvg"

eBacktesting - Learning: PD ArrayseBacktesting - Learning: PD Arrays helps you practice one of the most important “Smart Money” ideas: price tends to react from specific delivery areas (PD Arrays) like Imbalances (FVGs), Order Blocks, and Breakers.
Use this to train your eyes to:
- Spot where an imbalance/OB is created (often after displacement)
- Wait for price to return into that area
- Study the reaction (hold, reject, or slice through) and what that implies next
These indicators are built to pair perfectly with the eBacktesting extension, where traders can practice these concepts step-by-step. Backtesting concepts visually like this is one of the fastest ways to learn, build confidence, and improve trading performance.
Educational use only. Not financial advice.

Unified Field: Clean FVG + Session POCCombines FVG with POC. one can combine SMC with Order Flow Strategies for better confluence.

ICT Liquidity + BOS + FVG + Entries (NY)ICT Liquidity + BOS + FVG + Entries (NY Session)
This indicator is designed for ICT / Smart Money Concepts traders, focusing on high-probability New York session setups, especially for Gold (XAUUSD) on lower timeframes like M5.
It automates the classic ICT execution model:
Liquidity → Break of Structure → Fair Value Gap → Entry

ICT CISD+FVG+OBThis script is a high-performance ICT suite designed for traders who want a professional, "noise-free" chart. It identifies core institutional patterns—Order Blocks, Fair Value Gaps, and Changes in State of Delivery (CISD)—across multiple timeframes.
The script features a proprietary Proximity Cleanup Engine that automatically deletes old or broken levels, keeping your workspace focused only on price action that is currently tradeable. It strictly follows directional delivery rules for CISD and includes a 50-candle "freshness" limit to ensure you never have to manually clear old data from your past bars.
Core Features
Intelligent CISD: Only triggers Bullish CISD on green candles and Bearish CISD on red candles.
Proximity Filter: Automatically wipes away any levels that are "miles away" from the current price.
Clean Workspace: Removes broken session highs/lows and mitigated zones instantly.
Full Customization: Toggle visibility and colors for every component via the settings menu.

ICT Visible Center-Label CISD & FVGsThis indicator provides a clean, institutional-grade view of market shifts and liquidity gaps, specifically optimized for ICT (Inner Circle Trader) concepts.
Core Components
CISD (+/-): Identifies a "Change in State of Delivery." A (+) indicates a bullish shift, while a (-) indicates a bearish shift. These appear as fixed black lines with labels that delete automatically once price breaches the level.
Multi-Timeframe FVGs: Automatically plots Fair Value Gaps from the 5m, 15m, 1H, and 4H timeframes simultaneously.
Center-Locked Labels: Timeframe labels (e.g., "1H") are centered within the gaps, making them easy to identify without scrolling back through price history.
Auto-Cleaning Logic: To keep your chart clutter-free, gaps and CISD levels are instantly removed from the screen the moment they are mitigated (filled) by price.

ICT FVG MNQ (Fixed Stop + Multi-TP Toggles)use- 18 min timeframe.
ICT FVG - use on MNQ 18 min time frame.
it has muti TP levels.-
Prop firm compatible.
Enjoy trading

Smart Gap Concepts [MarkitTick]💡 This indicator automates the identification and classification of price gaps, commonly known as Fair Value Gaps (FVG) or Imbalances, by integrating market structure and volume analysis. Unlike standard gap detectors that simply highlight empty space on a chart, this script applies algorithmic filters to categorize gaps into three distinct phases of market movement: Breakaway, Runaway, and Exhaustion. This helps traders understand the potential context of a move rather than just seeing a support or resistance zone.
● Originality and Utility
The primary innovation of this tool is its dynamic classification system. It moves beyond visual detection by checking the "why" behind the gap. By referencing Swing Highs and Swing Lows (Market Structure) alongside Volume efficiency, it determines if a gap represents a breakout, a trend continuation, or a climatic end to a move. Additionally, the script features an automated mitigation tracking system that removes gaps from the chart once price has re-tested the midpoint, ensuring the visual workspace remains clean and relevant to current price action.
● Methodology
The script operates on a multi-stage logic engine:
• Gap Detection
It first identifies the core imbalance where the Low of the current bar does not overlap with the High of the bar two periods prior (for bullish gaps), ensuring the intervening candle represents a strong displacement.
• Structural Analysis (Breakaway Gaps)
The script monitors Pivot Highs and Lows. If a gap occurs simultaneously with a close beyond a key structural Pivot, it is classified as a "Breakaway Gap." This signals the potential start of a new trend.
• Volume and Time Analysis (Exhaustion Gaps)
To identify potential reversals, the script looks for "Trend Maturity." If a gap forms after a long duration since the last pivot and is accompanied by a volume spike (defined by the Volume Spike Multiplier), it is labeled as an "Exhaustion Gap."
• Continuation (Runaway Gaps)
If a gap is valid but meets neither the Breakaway nor Exhaustion criteria, it is considered a "Runaway Gap," typically found in the middle of an established trend.
• Dynamic Cleanup
The script tracks the midpoint of every active gap. If price creates a lower low (for bullish gaps) or higher high (for bearish gaps) beyond this midpoint, the gap is considered mitigated and is removed from the screen.
📖 How to Use
Traders can utilize the color-coded classifications to gauge market intent:
Breakaway (Default Blue): Watch these zones for potential trend initiations. These are often high-probability areas for a retest entry after a structure break.
Runaway (Default Orange): These indicate strong momentum. They can be used to trail stop-losses or add to winning positions, as price should ideally not close below these gaps in a healthy trend.
Exhaustion (Default Red): Be cautious when these appear. They suggest the current move is overextended and a reversal or complex pullback may be imminent.
• Exhaustion Gap : A Practical Case Study
• Breakaway Gap: A Practical Case Study
• Runaway Gap : A Practical Case Study
⚙️ Inputs and Settings
Min Gap Size (Points): Filters out insignificant gaps smaller than this threshold.
Structure Lookback: Defines the sensitivity of the Pivot detection (Swing High/Low).
Volume Avg Length & Multiplier: Determines what qualifies as a "Volume Spike" for exhaustion logic.
Trend Maturity: The minimum number of bars required to consider a trend "old" enough for an exhaustion signal.
Visual Settings: Custom colors for each gap type and box extension length.
● Disclaimer
All provided scripts and indicators are strictly for educational exploration and must not be interpreted as financial advice or a recommendation to execute trades. I expressly disclaim all liability for any financial losses or damages that may result, directly or indirectly, from the reliance on or application of these tools. Market participation carries inherent risk where past performance never guarantees future returns, leaving all investment decisions and due diligence solely at your own discretion.


Đại Ka 3 ATR BandsĐại Ka 3 ATR Bands – The ultimate single-slot indicator that replaces three separate ATR plots.
Designed specifically for ICT/SMC traders in 2025:
• Light red band (±0.5 ATR) → fake moves, Judas Swing, Turtle Soup zone
• Gray band (±1.0 ATR) → normal price action
• Light green band (±2.0 ATR) → real displacement zone → Silver Bullet, SFT, high-probability entries
How to use:
– Price stuck inside red band → expect reversal/fakeout
– Price breaks and closes outside green band + volume spike → enter aggressively in that direction (85%+ win-rate inside Killzones)
Default ATR(14), subtle fills for instant visual filtering of real vs fake moves.
Perfect companion for Order Blocks, FVG, Breaker Blocks and NY/London Killzones.
Free forever – coded with love by Đại Ka & Vietnamese ICT crew.


Smart Money Concepts Pro – OB, FVG, Liquidity + Trade SetupsThis script is a complete Smart Money Concepts (SMC) toolkit designed for traders who want clean and actionable charts without clutter.
It combines the most important institutional concepts into one indicator:
Order Blocks (OB): auto-detection of bullish and bearish order blocks with mitigation tracking, merging and TTL (time-to-live).
Fair Value Gaps (FVG): automatic gap recognition with size filters, mitigation tracking and lifetime control.
Liquidity Pools (EQH/EQL): equal highs and equal lows marked with tolerance (ATR-based or fixed).
Break of Structure (BOS): up/down structure shifts plotted directly on the chart.
Multi-Timeframe (HTF): option to use higher timeframe data (e.g. H4, Daily) for stronger zones.
Trend Filter: show zones only in the direction of market structure.
Trade Setups: automatic signals for OB Retest + Trend setups, with entry, stop-loss and take-profit levels (custom R-R).
Flexible Zone Extension: choose between extending zones to the live bar or fixed box width for a cleaner look when scrolling.
Features
Fully customizable (pivot length, ATR filters, box width, TTL, zone colors)
Separate presets for Scalping, Intraday, Swing trading styles
Visual trade planning with entry/SL/TP lines and optional labels
Works across all markets (crypto, forex, indices, stocks)
How to use
Bias: identify overall direction (BOS + HTF zones).
Wait: for price to return to an unmitigated OB or FVG.
Entry: take the setup signal (OB retest + trend filter).
Risk: stop-loss at opposite OB boundary.
Target: TP based on chosen R-R multiple (default 2R).
⚡ Whether you scalp short-term moves or swing trade HTF zones, this indicator gives you a clear institutional edge in spotting supply/demand imbalances and high-probability setups.

Multi-Timeframe FVG Detector v2 STEWNewest FVG with alerts and ability to show current TimeFrame Viewed

Liquidity + FVG + OB Markings (Fixed v6)This indicator is built for price-action traders.
It automatically finds and plots three key structures on your chart:
Liquidity Levels – swing highs & lows that often get targeted by price.
Fair-Value Gaps (FVG) – inefficient price gaps between candles.
Order-Blocks (OB) – zones created by strong, high-volume impulsive candles.
It also provides alerts and a small information table so you can quickly gauge the current market context.

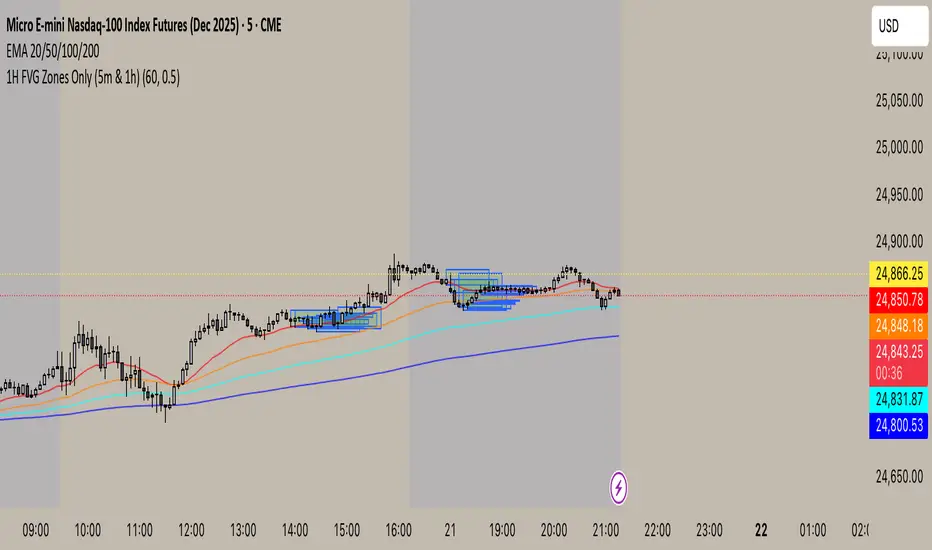
1H FVG Zones Only (5m & 1h)new uses trend anaylosis. takes 15 min chart and breaks into 1hr chart fvg gaps
BSL/SSL Sweep + FVG Strategy Jobin (c) The New York ATM Model is a structured intraday strategy designed to capture algorithmic stop-hunts and reversals during the New York session open. It focuses on liquidity sweeps—either Buy-Side or Sell-Side—followed by a confirmation using Fair Value Gaps (FVGs).

ICT Largest Midnight–00:30 FVG (NY, 1 per day) — FIXEDmarks out the first and largest fvg on the 1 min chart from midnight open until 12:30 am est

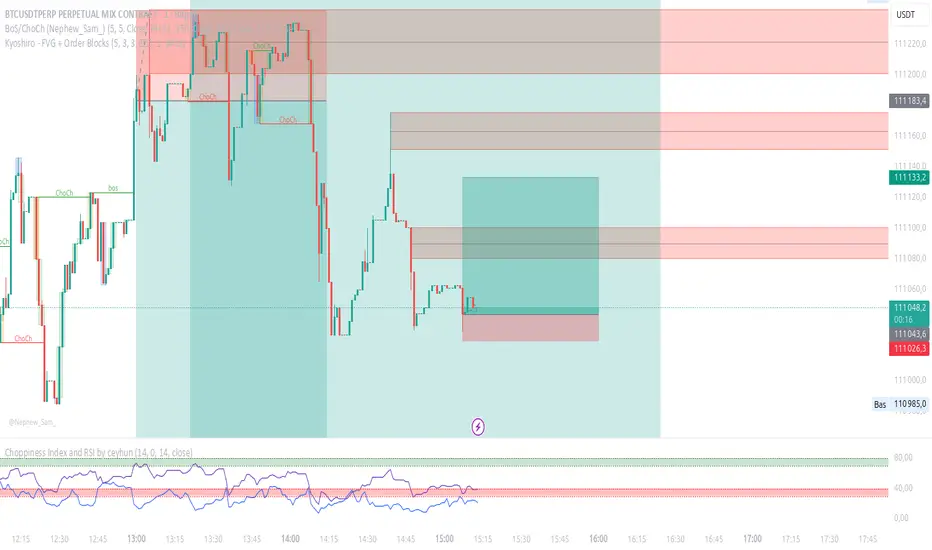
Kyoshiro - FVG + Order Blocks📌 Kyoshiro – FVG + Order Blocks
This indicator combines Order Block (OB) detection with an intelligent auto-management system and a clean visual display on the chart.
It is designed to help traders better identify institutional zones where price frequently reacts.
⚙️ Key Features:
✅ Real-time detection of bullish and bearish Order Blocks.
✅ Automatic cleanup: invalidated OBs are removed to keep the chart clean.
✅ Customizable display:
Maximum number of visible OBs (bullish / bearish).
Zone colors, outlines, and midlines.
Line styles (solid, dashed, dotted) and adjustable width.
✅ Choice of mitigation method:
Wick
Close
✅ Built-in alerts:
Formation of bullish or bearish OB.
Mitigation of an existing OB.
🔔 Available Alerts:
Bullish OB Formed → A bullish order block is detected.
Bearish OB Formed → A bearish order block is detected.
Bullish OB Mitigated → A bullish OB has been invalidated.
Bearish OB Mitigated → A bearish OB has been invalidated.
🎯 Use Cases:
Quickly identify key liquidity zones.
Track institutional activity in the market.
Improve entry and exit precision.
Molina Prob-Score + FVG + S/R (v1.2)it computes a weighted bull/bear score (0–100%), highlights ICT-style FVGs, marks pivot S/R, and gives simple entry flags. tune the weights to your style.

Smart Money Footprint & Cost Basis Engine [AlgoPoint]Smart Money Footprint & Cost Basis Engine
This indicator is a comprehensive market analysis tool designed to identify the "footprints" of Smart Money (institutions, whales) and pinpoint high-probability reaction zones. Instead of relying on lagging averages, this engine analyzes the very structure of the market to find where large players have shown their hand.
How It Works: The Core Logic
The indicator operates on a multi-stage confirmation process to identify and validate Smart Money zones:
Smart Money Detection (The Trigger): The engine first scans the chart for signs of intense, urgent buying or selling. It does this by identifying Fair Value Gaps (FVGs) created by large, high-volume Displacement Candles. This is our initial Point of Interest (POI).
Cost Basis Calculation (The Average Price): Once a potential Smart Money move is detected, the indicator calculates the Volume-Weighted Average Price (VWAP) for that specific move. This gives us a highly accurate estimate of the average price at which the large players entered their positions.
Historical Confirmation (The "Memory"): This is the indicator's most unique feature. It checks its historical database to see if a similar Smart Money move (in the same direction) has occurred in the same price area in the past. If a match is found, the zone's significance is confirmed.
Verified Cost Basis Zone (The Final Output): A zone that passes all the above checks is drawn on the chart as a high-probability Verified Cost Basis Zone. These are the "memory zones" where the market is likely to react upon a re-visit.
How to Use This Indicator
Cost Basis Zones (The Boxes):
Green Boxes: Bullish zones where Smart Money likely accumulated positions. When the price returns here, a BUY reaction is expected.
Red Boxes: Bearish zones where Smart Money likely distributed positions. When the price returns here, a SELL reaction is expected.
Zone Strength (★★★): Each zone is created with a star rating. More stars indicate a higher-confidence zone (based on factors like volume intensity and historical confirmation).
BUY/SELL Signals: A signal is only generated when the price enters a zone AND the confirmation filters (if enabled in the settings) are passed.
Zone Statuses:
Green/Red: Active and waiting to be tested.
Gray: The zone has been tested, and a signal was produced.
Dark Gray (Invalidated): The zone was broken decisively and is no longer considered valid support/resistance.
Key Settings
Signal Accuracy Filters: You can enable/disable three powerful filters to balance signal quantity and quality:
Momentum Confirmation (Stoch): Waits for momentum to align with the zone's direction.
Candlestick Confirmation (Engulfing): Waits for a strong reversal candle inside the zone.
Lower Timeframe MSS Confirmation: The most advanced filter; waits for a trend shift on a lower timeframe before giving a signal.
Historical Confirmation:
Require Historical Confirmation: Toggle the "Memory" feature on/off. Turn it off to see all potential SM zones.
Tolerance Calculation Method: Choose between a dynamic ATR Multiplier (recommended for all-around use) or a fixed Percentage to define the zone size.

OB/FVG Precision Overlap ZonesThis indicator highlights only the zones where Order Blocks (OBs) and Fair Value Gaps (FVGs) overlap, filtering out weaker signals. By focusing on these confluence areas, it helps identify higher-probability entries and cleaner risk to reward setups.