Hull Moving Average Adaptive RSI (Ehlers)Hull Moving Average Adaptive RSI (Ehlers)
The Hull Moving Average Adaptive RSI (Ehlers) is an enhanced trend-following indicator designed to provide a smooth and responsive view of price movement while incorporating an additional momentum-based analysis using the Adaptive RSI.
Principle and Advantages of the Hull Moving Average:
- The Hull Moving Average (HMA) is known for its ability to track price action with minimal lag while maintaining a smooth curve.
- Unlike traditional moving averages, the HMA significantly reduces noise and responds faster to market trends, making it highly effective for detecting trend direction and changes.
- It achieves this by applying a weighted moving average calculation that emphasizes recent price movements while smoothing out fluctuations.
Why the Adaptive RSI Was Added:
- The core HMA line remains the foundation of the indicator, but an additional analysis using the Adaptive RSI has been integrated to provide more meaningful insights into momentum shifts.
- The Adaptive RSI is a modified version of the traditional Relative Strength Index that dynamically adjusts its sensitivity based on market volatility.
- By incorporating the Adaptive RSI, the HMA visually represents whether momentum is strengthening or weakening, offering a complementary layer of analysis.
How the Adaptive RSI Influences the Indicator:
- High Adaptive RSI (above 65): The market may be overbought, or bullish momentum could be fading. The HMA turns shades of red, signaling a possible exhaustion phase or potential reversals.
- Neutral Adaptive RSI (around 50): The market is in a balanced state, meaning neither buyers nor sellers are in clear control. The HMA takes on grayish tones to indicate this consolidation.
- Low Adaptive RSI (below 35): The market may be oversold, or bearish momentum could be weakening. The HMA shifts to shades of blue, highlighting potential recovery zones or trend slowdowns.
Why This Combination is Powerful:
- While the HMA excels in tracking trends and reducing lag, it does not provide information about momentum strength on its own.
- The Adaptive RSI bridges this gap by adding a clear visual layer that helps traders assess whether a trend is likely to continue, consolidate, or reverse.
- This makes the indicator particularly useful for spotting trend exhaustion and confirming momentum shifts in real-time.
Best Use Cases:
- Works effectively on timeframes from 1 hour (1H) to 1 day (1D), making it suitable for swing trading and position trading.
- Particularly useful for trading indices (SPY), stocks, forex, and cryptocurrencies, where momentum shifts are frequent.
- Helps identify not just trend direction but also whether that trend is gaining or losing strength.
Recommended Complementary Indicators:
- Adaptive Trend Finder: Helps identify the dominant long-term trend.
- Williams Fractals Ultimate: Provides key reversal points to validate trend shifts.
- RVOL (Relative Volume): Confirms significant moves based on volume strength.
This enhanced HMA with Adaptive RSI provides a powerful, intuitive visual tool that makes trend analysis and momentum interpretation more effective and efficient.
This indicator is for educational and informational purposes only. It should not be considered financial advice or a guarantee of performance. Always conduct your own research and use proper risk management when trading. Past performance does not guarantee future results.
ค้นหาในสคริปต์สำหรับ "fractals"

BB ATR Fractal MMThe Bollinger Bands + ATR with Fractal indicator is a powerful combination of Bollinger Bands, ATR (Average True Range), and Fractal to help identify market volatility and potential entry/exit points on the chart.
Bollinger Bands help to assess the market’s volatility by calculating upper and lower bands based on the simple moving average (SMA) and standard deviation. It’s an excellent tool for identifying overbought and oversold conditions.
ATR (Average True Range) is used to measure market volatility. It helps determine how much the price is moving, and it can be used to adjust the Bollinger Bands, creating bands that reflect the current volatility more accurately.
Fractal helps to identify peaks and troughs in the market, supporting decision-making by highlighting potential reversal points. Fractals mark regions where price may reverse direction, making it easier to spot possible trade opportunities.
How to Use:
Bollinger Bands Upper and Lower Bands: These bands help to identify overbought or oversold conditions. If the price breaks above the upper band, the market may be overbought. If the price breaks below the lower band, the market may be oversold.
ATR: It indicates the volatility level of the market. When the market shows large volatility (ATR increases), the Bollinger Bands expand to reflect higher price swings.
Fractal: Arrows appear at the market’s peaks and troughs, helping identify entry points for buying (at fractal lows) or selling (at fractal highs). These signals can help you make trading decisions based on potential price reversals.

Adaptive Fractal Grid Scalping StrategyThis Pine Script v6 component implements an "Adaptive Fractal Grid Scalping Strategy" with an added volatility threshold feature.
Here's how it works:
Fractal Break Detection: Uses ta.pivothigh and ta.pivotlow to identify local highs and lows.
Volatility Clustering: Measures volatility using the Average True Range (ATR).
Adaptive Grid Levels: Dynamically adjusts grid levels based on ATR and user-defined multipliers.
Directional Bias Filter: Uses a Simple Moving Average (SMA) to determine trend direction.
Volatility Threshold: Introduces a new input to specify a minimum ATR value required to activate the strategy.
Trade Execution Logic: Places limit orders at grid levels based on trend direction and fractal levels, but only when ATR exceeds the volatility threshold.
Profit-Taking and Stop-Loss: Implements profit-taking at grid levels and a trailing stop-loss based on ATR.
How to Use
Inputs: Customize the ATR length, SMA length, grid multipliers, trailing stop multiplier, and volatility threshold through the input settings.
Visuals: The script plots fractal points and grid levels on the chart for easy visualization.
Trade Signals: The strategy automatically places buy/sell orders based on the detected fractals, trend direction, and volatility threshold.
Profit and Risk Management: The script includes logic for taking profits and setting stop-loss levels to manage trades effectively.
This strategy is designed to capitalize on micro-movements during high volatility and avoid overtrading during low-volatility trends. Adjust the input parameters to suit your trading style and market conditions.

Awesome_Accelerator_Zone OscillatorExplanation and Usage Guide for AO_AC_ZONE Oscillator
Indicator Overview
The **AO_AC_ZONE** oscillator is based on the concepts introduced by **Bill Williams** in his book *New Trading Dimensions*. This indicator combines the **Awesome Oscillator (AO)**, **Accelerator Oscillator (AC)**, and a custom **Zone Oscillator**, visualizing them together in a clear, color-coded format.
The Zone Oscillator is derived from the relationship between AO and AC, indicating the market's dominant momentum state (bullish, bearish, or neutral). It also integrates real-time candle coloring to visually align price bars with the Zone's momentum.
---
**Components**
1. **Awesome Oscillator (AO)**:
- AO measures the difference between a 5-period and 34-period Simple Moving Average (SMA) applied to the midpoints of candles.
- It reflects market momentum, where:
- Green bars = increasing momentum
- Red bars = decreasing momentum
2. **Accelerator Oscillator (AC)**:
- AC is calculated as the difference between AO and its 5-period SMA.
- It indicates the acceleration or deceleration of market momentum.
- Fuchsia bars = increasing momentum
- Purple bars = decreasing momentum
3. **Zone Oscillator**:
- The Zone combines AO and AC states:
- **Green Zone**: Both AO and AC are positive (bullish momentum).
- **Red Zone**: Both AO and AC are negative (bearish momentum).
- **Gray Zone**: AO and AC have differing signs (neutral/uncertain momentum).
- Candle colors dynamically match the Zone’s state for enhanced visual clarity.
---
**How to Use the Indicator**
**1. Interpreting the Oscillators**
- **AO**: Use it to detect momentum direction and changes. Pay attention to shifts in bar color:
- **Increasing AO (Aqua)**: Bullish momentum gaining strength.
- **Decreasing AO (Navy)**: Bullish momentum weakening or bearish momentum strengthening.
- **AC**: Provides early signals of momentum shifts.
- If AC changes color ahead of AO, it signals potential trend reversals or accelerations.
**2. Using the Zone Oscillator**
- **Green Zone**:
- Both AO and AC are positive.
- Indicates a strong bullish trend. Look for buying opportunities in line with the trend.
- **Red Zone**:
- Both AO and AC are negative.
- Signals strong bearish momentum. Look for shorting opportunities.
- **Gray Zone**:
- AO and AC are in conflict.
- Represents uncertainty; avoid trading or wait for a clear signal.
---
**Real-Time Application**
**Candle Coloring**
- The indicator modifies candle colors to match the Zone Oscillator's state:
- **Green Candles**: Strong bullish momentum.
- **Red Candles**: Strong bearish momentum.
- **Gray Candles**: Neutral momentum.
**Recommended Strategy (Based on New Trading Dimensions)**:
1. **Identify the Zone**:
- Focus on Green Zones for long entries and Red Zones for short entries.
2. **Look for AO/AC Confirmation**:
- Enter trades in the direction of both AO and AC when they align with the Zone.
- For exits, monitor when AO and AC conflict (Gray Zone).
3. **Use in Combination**:
- Combine this oscillator with fractals or trend indicators to confirm signals.
---
**Benefits**
- Visualizes momentum strength, acceleration, and alignment in one chart.
- Simplifies decision-making by integrating price action with oscillator dynamics.
- Supports faster trade identification and execution by highlighting bullish, bearish, and neutral zones.
---
**Disclaimer**
This indicator is a tool to assist in market analysis. Always incorporate proper risk management and avoid trading during uncertain conditions (Gray Zones). For optimal results, use this oscillator in conjunction with other analysis methods like support/resistance, volume analysis, and trend-following systems.

Potential Upcoming Trend ToolThis Script has the specific use of identifying when and how a new trend may start to take form, rather than focusing on how a trend has already formed on a longer term basis.
This Script is useful on it's own and not in conjunction with another. It works by taking on the most recent price data rather than a long term historical string.
It differs from standard trend following indicators because it's use is far less historical, and more present. It requires less pivot points than normal to be validated as a strong trend.
It works by taking local pivot points and fractals to form its parallel basis. The Trend lines will continually move as more recent price action data appears and the the channel will get thinner, until it is clear a trend has arrived and consolidated.
The idea really is to see a constantly evolving picture of a sudden change in movement, allowing you to have an earlier eye on what is potentially to come.
The faint mid-point line gives a reasonable reading of where you would find yourself halfway within a new trend and will also move inline with the shown trendlines.
This allows you to easily track when sentiment and therefore trends are about to change. It's much more useful on lower timeframes because they will often give the first indication something is changing.
Colours are fully customisable.

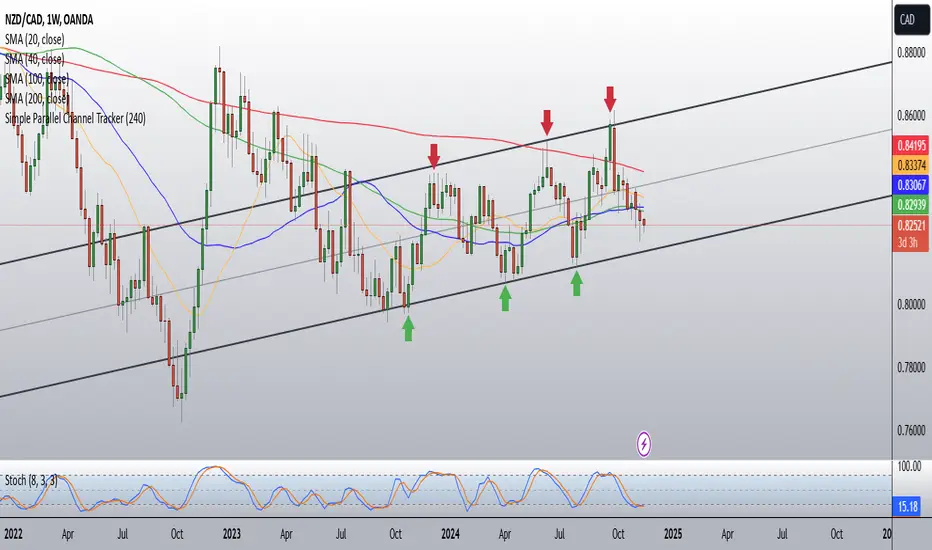
Simple Parallel Channel TrackerThis script will automatically draw price channels with two parallel trends lines, the upper trendline and lower trendline. These lines can be changed in terms of appearance at any time.
The Script takes in fractals from local and historic price action points and connects them over a certain period or amount of candles as inputted by the user. It tracks the most recent highs and lows formed and uses this data to determine where the channel begins.
The Script will decide whether to use the most recent high, or low, depending on what comes first.
Why is this useful?
Often, Traders either have no trend lines on their charts, or they draw them incorrectly. Whichever category a trader falls into, there can only be benefits from having Trend lines and Parallel Channels drawn automatically.
Trends naturally occur in all Markets, all the time. These oscillations when tracked allow for a more reliable following of Markets and management of Market cycles.
Infinity Market Grid -AynetConcept
Imagine viewing the market as a dynamic grid where price, time, and momentum intersect to reveal infinite possibilities. This indicator leverages:
Grid-Based Market Flow: Visualizes price action as a grid with zones for:
Accumulation
Distribution
Breakout Expansion
Volatility Compression
Predictive Dynamic Layers:
Forecasts future price zones using historical volatility and momentum.
Tracks event probabilities like breakout, fakeout, and trend reversals.
Data Science Visuals:
Uses heatmap-style layers, moving waveforms, and price trajectory paths.
Interactive Alerts:
Real-time alerts for high-probability market events.
Marks critical zones for "buy," "sell," or "wait."
Key Features
Market Layers Grid:
Creates dynamic "boxes" around price using fractals and ATR-based volatility.
These boxes show potential future price zones and probabilities.
Volatility and Momentum Waves:
Overlay volatility oscillators and momentum bands for directional context.
Dynamic Heatmap Zones:
Colors the chart dynamically based on breakout probabilities and risk.
Price Path Prediction:
Tracks price trajectory as a moving "wave" across the grid.
How It Works
Grid Box Structure:
Upper and lower price levels are based on ATR (volatility) and plotted dynamically.
Dashed green/red lines show the grid for potential price expansion zones.
Heatmap Zones:
Colors the background based on probabilities:
Green: High breakout probability.
Blue: High consolidation probability.
Price Path Prediction:
Forecasts future price movements using momentum.
Plots these as a dynamic "wave" on the chart.
Momentum and Volatility Waves:
Shows the relationship between momentum and volatility as oscillating waves.
Helps identify when momentum exceeds volatility (potential breakouts).
Buy/Sell Signals:
Triggers when price approaches grid edges with strong momentum.
Provides alerts and visual markers.
Why Is It Revolutionary?
Grid and Wave Synergy:
Combines structural price zones (grid boxes) with real-time momentum and volatility waves.
Predictive Analytics:
Uses momentum-based forecasting to visualize what’s next, not just what’s happening.
Dynamic Heatmap:
Creates a living map of breakout/consolidation zones in real-time.
Scalable for Any Market:
Works seamlessly with forex, crypto, and stocks by adjusting the ATR multiplier and box length.
This indicator is not just a tool but a framework for understanding market dynamics at a deeper level. Let me know if you'd like to take it even further — for example, adding machine learning-inspired probability models or multi-timeframe analysis! 🚀
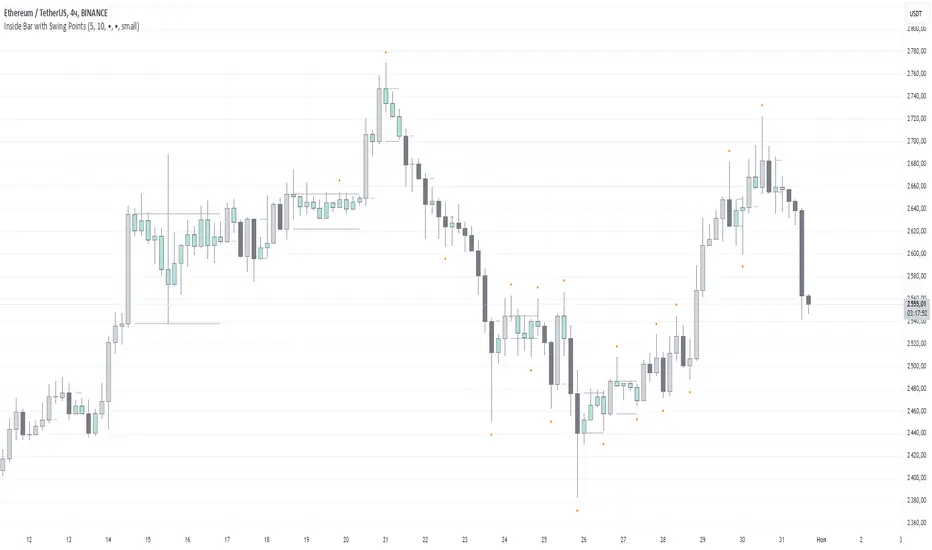
Inside Bar with Swing PointsSwing Points with Inside Bar
This script combines swing point analysis with an inside bar pattern visualization, merging essential concepts to identify and visualize key price levels and potential trend reversals. This is especially useful for traders looking to understand price action through swing levels and reactions within inside bar boundaries, making it effective for short-term trend analysis and reversal zone identification.
Script Features:
Swing Point Analysis:
The script identifies swing points based on fractals with a configurable number of bars, allowing for a choice between three and five bars, helping traders fine-tune sensitivity to price movements.
Swing points are visualized as labels, highlighting potential reversal or continuation zones in the price chart.
Inside Bar Visualization:
Inside bars are defined as bars where both the high and low are contained within the previous bar. These often signal consolidation before a potential breakout.
The script displays boundaries of the mother bar (the initial bar encompassing inside bars) and colors candles accordingly, highlighting those within these boundaries.
This feature helps traders focus on price areas where a breakout or trend shift may occur.
Utility and Application:
The script enables traders to visualize inside bars and swing points, which is particularly useful for short-term traders focused on reversal or trend continuation strategies.
Combining swing point analysis with inside bar identification offers a unique approach, helping traders locate key consolidation zones that may precede significant price moves.
This provides not only strong support and resistance levels but also insights into probable breakout points.
How to Use the Script:
Set the number of bars for swing point analysis (3 or 5) to adjust fractal sensitivity.
Enable mother bar boundary visualization and color indication for inside bars to easily spot consolidation patterns.
Pay attention to areas with multiple swing points and inside bars, as these often signal potential reversal or breakout zones.
This script offers flexible tools for analyzing price movements through both swing analysis and consolidation zone identification, aiding decision-making under uncertainty and enhancing market structure understanding.
Fractal Proximity MA Aligment Scalping StrategyFractal Analysis
Fractals in trading help identify potential reversal points by marking significant price changes. Our strategy calculates a "fractal value" by comparing the current price to recent high and low fractal points. This is done by evaluating the sum of distances from the current closing price to the recent highs and lows. A positive fractal value suggests proximity to recent lows, hinting at upward momentum. Conversely, a negative value indicates closeness to recent highs, signaling potential downward movement.
Moving Averages for Confirmation
We use a series of 20 moving averages ranging from 5 to 100 to confirm trend directions indicated by fractal analysis. An entry signal is considered bullish when shorter-term moving averages are all above a long-term moving average, aligning with a positive fractal value.
Exit Strategy
The strategy employs dynamic stop-loss levels set at various moving averages, allowing for partial exits when the price crosses below specific thresholds. This helps manage the trade by locking in profits gradually. A full exit might be triggered by strong reversal signals suggested by both fractal values and moving average trends.
This open-source strategy is available for the community to test, adapt, and utilize. Your feedback and modifications are welcome as we refine the approach based on collective user experiences.

RSI DeviationAn oscillator which de-trends the Relative Strength Index. Rather, it takes a moving average of RSI and plots it's standard deviation from the MA, similar to a Bollinger %B oscillator. This seams to highlight short term peaks and troughs, Indicating oversold and overbought conditions respectively. It is intended to be used with a Dollar Cost Averaging strategy, but may also be useful for Swing Trading, or Scalping on lower timeframes.
When the line on the oscillator line crosses back into the channel, it signals a trade opportunity.
~ Crossing into the band from the bottom, indicates the end of an oversold condition, signaling a potential reversal. This would be a BUY signal.
~ Crossing into the band from the top, indicates the end of an overbought condition, signaling a potential reversal. This would be a SELL signal.
For ease of use, I've made the oscillator highlight the main chart when Overbought/Oversold conditions are occurring, and place fractals upon reversion to the Band. These repaint as they are calculated at close. The earliest trade would occur upon open of the following day.
I have set the default St. Deviation to be 2, but in my testing I have found 1.5 to be quite reliable. By decreasing the St. Deviation you will increase trade frequency, to a point, at the expense of efficiency.
Cheers
DJSnoWMan06

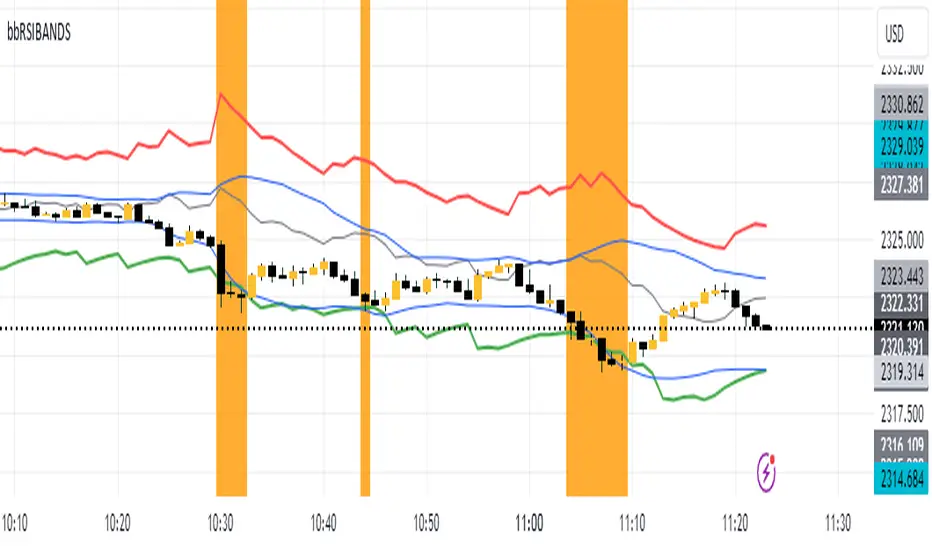
RSIBands with BBThis indicator combines three popular technical analysis tools:
RSI Bands: These bands are based on the Relative Strength Index (RSI) and visually represent overbought and oversold zones. The indicator plots upper and lower bands calculated using a user-defined RSI level and highlights potential buying and selling opportunities near these zones.
Bollinger Bands: These bands depict volatility with a moving average (basis line) and upper and lower bands at a user-defined standard deviation away from the basis line. Narrowing bands suggest potential breakouts, while widening bands indicate increased volatility.
Williams Fractals (with Confirmation): This custom function identifies potential reversal points based on price action patterns. The indicator highlights buy/sell signals when a confirmed fractal forms (previous fractal and price crossing a Bollinger Band).
Key Features:
User-defined parameters: You can adjust the RSI level, Bollinger Band standard deviation, and fractal period according to your trading strategy.
Visual confirmation: The indicator highlights confirmed buy/sell signals based on fractal patterns and price crossing Bollinger Bands.
Flexibility: This indicator provides a combination of trend, volatility, and reversal identification tools, allowing for a multi-faceted approach to technical analysis.
How to Use:
Add the indicator to your chart.
Adjust the RSI level, Bollinger Band standard deviation, and fractal period based on your preference.
Look for buy signals when a green background appears and there's a confirmed up fractal (upward triangle) with the price crossing above the upper Bollinger Band.
Look for sell signals when a red background appears and there's a confirmed down fractal (downward triangle) with the price crossing below the lower Bollinger Band.
Disclaimer:
This indicator is for informational purposes only and should not be considered financial advice. Always conduct your own research and due diligence before making any trading decisions.
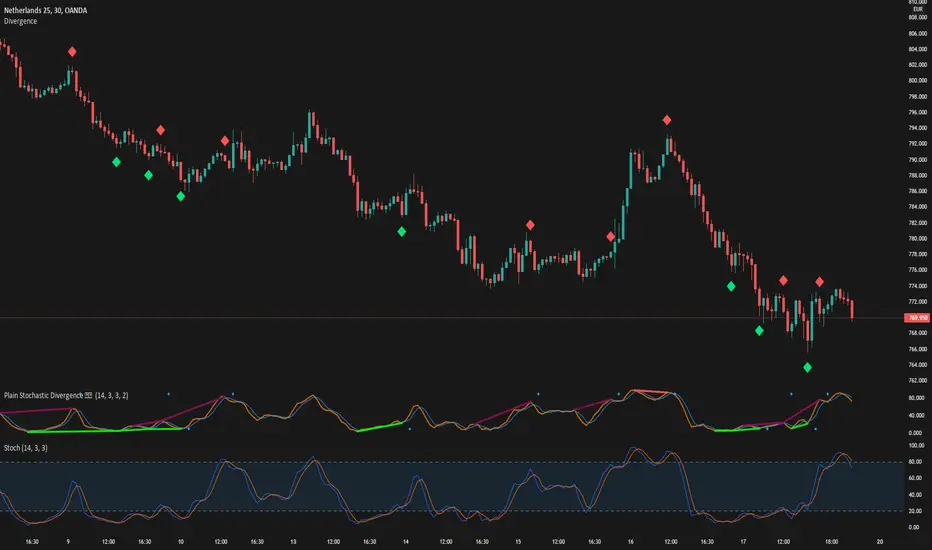
Divergence Signal [TradingFinder] RSI & MACD Reversal On Swing🔵 Introduction
Sometimes in analyzing price charts using indicators, you may observe a discrepancy. For instance, while the price of stocks, currencies, or commodities is increasing, the indicator shows a decrease. Such a phenomenon in technical analysis is termed "divergence." Divergences are categorized into three types based on their formation and the prediction they make about the continuation of the price trend: "Regular Divergence," "Hidden Divergence," and "Time Divergence."
🟣 Important :
• This indicator exclusively identifies regular divergences since its primary function is to detect reversal points.
• This indicator identifies divergences using three indicators: "Moving Average Convergence Divergence" (MACD), "Relative Strength Index" (RSI), and "Awesome Oscillator" (AO). The user can choose each of these indicators in the settings using the "Divergence Detection Method" dropdown menu for identifying divergences. These settings are by default set to the MACD mode.
🔵Types of Divergence
Divergences, as mentioned, offer different predictions about the continuation of price trends. Hence, they have various types. We will focus on explaining regular divergences based on this indicator.
🟣 Regular Divergence(RD) :
Regular divergence is a situation arising from contradictory behavior between the indicator and the price chart at the end of a trend. By identifying regular divergences, we anticipate a change in trend direction resembling a reversal pattern.
Regular divergence has two types based on the trend and prediction:
Negative Regular Divergence (RD-) :
This type occurs between two price peaks at the end of an uptrend. Despite forming a new high, the indicator fails to recognize it, indicating a negative regular divergence. The likelihood of a subsequent downtrend is high. Negative divergence suggests strong selling pressure and weak buying power, portraying an unfavorable future for the stock.
Positive Regular Divergence (RD+) :
In contrast, positive regular divergence happens at the end of a downtrend and between two price troughs. As depicted in the chart, although the price forms a new low, the indicator doesn't acknowledge it. Positive regular divergence indicates robust buying pressure and weak selling power. Upon identifying positive divergence in the chart, we expect a price increase for the stock under review
🔵 How to Use
Information from the indicator is displayed in two ways: Table and Label.
🟣 Table : The table displays information about the latest divergence. This includes the type of divergence, existence or absence of divergence, consecutive divergences, divergence quality, and change in indicator phase.
Type Divergence : Indicates the type of divergence, which can be either "Bullish Divergence" or "Bearish Divergence."
Exist : Indicates the presence of divergence with a "+" sign and absence with a "-" sign. A green color is used for bullish divergence and red for bearish divergence.
Consecutive : Shows the number of consecutive divergences. For example, if there are 3 consecutive divergences, the number 3 is displayed.
Divergence Quality : Displays the quality of the divergence based on the number of consecutive divergences. If there is 1 divergence, the quality is "Normal"; for 2 divergences, it's "Good"; and for 3 or more divergences, it's "Strong."
Change Phase Indicator : Indicates whether a phase change in the indicator has occurred with "+" for yes and "-" for no.
🟣 Label : Unlike the table, which only shows information about the latest divergence, labels display information about each divergence at the point where it occurs. The information includes the type of divergence, detection method, divergence quality, consecutive divergences, and change in phase indicator. The selected method of detection is also displayed. For example, if the chosen method is the "AO" indicator, the label will show "Method: AO."
🔵 Settings
Fractal Period : Determines the period of swings. The minimum and default value is 2.
Divergence Detect Method : Selects the indicator (MACD, RSI, or AO) used for detecting divergences. The default indicator is MACD.
Show Fractal : Chooses whether to display fractals or not. The default is "No."
Show Table : Determines whether to display the table or not. The default is "Yes."
Show Label : Chooses whether to display labels or not. The default is "Yes."
Label Size : Adjusts the size of the labels from "Tiny" to "Large."

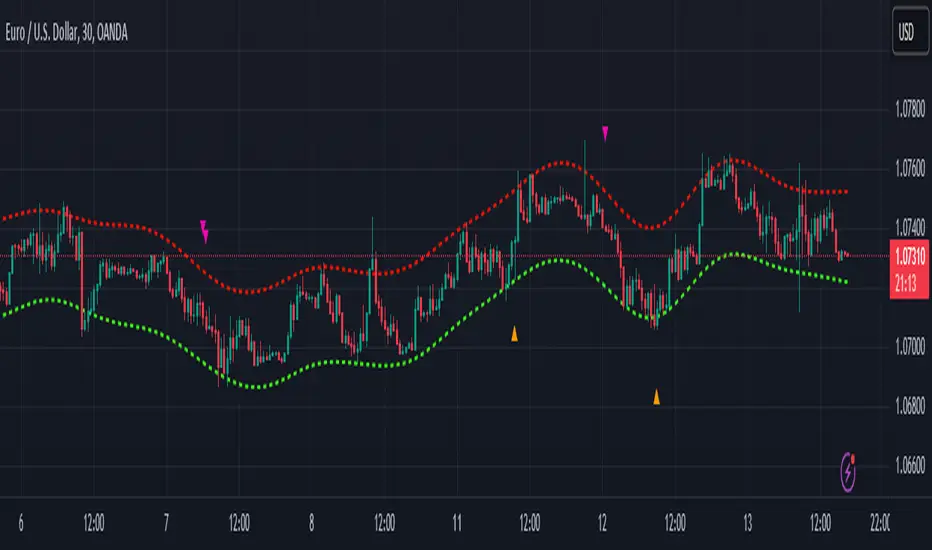
Nadaraya-Watson Envelope: Modified by YosietRange Filter indicator based on the LuxAlgo Nadaraya-Watson Envelope () indicator adding the SMA 30 high and SMA 7 low to predict the changes of the trends lines price.
WARNING: This indicator, as the same as the original, repaints the chart and could affect the exact values of the prices.
SMA Low 7 was identified using tensorflowJS years ago as accurate and abstract rsi indicator
SMA High 30 was identified using tensorflowJS years ago as accurate and strong trend line
This two SMAs were added to the original indicator Nadaraya-Watson to predict the exact points where the price will change direction or will re-test the trend to continue on.
The signals will act as the Williams Fractals, replacing the original signals of the indicator.
For those ICT/SMC traders, the bands and SMAs can toggle off in the settings of this indicator.
SETTINGS
Can set the source of the UPPER band indivuadilly
Can set the source of the LOWER band indivuadilly
Can toggle the visibility of the bands, this will not affect the calculations
Can toggle the visibility of SMAs
ALERTS AND SIGNALS
When the SMA LOW 7 cross under or over the bands, will trigger a signal orange
When the SMA 30 High cross over the upper band, will trigger a short signal purpple
HOW TO USE IT
If the both signals appears (sma 7 low and sma 30 high) crossing the upper band at the same point, this means that the price will drop strongly.
If the sma 7 low cross signal (orange triangle) appears under the price and lower band, means that the price will go up.
The separation of the signals from the chart will suggest the force of the movement. While more distance be, strongest reaction of the price.
DISCLAIMER : This indicator or script does not imply or constitute financial advice, investment advice, trading advice or any other type of advice or recommendation by and for TradingView. Use it at your own risk and your own decision.
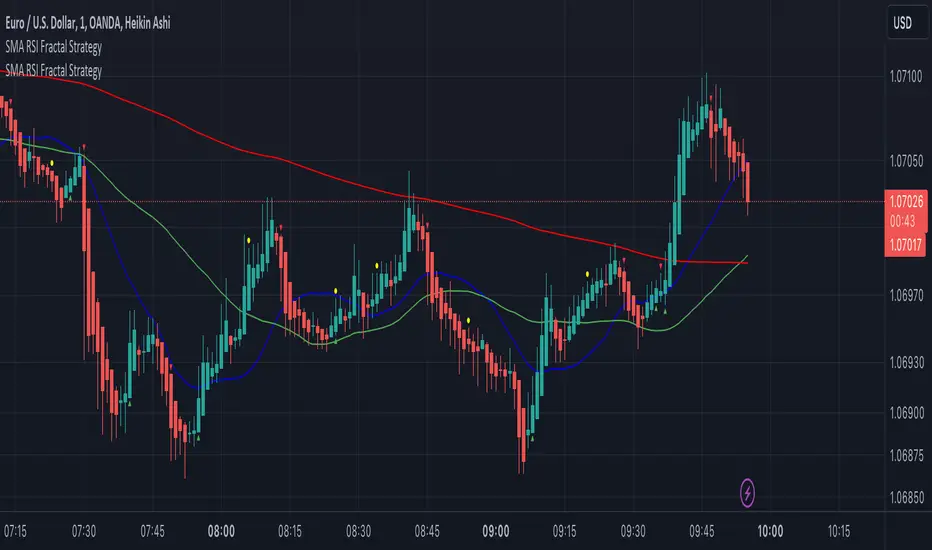
SMA RSI Fractal Entry & Exit PointsUsing the 20, 50, 200 SMA, RSI, and Fractals to indicate when to exit buy/sells or move SL if your not trailing to protect profits
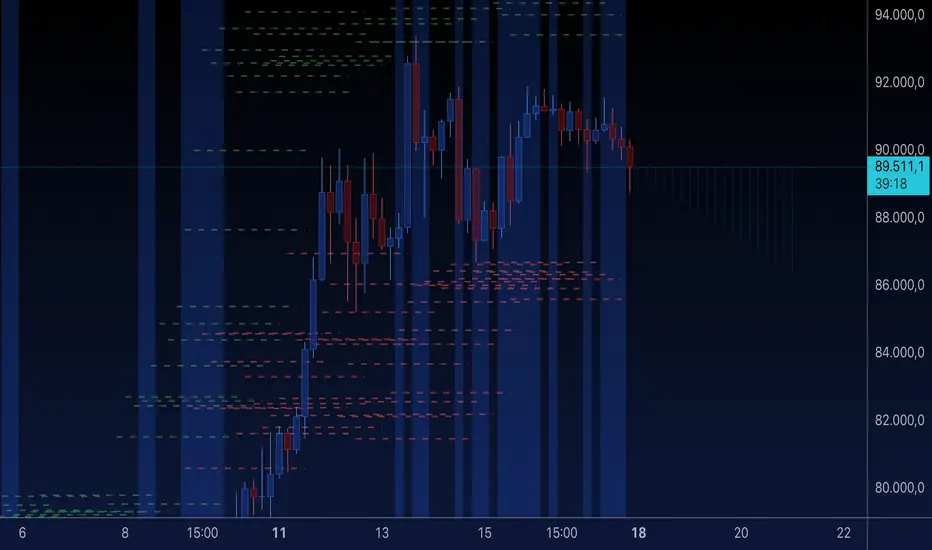
Consolidation Spotter Multi Time FrameThis tool is designed for traders looking to spot areas of consolidation on their charts across various time frames. It highlights these consolidation areas using visually appealing boxes, making it easier to identify potential breakout or breakdown zones.
How To Use:
Spotting Consolidation: When you see a box form on your chart, this represents a consolidation zone. Within this zone, the price is moving sideways without a strong upward or downward trend.
Anticipating Breakouts & Breakdowns: Watch the price as it approaches the edges of the box. A movement outside the box can signal a potential breakout (if above the box) or a breakdown (if below the box). This is where momentum shifts can happen.
Momentum Confirmation: Once the price clearly moves out of the box, it indicates a momentum shift. If the price moves upwards out of the box, this can be seen as bullish momentum. Conversely, if the price moves downwards out of the box, this can be seen as bearish momentum.
To use the tool effectively, adjust the settings to suit your trading style, choose your preferred visual theme, and watch as the script highlights key consolidation areas on your chart.
Tip: To visualize fractals, consider using multiple instances of the "Consolidation Spotter" indicator, each set to a different timeframe. This approach allows you to observe consolidations nested within larger consolidations, offering deeper insights into market structures. 😉

BEST ABCD Pattern Screener Deribit:DVOL BTC DXY scannerModified this script by Daveatt (based on Ricardo Santos Fractals)
to scan patterns in BTCUSD, ETHUSD, DVOL, DXY, DVOL/VV

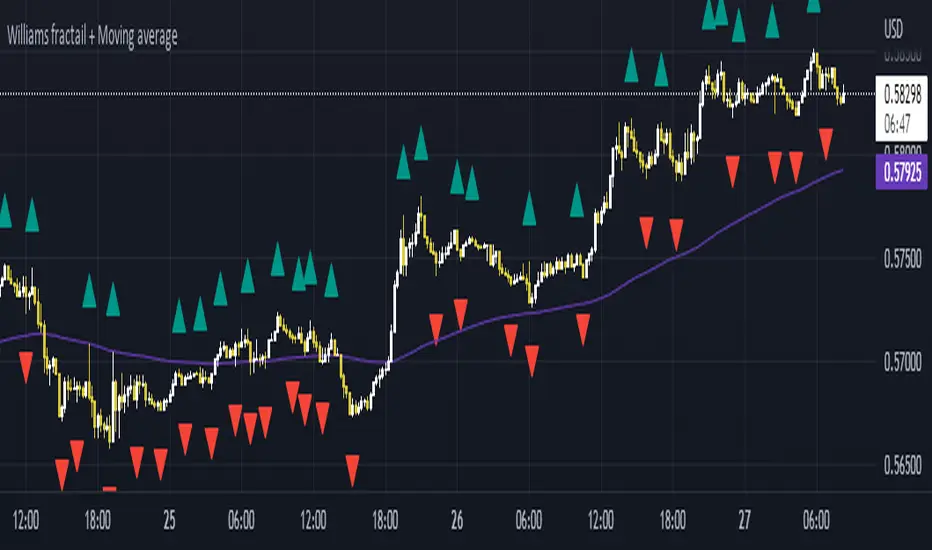
Williams Fractals + SMMAwilliams fractail + smoothed moving average. moving average. williams fractails with moving average , williams fractails + MA, smma

Williams Fractals + SMMAwilliams fractail + moving average. Is for educational . combined indicator of williams fractails and smmothed moving average
NormalizedOscillatorsLibrary "NormalizedOscillators"
Collection of some common Oscillators. All are zero-mean and normalized to fit in the -1..1 range. Some are modified, so that the internal smoothing function could be configurable (for example, to enable Hann Windowing, that John F. Ehlers uses frequently). Some are modified for other reasons (see comments in the code), but never without a reason. This collection is neither encyclopaedic, nor reference, however I try to find the most correct implementation. Suggestions are welcome.
rsi2(upper, lower) RSI - second step
Parameters:
upper : Upwards momentum
lower : Downwards momentum
Returns: Oscillator value
Modified by Ehlers from Wilder's implementation to have a zero mean (oscillator from -1 to +1)
Originally: 100.0 - (100.0 / (1.0 + upper / lower))
Ignoring the 100 scale factor, we get: upper / (upper + lower)
Multiplying by two and subtracting 1, we get: (2 * upper) / (upper + lower) - 1 = (upper - lower) / (upper + lower)
rms(src, len) Root mean square (RMS)
Parameters:
src : Source series
len : Lookback period
Based on by John F. Ehlers implementation
ift(src) Inverse Fisher Transform
Parameters:
src : Source series
Returns: Normalized series
Based on by John F. Ehlers implementation
The input values have been multiplied by 2 (was "2*src", now "4*src") to force expansion - not compression
The inputs may be further modified, if needed
stoch(src, len) Stochastic
Parameters:
src : Source series
len : Lookback period
Returns: Oscillator series
ssstoch(src, len) Super Smooth Stochastic (part of MESA Stochastic) by John F. Ehlers
Parameters:
src : Source series
len : Lookback period
Returns: Oscillator series
Introduced in the January 2014 issue of Stocks and Commodities
This is not an implementation of MESA Stochastic, as it is based on Highpass filter not present in the function (but you can construct it)
This implementation is scaled by 0.95, so that Super Smoother does not exceed 1/-1
I do not know, if this the right way to fix this issue, but it works for now
netKendall(src, len) Noise Elimination Technology by John F. Ehlers
Parameters:
src : Source series
len : Lookback period
Returns: Oscillator series
Introduced in the December 2020 issue of Stocks and Commodities
Uses simplified Kendall correlation algorithm
Implementation by @QuantTherapy:
rsi(src, len, smooth) RSI
Parameters:
src : Source series
len : Lookback period
smooth : Internal smoothing algorithm
Returns: Oscillator series
vrsi(src, len, smooth) Volume-scaled RSI
Parameters:
src : Source series
len : Lookback period
smooth : Internal smoothing algorithm
Returns: Oscillator series
This is my own version of RSI. It scales price movements by the proportion of RMS of volume
mrsi(src, len, smooth) Momentum RSI
Parameters:
src : Source series
len : Lookback period
smooth : Internal smoothing algorithm
Returns: Oscillator series
Inspired by RocketRSI by John F. Ehlers (Stocks and Commodities, May 2018)
rrsi(src, len, smooth) Rocket RSI
Parameters:
src : Source series
len : Lookback period
smooth : Internal smoothing algorithm
Returns: Oscillator series
Inspired by RocketRSI by John F. Ehlers (Stocks and Commodities, May 2018)
Does not include Fisher Transform of the original implementation, as the output must be normalized
Does not include momentum smoothing length configuration, so always assumes half the lookback length
mfi(src, len, smooth) Money Flow Index
Parameters:
src : Source series
len : Lookback period
smooth : Internal smoothing algorithm
Returns: Oscillator series
lrsi(src, in_gamma, len) Laguerre RSI by John F. Ehlers
Parameters:
src : Source series
in_gamma : Damping factor (default is -1 to generate from len)
len : Lookback period (alternatively, if gamma is not set)
Returns: Oscillator series
The original implementation is with gamma. As it is impossible to collect gamma in my system, where the only user input is length,
an alternative calculation is included, where gamma is set by dividing len by 30. Maybe different calculation would be better?
fe(len) Choppiness Index or Fractal Energy
Parameters:
len : Lookback period
Returns: Oscillator series
The Choppiness Index (CHOP) was created by E. W. Dreiss
This indicator is sometimes called Fractal Energy
er(src, len) Efficiency ratio
Parameters:
src : Source series
len : Lookback period
Returns: Oscillator series
Based on Kaufman Adaptive Moving Average calculation
This is the correct Efficiency ratio calculation, and most other implementations are wrong:
the number of bar differences is 1 less than the length, otherwise we are adding the change outside of the measured range!
For reference, see Stocks and Commodities June 1995
dmi(len, smooth) Directional Movement Index
Parameters:
len : Lookback period
smooth : Internal smoothing algorithm
Returns: Oscillator series
Based on the original Tradingview algorithm
Modified with inspiration from John F. Ehlers DMH (but not implementing the DMH algorithm!)
Only ADX is returned
Rescaled to fit -1 to +1
Unlike most oscillators, there is no src parameter as DMI works directly with high and low values
fdmi(len, smooth) Fast Directional Movement Index
Parameters:
len : Lookback period
smooth : Internal smoothing algorithm
Returns: Oscillator series
Same as DMI, but without secondary smoothing. Can be smoothed later. Instead, +DM and -DM smoothing can be configured
doOsc(type, src, len, smooth) Execute a particular Oscillator from the list
Parameters:
type : Oscillator type to use
src : Source series
len : Lookback period
smooth : Internal smoothing algorithm
Returns: Oscillator series
Chande Momentum Oscillator (CMO) is RSI without smoothing. No idea, why some authors use different calculations
LRSI with Fractal Energy is a combo oscillator that uses Fractal Energy to tune LRSI gamma, as seen here: www.prorealcode.com
doPostfilter(type, src, len) Execute a particular Oscillator Postfilter from the list
Parameters:
type : Oscillator type to use
src : Source series
len : Lookback period
Returns: Oscillator series

[_ParkF]FractalTop gray line is the fractal resistance.
Bottom gray line is the fractal support.
Central red line is the average of the top&bottom fractal.
Fractals can be displayed as support and resistance, and the red fractal average line indicates a trend.
상단 회색선은 프랙탈 저항,
하단 회색선은 프랙탈 지지,
중앙 빨간선은 프랙탈 상,하단의 평균,
프랙탈은 지지와 저항으로 표시되고 빨간색 프랙탈 평균선은 추세입니다.

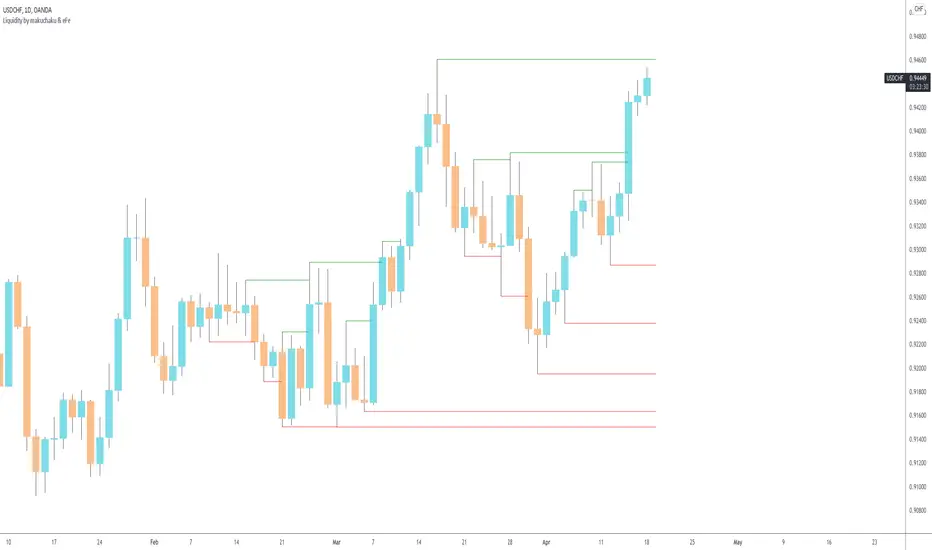
Makuchaku's trading tools - Liquidity visualizerThis indicator plots those pivots/fractals which have not been taken out by price, whereby showing where are the clusters of highs/lows where stop orders (or liquidity) could be hiding.
This is a fantastic tool for taking reversal trades.
Synthetic Price Action GeneratorNOTICE:
First thing you need to know, it "DOES NOT" reflect the price of the ticker you will load it on. THIS IS NOT AN INDICATOR FOR TRADING! It's a developer tool solely generating random values that look exactly like the fractals we observe every single day. This script's generated candles are as fake as the never ending garbage news cycles we are often force fed and expected to believe by using carefully scripted narratives peddled as hypnotic truth to psychologically and emotionally influence you to the point of control by coercion and subjugation. I wanted to make the script's synthetic nature very clear using that analogy, it's dynamically artificial. Do not accidentally become disillusioned by this scripts values, make trading decisions from it, and lastly don't become victim to predatory media magic ministry parrots with pretty, handsome smiles, compelling you to board their ferris wheel of fear. Now, on to the good stuff...
BACKSTORY:
Occasionally I find myself in situations where I have to build analyzers in Pine to actually build novel quantitative analytic indicators and tools worthy of future use. These analyzers certainly don't exist on this platform, but usually are required to engineer and tweak algorithms of the highest quality with the finest computational caliber. I have numerous other synthesizers to publish besides this one.
For many reasons, I needed a synthetic environment to utilize the analyzers I built in Pine, to even pursue building some exotic indicators and algorithms. Pine doesn't allow sourcing of tuples. Not to mention, I required numerous Pine advancements to make long held dreams into tangible realities. Many Pine upgrades have arrived and MANY, MANY more are in need of implementation for all. Now that I have this, intending to use it in the future often when in need, you can now use it too. I do anticipate some skilled Pine poets will employ this intended handy utility to design and/or improved indicators for trading.
ORIGIN:
This was inspired by the brilliance from the world renowned ALGOmist John F. Ehlers, but it's taken on a completely alien form from its original DNA. Browsing on the internet for something else, I came across an article with a small code snippet, and I remembered an old wish of mine. I have long known that by flipping back and forth on specific tickers and timeframes in my Watchlist is not the most efficient way to evaluate indicators in multiple theatres of price action. I realized, I always wanted to possess and use this sort of tool, so... I put it into Pine form, but now have decided to inject it with Pine Script steroids. The outcome is highly mutable candle formations in a reusable mutagenic package, observable above and masquerading as genuine looking price candles.
OVERVIEW:
I guess you could call it a price action synthesizer, but I entitled it "Synthetic Price Action Generator" for those who may be searching for such a thing. You may find this more useful on the All or 5Y charts initially to witness indication from beginning (barstate.isfirst === barindex==0) to end (last_bar_index), but you may also use keyboard shortcuts + + to view the earliest plottable bars on any timeframe. I often use that keyboard shortcut to qualify an indicator through the entirety of it's runtime.
A lot can go wrong unexpectedly with indicator initialization, and you will never know it if you don't inspect it. Many recursively endowed Infinite Impulse Response (IIR) Filters can initialize with unintended results that minutely ring in slightly erroneous fashion for the entire runtime, beginning to end, causing deviations from "what should of been..." values with false signals. Looking closely at spg(), you will recognize that 3 EMAs are employed to manage and maintain randomness of CLOSE, HIGH, and LOW. In fact, any indicator's barindex==0 initialization can be inspected with the keyboard shortcuts above. If you see anything obviously strange in an authors indicator, please contact the developer if possible and respectfully notify them.
PURPOSE:
The primary intended application of this script, is to offer developers from advanced to even novice skill levels assistance with building next generation indicators. Mostly, it's purpose is for testing and troubleshooting indicators AND evaluating how they perform in a "manageable" randomized environment. Some times indicators flake out on rare but problematic price fluctuations, and this may help you with finding your issues/errata sooner than later. While the candles upon initial loading look pristine, by tweaking it to the minval/maxval parameters limits OR beyond with a few code modifications, you can generate unusual volatility, for instance... huge wicks. Limits of minval= and maxval= of are by default set to a comfort zone of operation. Massive wicks or candle bodies will undoubtedly affect your indication and often render them useless on tickers that exhibit that behavior, like WGMCF intraday currently.
Copy/paste boundaries are provided for relevant insertion into another script. Paste placement should happen at the very top of a script. Note that by overwriting the close, open, high, etc... values, your compiler will give you generous warnings of "variable shadowing" in abundance, but this is an expected part of applying it to your novel script, no worries. plotcandle() can be copied over too and enabled/disabled in Settings->Style. Always remember to fully remove this scripts' code and those assignments properly before actual trading use of your script occurs, AND specifically when publishing. The entirety of this provided code should never, never exist in a published indicator.
OTHER INTENTIONS:
Even though these are 100% synthetic generated price points, you will notice ALL of the fractal pseudo-patterns that commonly exist in the markets, are naturally occurring with this generator too. You can also swiftly immerse yourself in pattern recognition exercises with increased efficiency in real time by clicking any SPAG Setting in focus and then using the up/down arrow keys. I hope I explained potential uses adequately...
On a personal note, the existence of fractal symmetry often makes me wonder, do we truly live in a totality chaotic universe or is it ordered mathematically for some outcomes to a certain extent. I think both. My observations, it's a pre-deterministic reality completely influenced by infinitesimal amounts of sentient free will with unimaginable existing and emerging quantities. Some how an unknown mysterious mechanism governing the totality of universal physics and mathematics counts this 100.0% flawlessly and perpetually. Anyways, you can't change the past that long existed before your birth or even yesterday, but you can choose to dream, create, and forge the future into your desires and hopes. As always, shite always happens when your not looking for it. What you choose to do after stepping in it unintentionally... is totally up to you. :) Maybe this tool and tips provided will aid you in not stepping in an algo cachucha up to your ankles somehow.
SCRIPTING LESSONS PORTRAYED IN THIS SCRIPT:
Pine etiquette and code cleanliness
Overwrite capabilities of built-in Pine variables for testing indicators
Various techniques to organize Settings panel while providing ease of adjustment utility
Use of tooltip= to provide users adequate valuable information. Most people want to trade with indicators, not blindly make adjustments to them without any knowledge of their intended operation/effects
When available time provides itself, I will consider your inquiries, thoughts, and concepts presented below in the comments section, should you have any questions or comments regarding this indicator. When my indicators achieve more prevalent use by TV members , I may implement more ideas when they present themselves as worthy additions. Have a profitable future everyone!

DivergenceLibrary "Divergence"
Calculates a divergence between 2 series
bullish(_src, _low, depth) Calculates bullish divergence
Parameters:
_src : Main series
_low : Comparison series (`low` is used if no argument is supplied)
depth : Fractal Depth (`2` is used if no argument is supplied)
Returns: 2 boolean values for regular and hidden divergence
bearish(_src, _high, depth) Calculates bearish divergence
Parameters:
_src : Main series
_high : Comparison series (`high` is used if no argument is supplied)
depth : Fractal Depth (`2` is used if no argument is supplied)
Returns: 2 boolean values for regular and hidden divergence
I created this library to plug and play divergences in any code.
You can create a divergence indicator from any series you like.
Fractals are used to pinpoint the edge of the series. The higher the depth, the slower the divergence updates get.
My Plain Stochastic Divergence uses the same calculation. Watch it in action.