Portfolio Backtester Engine█ OVERVIEW
Portfolio Backtester Engine (PBTE). This tool will allow you to backtest strategies across multiple securities at once. Allowing you to easier understand if your strategy is robust. If you are familiar with the PineCoders backtesting engine , then you will find this indicator pleasant to work with as it is an adaptation based on that work. Much of the functionality has been kept the same, or enhanced, with some minor adjustments I made on the account of creating a more subjectively intuitive tool.
█ HISTORY
The original purpose of the backtesting engine (`BTE`) was to bridge the gap between strategies and studies . Previously, strategies did not contain the ability to send alerts, but were necessary for backtesting. Studies on the other hand were necessary for sending alerts, but could not provide backtesting results . Often, traders would have to manage two separate Pine scripts to take advantage of each feature, this was less than ideal.
The `BTE` published by PineCoders offered a solution to this issue by generating backtesting results under the context of a study(). This allowed traders to backtest their strategy and simultaneously generate alerts for automated trading, thus eliminating the need for a separate strategy() script (though, even converting the engine to a strategy was made simple by the PineCoders!).
Fast forward a couple years and PineScript evolved beyond these issues and alerts were introduced into strategies. The BTE was not quite as necessary anymore, but is still extremely useful as it contains extra features and data not found under the strategy() context. Below is an excerpt of features contained by the BTE:
"""
More than `40` built-in strategies,
Customizable components,
Coupling with your own external indicator,
Simple conversion from Study to Strategy modes,
Post-Exit analysis to search for alternate trade outcomes,
Use of the Data Window to show detailed bar by bar trade information and global statistics, including some not provided by TV backtesting,
Plotting of reminders and generation of alerts on in-trade events.
"""
Before I go any further, I want to be clear that the BTE is STILL a good tool and it is STILL very useful. The Portfolio Backtesting Engine I am introducing is only a tangental advancement and not to be confused as a replacement, this tool would not have been possible without the `BTE`.
█ THE PROBLEM
Most strategies built in Pine are limited by one thing. Data. Backtesting should be a rigorous process and researchers should examine the performance of their strategy across all market regimes; that includes, bullish and bearish markets, ranging markets, low volatility and high volatility. Depending on your TV subscription The Pine Engine is limited to 5k-20k historical bars available for backtesting, which can often leave the strategy results wanting. As a general rule of thumb, strategies should be tested across a quantity of historical bars which will allow for at least 100 trades. In many cases, the lack of historical bars available for backtesting and frequency of the strategy signals produces less than 100 trades, rendering your strategy results inconclusive.
█ THE SOLUTION
In order to be confident that we have a robust strategy we must test it across all market regimes and we must have over 100 trades. To do this effectively, researchers can use the Portfolio Backtesting Engine (PBTE).
By testing a strategy across a carefully selected portfolio of securities, researchers can now gather 5k-20k historical bars per security! Currently, the PTBE allows up to 5 securities, which amounts to 25k-100k historical bars.
█ HOW TO USE
1 — Add the indicator to your chart.
• Confirm inputs. These will be the most important initial values which you can change later by clicking the gear icon ⚙ and opening up the settings of the indicator.
2 — Select a portfolio.
• You will want to spend some time carefully selecting a portfolio of securities.
• Each security should be uncorrelated.
• The entire portfolio should contain a mix of different market regimes.
You should understand that strategies generally take advantage of one particular type of market regime. (trending, ranging, low/high volatility)
For example, the default RSI strategy is typically advantageous during ranging markets, whereas a typical moving average crossover strategy is advantageous in trending markets.
If you were to use the standard RSI strategy during a trending market, you might be selling when you should be buying.
Similarily, if you use an SMA crossover during a ranging market, you will find that the MA's may produce many false signals.
Even if you build a strategy that is designed to be used only in a trending market, it is still best to select a portfolio of all market regimes
as you will be able to test how your strategy will perform when the market does something unexpected.
3 — Test a built-in strategy or add your own.
• Navigate to gear icon ⚙ (settings) of strategy.
• Choose your options.
• Select a Main Entry Strat and Alternate Entry Strat .
• If you want to add your own strategy, you will need to modify the source code and follow the built-in example.
• You will only need to generate (buy 1 / sell -1/ neutral 0) signals.
• Select a Filter , by default these are all off.
• Select an Entry Stop - This will be your stop loss placed at the trade entry.
• Select Pyamiding - This will allow you to stack positions. By default this is off.
• Select Hard Exits - You can also think of these as Take Profits.
• Let the strategy run and take note of the display tables results.
• Portfolio - Shows each security.
• The strategy runs on each asset in your portfolio.
• The initial capital is equally distributed across each security.
So if you have 5 securities and a starting capital of 100,000$ then each security will run the strategy starting with 20,000$
The total row will aggregate the results on a bar by bar basis showing the total results of your initial capital.
• Net Profit (NP) - Shows profitability.
• Number of Trades (#T) - Shows # of trades taken during backtesting period.
• Typically will want to see this number greater than 100 on the "Total" row.
• Average Trade Length (ATL) - Shows average # of days in a trade.
• Maximum Drawdown (MD ) - Max peak-to-valley equity drawdown during backtesting period.
• This number defines the minimum amount of capital required to trade the system.
• Typically, this shouldn’t be lower than 34% and we will want to allow for at least 50% beyond this number.
• Maximum Loss (ML) - Shows largest loss experienced on a per-trade basis.
• Normally, don’t want to exceed more than 1-2 % of equity.
• Maximum Drawdown Duration (MDD) - The longest duration of a drawdown in equity prior to a new equity peak.
• This number is important to help us psychologically understand how long we can expect to wait for a new peak in account equity.
• Maximum Consecutive Losses (MCL) - The max consecutive losses endured throughout the backtesting period.
• Another important metric for trader psychology, this will help you understand how many losses you should be prepared to handle.
• Profit to Maximum Drawdown (P:MD) - A ratio for the average profit to the maximum drawdown.
• The higher the ratio is, the better. Large profits and small losses contribute to a good PMD.
• This metric allows us to examine the profit with respect to risk.
• Profit Loss Ratio (P:L) - Average profit over the average loss.
• Typically this number should be higher in trend following systems.
• Mean reversion systems show lower values, but compensate with a better win %.
• Percent Winners (% W) - The percentage of winning trades.
• Trend systems will usually have lower win percentages, since statistically the market is only trending roughly 30% of the time.
• Mean reversion systems typically should have a high % W.
• Time Percentage (Time %) - The amount of time that the system has an open position.
• The more time you are in the market, the more you are exposed to market risk, not to mention you could be using that money for something else right?
• Return on Investment (ROI) - Your Net Profit over your initial investment, represented as a percentage.
• You want this number to be positive and high.
• Open Profit (OP) - If the strategy has any open positions, the floating value will be represented here.
• Trading Days (TD) - An important metric showing how many days the strategy was active.
• This is good to know and will be valuable in understanding how long you will need to run this strategy in order to achieve results.
█ FEATURES
These are additional features that extend the original `BTE` features.
- Portfolio backtesting.
- Color coded performance results.
- Circuit Breakers that will stop trading.
- Position reversals on exit. (Simulating the function of always in the market. Similar to strategy.entry functionality)
- Whipsaw Filter
- Moving Average Filter
- Minimum Change Filter
- % Gain Equity Exit
- Popular strategies, (MACD, MA cross, supertrend)
Below are features that were excluded from the original `BTE`
- 2 stage in-trade stops with kick-in rules (This was a subjective decision to remove. I found it to be complex and thwarted my use of the `BTE` for some time.)
- Simple conversion from Study to Strategy modes. (Not possible with multiple securities)
- Coupling with your own external indicator (Not really practical to use with multiple securities, but could be used if signals were generated based on some indicator which was not based on the current chart)
- Use of the Data Window to show detailed bar by bar trade information and global statistics.
- Post Exit Analysis.
- Plotting of reminders and generation of alerts on in-trade events.
- Alerts (These may be added in the future by request when I find the time.)
█ THANKS
The whole PineCoders team for all their shared knowledge and original publication of the BTE and Richard Weismann for his ideas on building robust strategies.
═════════════════════════════════════════════════════════════════════════
ค้นหาในสคริปต์สำหรับ "entry"

RSI+PA+DCA StrategyDear Tradingview community,
This RSI based trading strategy is created as a training exercise. I am not a professional trader, but a committed hobbyist. This not a finished trading strategy meant for trading, but more a combination of different trading ideas I liked to explore deeper. The aim with this exercise was to gain more knowledge and understanding about price averaging and dollar cost averaging strategies. Aside that I wanted to learn how to program a pyramiding strategy, how to plot different order entry layers and how to open positions on a specific time interval.
In this script I adapted code from a couple of strategy examples by Coinrule . Who wrote simple and powerful examples of RSI based strategies and pyramiding strategies.
Also the HOWTO scripts shared by vitvlkv were very helpful for this exercise. In the script description you can find all the sources to the code.
A PA strategy could be a helpful addition to ease the 'stress-management to buy when price drops and resolution in selling when the price is rising' (Coinrule).
The idea behind the strategy is fairly simple and is based on an RSI strategy of buying low. A position is entered when the RSI and moving average conditions are met. The position is closed when it reaches a specified take profit percentage. As soon as the first the position is openend multiple PA (price average) layers are setup based on a specified percentage of price drop. When the price crosses the layer another position with somewhat the same amount of assets is entered. This causes the average cost price (the red plot line) to decrease. If the price drops more, another similar amount of assets is bought with another price average decrease as result. When the price starts rising again the different positions are separately closed when each reaches its specified take profit. The positions can be re-openend when the price drops again. And so on. When the price rises more and crosses over the average price and reached the specified take profit on top of it, it closes all the positions at once and cancels all orders. From that moment on it waits for another price dip before it opens a new position.
Another option is to activate a DCA function that opens a position based on a fixed specified amount. It enters a position at the start of every week and only when there are already other positions openend and if the current price is below the average price of the position. Like this buying on a time interval can help lowering the average price in case the market is down.
I read in some articles that price averaging is also called dollar cost averaging as the result is somewhat the same. Although DCA is really based on buying on fixed time intervals. These strategies are both considered long term investment strategies that can be profitable in the long run and are not suitable for short term investment schemes. The downturn is that the postion size increases when the general market trend is going down and that you have to patiently wait until the market start rising again.
Another notable aspect is that the logic in this strategy works the way it does because the entries are exited based on the FIFO (first in first out) close entry rule. This means that the first exit is applied to the first entry position that is openend. In other words that when the third entry reaches its take profit level and exits, it actually exits the first entry. If you take a close look in the 'List of Trades' of your Strategy Tester panel, you can see that some 'Long1' entries are closed by an 'Exit 3' and not by an 'Exit 1'. This means that your trade partly loses, but causes a decrease in average price that is later balanced out by lower or repeated entering and closing other positions. You can change this logic to a real sequential way of closing your entries, but this changes the averaging logic considerably. In case you want to test this you need to change, in this line in the strategy call 'close_entries_rule = "FIFO"', the word FIFO to ANY.
In the settings you can specify the percentage of portfolio to use for each trade to spread the risk and for each order a trading fee of 0.075% is calculated.

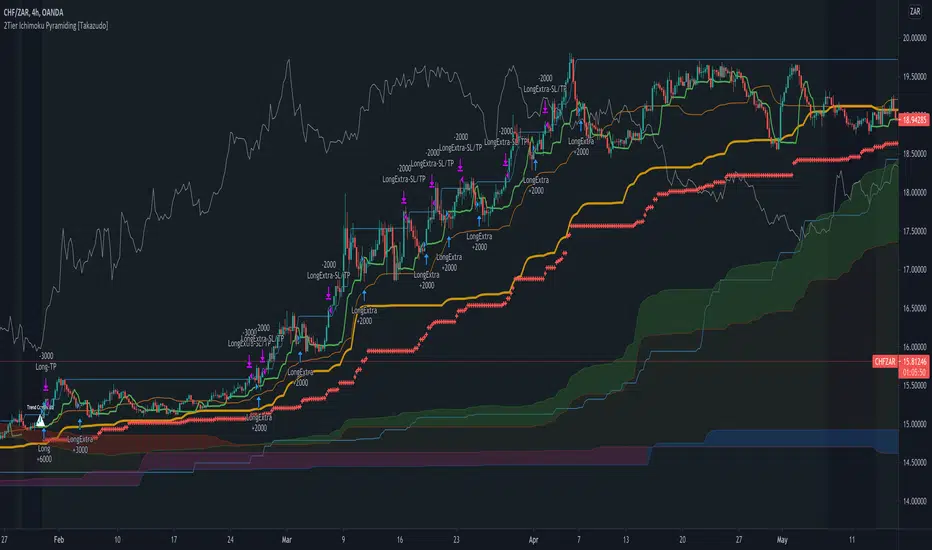
2Tier Ichimoku Pyramiding [Takazudo]Ichimoku based pyramiding strategy example that was tested on 4h TF.
makes the first entry when 2Tier Kumo breakout was occurred.
makes the extra entries when higher-low (on long) or lower-high (on short) was occurred.
uses short term MACD reversal + stop entry as a confirmation of the trend.
slack trailing stop loss.
changes entry quantity by the percentage of SL.
prevents the ranged entry.
This is just an example of how to trade using Ichimoku signals.
RSI Moving Average with Signal LineDefault values:
RSI = white
RSI Prime ( RSI of RSI ) = yellow
EMA 34 = blue
EMA 55 = red
They are listed in order of reactiveness to price changes. Think of them like the Williams Alligator...
White and yellow work the fastest, with WHITE being signal and YELLOW being trigger. Great for LTF
Blue and red work the slowest, with BLUE being frequently testing RED as support/resistance. Great for HTF
Long Entry:
RSIs both > SMAS (signal)
RSI > RSI Prime (confirmation)
Long Exit:
RSI < RSI Prime (signal)
RSIs both < SMAs (confirmation)
Short Entry:
RSIs both < SMAS (signal)
RSI < RSI Prime (confirmation)
Short Exit:
RSI > RSI Prime (signal)
RSIs both > SMAS (confirmation)

Triple EMA Scalper low lag stratHi all,
This strategy is based on the Amazing scalper for majors with risk management by SoftKill21
The change is in lines 11-20 where the sma's are replaced with Triple ema's to
lower the lag.
The original author is SoftKill21. His explanation is repeated below:
Best suited for 1M time frame and majors currency pairs.
Note that I tried it at 3M time frame.
Its made of :
Ema ( exponential moving average ) , long period 25
Ema ( exponential moving average ) Predictive, long period 50,
Ema ( exponential moving average ) Predictive, long period 100
Risk management , risking % of equity per trade using stop loss and take profits levels.
Long Entry:
When the Ema 25 cross up through the 50 Ema and 100 EMA . and we are in london or new york session( very important the session, imagine if we have only american or european currencies, its best to test it)
Short Entry:
When the Ema 25 cross down through the 50 Ema and 100 EMA , and we are in london or new york session( very important the session, imagine if we have only american or european currencies, its best to test it)
Exit:
TargetPrice: 5-10 pips
Stop loss: 9-12 pips

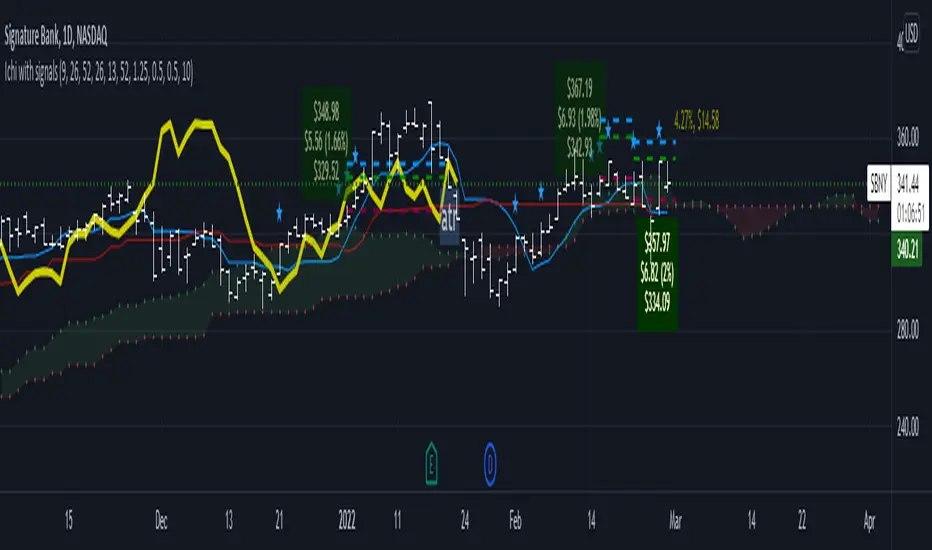
Ichimoku Cloud LONG and SHORT indicatorsThis simple script uses 4 rules from Ichimoku Cloud indicator to marks position entry points.
The idea is that by entering a long position just when these 4 criteria are met, you can capture a 2-3% plus move within the next few days:
1. The conversion line is above the base line
2. The price is above the clouds
3. The lagging span is above the clouds
4. The rightmost cloud is green
The same 4 criteria but inverted will indicate a short entry.
In order to avoid 'stale' entries which can lead to chasing, we want the price and conversion line crossovers to be recent, within the past few days. Ideally we want to enter before close on the day the entry signal is given so that we can capture any potential gap up (or down if short). Often the price will make a nice move the next day or day after. If any of the criteria become invalidated, or if after 4-5 days there hasn't been significant movement, then it was a false alarm.
This script will show the basic Ichimoku Cloud indicators, plus labels for bearish and bullish price and conversion line crossovers as well as LONG and SHOT indicators to show when the entry criteria have been met.
Amazing scalper for majors with risk managementHello,
Today I am glad to bring you an amazing simple and efficient scalper strategy.
Best suited for 1M time frame and majors currency pairs.
Its made of :
Ema (exponential moving average) , long period 25
Ema(exponential moving average) Predictive, long period 50,
Ema(exponential moving average) Predictive, long period 100
Risk management , risking % of equity per trade using stop loss and take profits levels.
Long Entry:
When the Ema 25 cross up through the 50 Ema and 100 EMA. and we are in london or new york session( very important the session, imagine if we have only american or european currencies, its best to test it)
Short Entry:
When the Ema 25 cross down through the 50 Ema and 100 EMA, and we are in london or new york session( very important the session, imagine if we have only american or european currencies, its best to test it)
Exit:
TargetPrice: 5-10 pips
Stop loss: 9-12 pips
Hope you enjoy it :)

Percent Calculator OverlayFirst and foremost: I'm inspired to publish my scripts by the other member's who publish quality, detailed scripts -a token of my appreciation and support, Thank You.
The percent calculator overlay is an extension of my Percent Calculator indicator that allows one to visualize the percent metrics they're interested in trading: it''s function is to simply output the target price from either the close or ones trade-entry based on a desired percent return on investment (R.O.I.) then plots it on top of the chart as an area plot and notes anytime in the past the desired conditions were met with a {flag "Success"}.
Say you want to profit 15% from your entry: open the settings and plug in your entry value and the number 15 into the appropriate settings and the indicator displays what the target price should be (rounded to two decimal places) right on the chart with the area as well as the horizontal line which is enabled by the "track price" setting.
The percent calculator overlay also goes one step further by finding the average percent return on investment over a desired interval of time (the default is 20 candles) as well as allows one to adjust the size of the price move the average percent return on investment is being calculated for which is displayed on the chart as circles and also displays a horizontal line for the most current value with the enabled "track price" setting.
NOTE: unlike the Percent Calculator the Percent Calculator Overlay creates a visual record of the number of success' the programmed parameters have achieved (based on the closing prices) which self adjusts when the "size of the move" is changed.
Say you want to find the average percent return on investment for a 3 candle swing over a 200 candle interval of time: open the settings and plug the number 200 into the interval setting and the number 3 into the price-move setting and the indicator displays what the average 3 candle swing returns on investment and plots what the target price would be to achieve the average return given the current close (or entry price) with the gray circles and the horizontal line enabled with the "track price" setting.
Practical Application: comparing ones desired return on investment to the average return on investment can help determine how realistic ones goals are... it's unlikely to achieve 100% return on investment if the average is only around 10% (given the parameters one is working within) but on the other hand achieving 5% return on investment is highly likely. By visualizing roughly how often the given parameters have achieved success on the chart one can become a lot more comfortable, confident, and accurate with their goals.
Forward Looking Statement: I believe in the not too distant future plug and play automated trading systems will be made available to the general public. Over the past 4 years we have seen brokers offer free charting software, commission free trading, and now fractional shares; I don't think it will be much longer before we can simply click a few buttons and tell the computer to enter when the stochastic is overbought/sold and exit with a predefined percent gain (and to repeat that process indefinitely). -Imagine the data moving 2-3-4 times a second, the liquidity flowing like Niagara falls, and 95% of the working population not only starting to invest but gains the extra cash flow they desperately need.
Beta testing: please comment or send me a message if you happen to stumble over any bugs or have any suggestions for improvement.

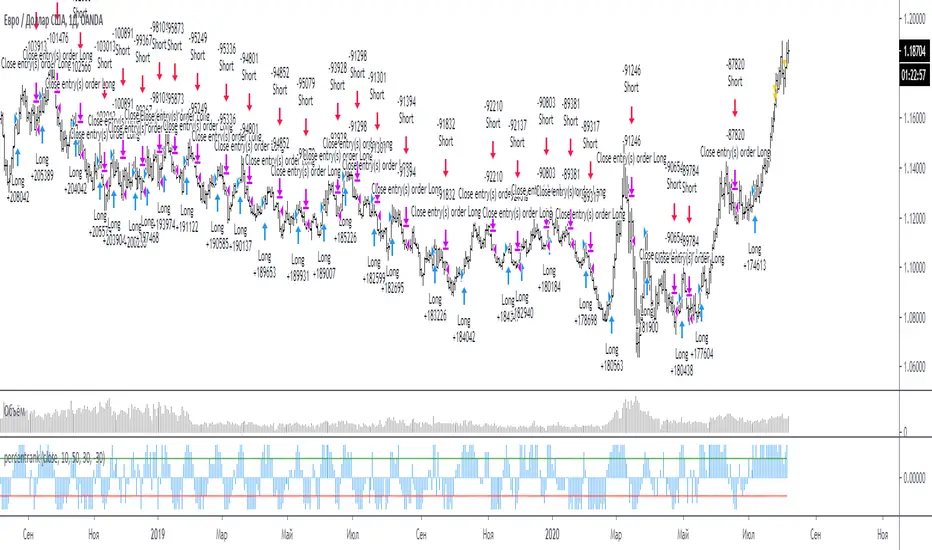
percentrank strategySrategy for percentrank
Percent rank is the percents of how many previous values was less than or equal to the current value of given series.
long entry: intersection line 1 from bottom to top
short entry: crossing line 2 from top to bottom
Стратегия для индикатора percentrank
Процентный рейтинг — это процент от количества предыдущих значений, которые были меньше или равны текущему значению данной серии.
вход в лонг: пересечение line 1 снизу вверх
вход в шорт: пересечение line 2 сверху вниз
Short in Bollinger Band Down trend (Weekly and Daily) // © PlanTradePlanMM
// 6/14/2020
// ---------------------------------------------------
// Name: Short in Bollinger Band Down trend (Weekly and Daily)
// ---------------------------------------------------
// Key Points in this study:
// 1. Short in BB Lower band, probability of price going down is more than 50%
// 2. Short at the top 1/4 of Lower band (EMA - Lower line), Stop is EMA, tartget is Lower line; it matches risk:/reward=1:3 naturally
//
// Draw Lines:
// BB Lower : is the Target (Black line)
// BB EMA : is the initial Stop (Black line)
// ShortLine : EMA - 1/4 of (Stop-target), which matches risk:/reward=1:3
// Prepare Zone : between EMA and ShortLine
// shortPrice : Blue dot line only showing when has Short position, Which shows entry price.
// StopPrice : Black dot line only showing when has Short position, Which shows updated stop price.
//
// Add SMA50 to filter the trend. Price <= SMA, allow to short
//
// What (Condition): in BB down trend band
// When (Price action): Price cross below ShortLine;
// How (Trading Plan): Short at ShortLine;
// Initial Stop is EMA;
// Initial Target is BB Lower Line;
// FollowUp: if price moves down first, and EMA is below Short Price. Move stop to EMA, At least "make even" in this trade;
// if Price touched Short Line again and goes down, new EMA will be the updated stop
//
// Exit: 1. Initial stop -- "Stop" when down first, Close above stop
// 2. Target reached -- "TR" when down quickly, Target reached
// 3. make even -- "ME" when small down and up, Exit at Entry Price
// 4. Small Winner -- "SM" when EMA below Entry price, Exit when Close above EMA
//
// --------------
// Because there are too many flags in up trend study already, I created this down trend script separately.
// Uptrend study is good for SPY, QQQ, and strong stocks.
// Downtrend Study is good for weak ETF, stock, and (-2x, -3x) ETFs, such as FAZ, UVXY, USO, XOP, AAL, CCL
// -----------------------------------------------------------------------------------------------------------------
// Back test Weekly and daily chart for SPY, QQQ, XOP, AAL, BA, MMM, FAZ, UVXY
// The best sample is FAZ Weekly chart.
// When SPY and QQQ are good in long term up trend, these (-2x, -3x) ETFs are always going down in long term.
// Some of them are not allowed to short. I used option Put/Put spread for the short entry.
//

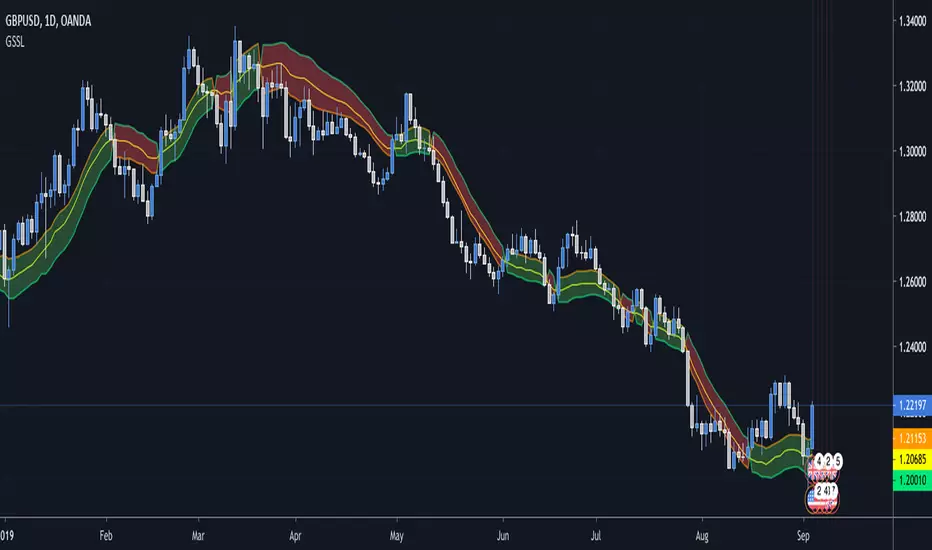
SSL Crossover + MA choiceThis indicator builds on the SSL channel code by ErwinBeckers @
I have added options for diff MA's to be used in the SSL channel and crossover indicators for buy/sell signals
default MA is set to Arnaud Legaux, but you can set it to whatever you like - original was a Simple Moving Average by ErwinBeckers
The indicator will not repaint as the signals are drawn after close of crossover candles
Let me know if you have any suggestions - happy to add more functionality

Mirror MACD by Trader JayThis is my take on the metatrader indicator, the mirror macd. Works pretty good on Forex, haven't tested on anything else
Enter long after the Blue Line Cross Up the Red Line and EXIT after the Green line Cross Up the Red Line (above the Blue Line).
For the opposite position : ENTER SELL after the Red Line Cross Down.

Generalized SSL by Vts// Generalized SSL:
// This is the very first time the SSL indicator, whose acronym I ignore, is on Tradingview.
// It is based on moving averages of the highs and lows.
// Similar channel indicators can be found, whereas
// this one implements the persistency inside the channel, which is rather tricky.
// The green line is the base line which decides entries and exits, possibly with trailing stops.
// With respect to the original version, here one can play with different moving averages.
// The default settings are (10,SMA)
//
// Vitelot/Yanez/Vts March 2019
Trend is your friendThis indicator evaluates the trend based on crosses of two McGinley moving averages. It paints candles accordingly (it does not repaint), so you can see what the indicator is saying more clearly and stay in your trade until you see a period of consolidation or a reversal. You can control how far away those moving averages need to be for you to consider it a trend. If this distance is not met candles color is not changed and it shows you that the market is in a period of consolidation. I also added visualization of RSI, so you can have an easier time finding appropriate profit targets. For stop loss I would recommend placing it a couple points above or below the previous high / low that is located above / below you final target for entry. You can also use a certain percentage that works for you. I tried adding a stop loss based on ATR, but I did not like the results. Using market structure is a better choice in my opinion.
Here is a basic trading strategy for the default settings:
Wait for the indicator to start printing a series of green or red candles. After that you can enter a long or a short around moving averages. Another valid place to entry is the specific RSI zone. If we are in an uptrend buying when RSI is oversold can be beneficial as you expect market to recover. I do not recommend changing RSI from 14. Vice versa for the downtrend. It gives you an edge as you know at what price RSI will be oversold and allows you to place trades in advance. Pretty neat! You need to realize that no indicator or strategy can give you an exact entry. There will always be some margin of error. What I wanted to say is that if there is a strong trend up and you buy around your key moving averages and when RSI is oversold you entered in good places and there is a pretty good chance you will make money.
Time frame settings:
If you want to use tighter stop losses I would recommend sticking to 15m. Do not go lower. It is not worth the stress. 1h and 4h seems to be very good as well, but expect your stop losses to be wider. What I personally tend to do is display 15m, 30m and 1h and compare it. Think of it as a short, mid and long term. That way you can see things little bit better.
Examples:
1H chart BTC
4h chart EUR / USD
1D chart NASDAQ
15m chart BTC (Daytrading)
That last chart shows that even if you were longing while the trend was about to change you still had a good chance to close it with a little profit and switch to short easily. The default settings is what has worked the best for me. Feel free to change them as you see fit and do not forget to let me know if you find something that works better :)
Notes:
Either disable wick display or change it to a neutral color like gray for both green and red candles. Unfortunately pine script does not allow wick painting, so if you have red / green wicks it will look terrible. If RSI visualization makes your candles look too small you can go to settings and disable the display of individual RSI levels. You will still be able to see the zones, but the scale won't be affected.

Daily ATR%If You are using a percentage of the Daily Average True Range in determining your stop placement,
this quick indicator is for You.
excerpt from investopedia.com/articles/trading/06/stopplacement.asp
ATR % Stop Method
The ATR% stop method can be used by any type of trader because the width of the stop is determined by the percentage of average true range (ATR). ATR is a measure of volatility over a specified period of time. The most common length is 14, which is also a common length for oscillators such as the relative strength index (RSI) and stochastics. A higher ATR indicates a more volatile market, while a lower ATR indicates a less volatile market. By using a certain percentage of ATR, you ensure that your stop is dynamic and changes appropriately with market conditions.
For example, for the first four months of 2006, the GBP/USD average daily range was around 110 to 140 pips. A day trader may want to use a 10% ATR stop - meaning that the stop is placed 10% x ATR pips from the entry price.In this instance, the stop would be anywhere from 11 to 14 pips from your entry price. A swing trader might use 50% or 100% of ATR as a stop. In May and June of 2006, daily ATR was anywhere from 150 to 180 pips. As such, the day trader with the 10% stop would have stops from entry of 15 to 18 pips while the swing trader with 50% stops would have stops of 75 to 90 pips from entry.

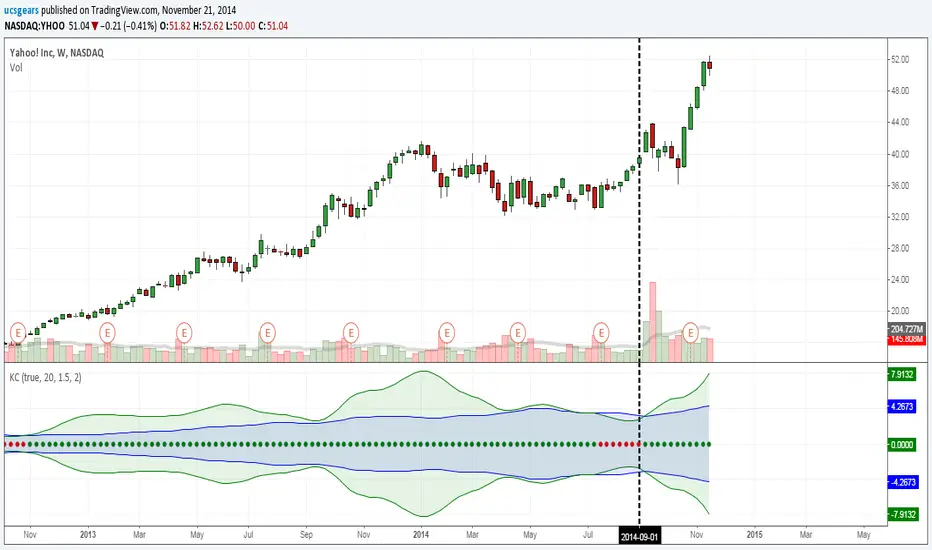
UCS_Squeeze_Timing-V1There is an important information the Squeeze indicator is missing, which is the Pre Squeeze entry. While the Bollinger band begins to curves out of the KC, The breakout usually happens. There are many instances that the Squeeze indicator will fire, after the Major move, I cant blame the indicator, thats the nature (lagging) of all indicators, and we have to live with it.
Therefore pre-squeeze-fire Entry can be critical in timing your entry. Timing it too early could result in stoploss if it turns against you, ( or serious burn on options premium), because we never know when the squeeze will fire with the TTM squeeze, But now We know. Its a little timing tool. Managing position is critical when playing options.
I will code the timing signal when I get some time.
Updated Versions -
XAUUSD Clean Sell Model🧠 What This Indicator Actually Is
This is a Smart Money–based directional model for XAUUSD, designed to:
Define where NOT to buy
Identify high-probability sell locations
Keep the chart clean and decision-focused
Trade structure → level → confirmation, not indicators
It is NOT a signal spam tool.
It’s a bias + confirmation framework.
1️⃣ Key Levels (Foundation of the Model)
🔴 Sell Level — 4930
This is the decision line
Below this level → sell-side bias only
Above this level → no trades / wait
👉 The indicator never sells blindly at 4930
It waits for structure confirmation
That’s why you see sells only after price breaks structure
🟠 Resistance — 5600
Macro invalidation level
If price accepts above 5600, the whole sell idea is wrong
This protects you from fighting strong trends
Smart money rule:
Bias must be invalidatable
🟢 Support Zone — 4350 → 4300
This green zone is NOT for buying aggressively.
It represents:
Higher-timeframe demand
Profit-taking area for shorts
Where sell pressure historically weakens
That’s why all sell labels target this zone.
2️⃣ Break of Structure (BOS) — The Core Trigger
What BOS Means Here
A Bearish BOS occurs when:
Price closes below a previous swing low
This confirms trend weakness
Smart money has likely distributed longs
In your chart:
BOS appears after the top
Not during consolidation
Not randomly
That’s intentional.
📌 No BOS = No trade
Why You See Fewer BOS Labels
Earlier versions were noisy.
This one shows only meaningful structure breaks.
That’s how professionals trade:
One break → one decision
3️⃣ Fair Value Gap (FVG) — Entry Refinement
What the FVG Represents
An FVG forms when:
Price moves too fast
Leaves an inefficiency
Institutions often retrace into it
In this model:
Only bearish FVGs are used
Only after BOS
Only near the sell zone
So you’re not chasing price.
You’re waiting for premium re-entry.
How to Use It
BOS happens → confirms sell bias
Price retraces into FVG
Entry near sell level (4930)
Target support zone
This is precision, not prediction.
4️⃣ Sell Labels — Why They Appear Where They Do
A SELL label appears ONLY when all conditions align:
✔ Price below 4930
✔ Bearish BOS confirmed
✔ Market shows rejection / imbalance
That’s why:
You don’t see sells everywhere
You don’t see sells in ranges
You don’t see sells near support
Each sell is a complete idea, not a suggestion.
5️⃣ Why This Indicator Looks “Quiet”
That’s a feature, not a problem.
Most traders lose because:
Too many signals
Too many indicators
No clear bias
This model answers only 3 questions:
Where is price relative to key levels?
Has structure confirmed my bias?
Where is my logical target?
If those aren’t aligned → do nothing
6️⃣ How a Professional Would Trade This
Higher Timeframe (H1 / H4)
Use indicator to define bias
Mark BOS + FVG
Plan the trade
Lower Timeframe (M5 / M15)
Enter on:
Rejection
Weak highs
Liquidity sweep into FVG
Stop above structure
Target 4350 → 4300
7️⃣ What This Indicator Is NOT
❌ Not a buy/sell robot
❌ Not a scalping tool
❌ Not meant to be traded every day
❌ Not for emotional trading
It’s a framework, not a crutch.
🧠 Final Mentor Take
This indicator teaches you:
Patience
Structure awareness
Risk discipline
Directional clarity
If you trade it correctly:
You’ll trade less — and make more.

Crypto Scalper: Hybrid Fixed/Trailing RRStrategy Overview: Scalping Hybrid — Trend Pullback with ATR-Driven Trailing Profit
This strategy is a high-precision systematic scalping framework engineered specifically for volatile assets like BTC. It leverages a dual-EMA architecture to define market structure, while employing a sophisticated "hybrid" exit logic that allows traders to choose between a classic fixed reward or a dynamic trailing system.
1. Market Regime & Trend Identification
The strategy utilizes two primary anchors to ensure it remains on the correct side of the market:
The Trend Anchor (EMA 200): Acts as the definitive filter. Longs are only permitted when price is above the 200 EMA; shorts only below it.
The Value Zone (EMA 20): Instead of chasing breakouts, the strategy waits for Mean Reversion. It identifies a "pullback" when price returns to touch or penetrate the 20 EMA, offering a superior entry price compared to momentum-chasing systems.
2. Multi-Dimensional Execution Filters
To eliminate "fakeouts" and low-probability setups, the strategy cross-references three critical data points before triggering an entry:
Institutional Alignment (VWAP): Ensures entries are occurring at or near the Volume Weighted Average Price, confirming institutional participation.
Volatility Threshold (ATR Filter): Prevents trading in "dead" or flat markets. The strategy only activates if current volatility is higher than its 50-period average.
Momentum Confirmation (Close Strength): A trade is only opened if the signal candle closes with high conviction (top 60% of the range for longs), proving that the reversal from the pullback is real.
3. Precision Risk Management (ATR-Based)
Risk is mathematically standardized using the Average True Range (ATR). By calculating stops based on current volatility rather than fixed pips/dollars, the strategy automatically loosens during high-volatility spikes and tightens during stable moves.
Stop Loss (SL): Fixed at the moment of entry at 1.0x ATR.
Cooldown Period: A mandatory 5-bar pause after every exit prevents "revenge trading" or entering twice during the same choppy consolidation.
4. Hybrid Exit Architecture (Fixed vs. Trailing)
This is the core innovation of the strategy. Users can toggle between two modes:
Fixed TP Mode: Uses a standard 1:2 Reward-to-Risk ratio (or user-defined) for consistent, predictable outcomes.
Trailing TP Mode: This is a "Runner" logic. The trailing stop remains dormant until the trade reaches a profit threshold (e.g., +1R). Once activated, it follows the price at a distance defined by ATR or a percentage. This allows the strategy to capture massive trending moves while protecting the initial risk.

All in One Trend Indicator by Nicks**Multi-Factor Confluence Suite (7-in-1 Overlay)**
### **Description:**
**Overview**
This script is a comprehensive workspace optimizer designed to combine 7 essential trading tools into a single, efficient overlay. By merging trend analysis, market structure, liquidity zones, and momentum signals, this tool allows traders to bypass the standard indicator limit and view high-probability confluence setups without a cluttered chart.
**Key Features & Functionality**
* **Trend Filtering (Hull Suite):**
* A lag-reduced moving average system that visualizes the macro trend.
* Includes candle coloring options to easily identify trend alignment.
* **Market Structure (SMC):**
* Automatically maps Break of Structure (BOS) and Change of Character (CHoCH).
* Identifies Order Blocks and Fair Value Gaps (FVG) for potential entry/exit zones.
* **Liquidity Analysis:**
* **Swings:** Highlights key swing highs and lows where stop losses typically reside.
* **Grabs:** Specifically detects "stop hunts" where price wicks liquidity before reversing (Bubbles visualization).
* **Momentum Signals (UT Bot & MACD):**
* **UT Bot:** Provides high-sensitivity Buy/Sell labels based on ATR trailing stops.
* **MACD Overlay:** Plots signal crossovers directly on the price chart (arrows) to identify momentum shifts without occupying a separate oscillator pane.
* **Session Timing:**
* Visualizes major trading sessions (NY, London, Tokyo, Sydney) with an optional dashboard table.
**How to Use**
This suite is designed for "Confluence Trading."
1. **Identify Trend:** Use the Hull Suite color to determine the directional bias.
2. **Find Structure:** Wait for price to react at an SMC Order Block or Liquidity Zone.
3. **Confirm Entry:** Look for a UT Bot label or MACD Arrow in the direction of the trend.
**Settings**
Each module is separated by headers in the settings menu. You can toggle specific indicators on/off to suit your trading style and keep the chart clean.
**Credits & Attribution**
This script is a compilation of open-source logic from the TradingView community, adapted and updated to Pine Script v5/v6 for compatibility. Special thanks to the original authors for their foundational work:
* *InSilico* (Hull Logic)
* *LuxAlgo* (SMC & Liquidity Swings Logic)
* *Flux Charts* (Liquidity Grabs Logic)
* *QuantNomad* (UT Bot Logic)
* *TraderHariKrishna* (Session Logic)
**License**
This source code is subject to the terms of the Mozilla Public License 2.0 and/or Creative Commons (CC BY-NC-SA 4.0) where applicable by the original authors. This script is intended for educational and personal use.
---

Combined Advanced Blueprint + Hybrid Stop + GravityCombined Advanced Blueprint + Hybrid Stop + Gravity
Overview
This indicator is a comprehensive "Swiss Army Knife" trading system that combines the classic Traders Reality Blueprint (Moving Averages & Vector Zones) with advanced institutional volume detection (Gravity Squeeze & Sharks) and a Hybrid Trailing Stop for trade management.
It is designed to identify institutional footprints, trend direction, supply/demand zones, and volatility contractions in a single, all-in-one overlay.
🚀 Key Features
1. Gravity Squeeze & Shark Detection (Institutional Volume)
This module detects anomalies in volume and price action to identify where "Smart Money" is stepping in.
Shark Icons (🦈): Appear when the Negative Volume Index (NVI) detects significant accumulation during low volatility periods. This often signals a "defense" of a price level by institutions.
Shark Support (Blood) Zones: When a Shark is detected, a red box is drawn from the low of the candle. This represents an institutional "line in the sand." If price closes below this box, the zone is invalidated (broken).
Gravity Squeeze (⚡): Indicates a contraction in volatility (ATR compression), suggesting an explosive move is imminent.
Coils (🌀) & Hammers (🔨): Identifies specific price action patterns occurring on high relative volume.
2. The Blueprint Moving Averages
Includes the standard Traders Reality moving average sequence to identify trend state and dynamic support/resistance.
Red (8 EMA): Immediate trend.
White (21 EMA): Short-term trend (The "Baseline").
Blue (34 EMA): Trend confirmation.
Indigo (55 EMA) & Purple (89 EMA): Mid-term trend.
Orange (50 SMA) & Dark Orange (200 SMA): Major institutional levels (Golden/Death Cross).
Visual Crossovers: Arrows and shapes appear for 8/21 crosses, 8/34 crosses, and the 50/200 cross.
3. PVSRA (Price Volume Support Resistance Analysis)
Colors trade bars based on volume relative to the average, highlighting hidden liquidity.
Green/Red Bars: Volume is ≥ 200% of the average. (Climax action).
Blue/Violet Bars: Volume is ≥ 150% of the average.
Grey Bars: Average/Low volume.
Vector Zones: Automatically plots zones based on these high-volume candles to show where significant business was transacted.
4. Hybrid Trailing Stop
A volatility-based stop-loss system designed to keep you in the trend longer.
Calculation: Uses a combination of ATR (Average True Range) and manually input Implied Volatility (IV) to calculate a safe distance from price.
Visual: A Fuchsia line that trails behind price. When price closes across this line, the trend structure is considered broken.
5. Inflection Zones (Supply & Demand)
Auto-Drawing: Identifies Swing Highs and Swing Lows to draw Supply (Blue) and Demand (Red) boxes.
BOS (Break of Structure): When price breaks through a zone, the box is removed or converted, helping keep the chart clean.
6. Pivot Points & VWAP
Pivots: Displays multitimeframe pivots (Daily, Weekly, Monthly, etc.) including Traditional, Fibonacci, and Camarilla calculations.
VWAP: Includes Standard Deviation bands (1, 2, and 3 SD) anchored to Session, Week, Month, or even Earnings/Splits.
7. Keltner Channels & RSI Triggers
Entry Signals: Plots circles on the chart when RSI enters extreme zones (Overbought/Oversold) while price is interacting with the Keltner Channel bands.
🛠 Settings & Configuration
Gravity Squeeze & Sharks
Enable: Toggle the overlay on/off.
Min Volume: Set the threshold for volume analysis (Default: 300k).
Max ADX: Filters out signals if the trend is already too exhausted.
Inflection Zones
Swing Length: Sensitivity of the swing high/low detection.
History to Keep: How many historic zones to display before deleting old ones.
Pivot Levels
Timeframe: Auto-selects based on your chart, or force specific timeframes (e.g., Daily Pivots on a 15m chart).
Type: Choose between Traditional, Fibonacci, Woodie, etc.
Trailing Stop
Multiplier: Adjust how "loose" or "tight" the stop is (Default: 1.5 ATR).
IV %: Manually input the annual Implied Volatility for the asset for higher precision.
🎯 How to Trade (Strategy Ideas)
1. The Shark Defense:
Look for a Shark Icon (🦈).
Watch the red "Blood" box form.
Long Entry: If price retests the box and holds (does not close below it), this is a high-probability buy zone.
Stop Loss: A candle close below the red box.
2. The 8/21 & 8/34 Cross:
Use the Arrows generated by the moving averages.
Combine with Vector Candles: If you get a Bullish Cross (Up Arrow) immediately following a Green/Blue vector candle, the move is supported by volume.
3. The Squeeze Breakout:
Look for the Squeeze Icon (⚡) indicating low volatility.
Wait for the Hybrid Trailing Stop line to flip (e.g., price crosses above the Fuchsia line) to confirm the breakout direction.
Alerts
The script includes built-in alert conditions for automation:
8/21 Bullish/Bearish Cross
8/34 Bullish/Bearish Cross
Credits:
Core logic based on Traders Reality (Blueprint/PVSRA).
Gravity logic adapted from standard institutional volume analysis.
Compiled & Enhanced by Gemini.

Vegas Triple Tunnel (CGYJ Pro)维加斯三通道(Vegas Tunnel)
指标简介
维加斯三通道是由职业交易员Vegas开发的经典趋势跟踪系统,通过三组EMA均线构建短期、中期、长期三层通道,帮助交易者识别趋势方向和最佳入场时机。
通道结构
通道均线用途短期EMA 21 / 26短线趋势、快速入场中期EMA 144 / 169核心趋势判断、标准入场长期EMA 576 / 676大趋势方向、重要支撑阻力
使用方法
多头排列:短期通道 > 中期通道 > 长期通道,逢回调做多
空头排列:短期通道 < 中期通道 < 长期通道,逢反弹做空
回调入场:价格回踩通道后反弹是最佳入场点
适用范围
适用于所有品种和周期,H1、H4、日线效果最佳。
Vegas Triple Tunnel
Overview
The Vegas Triple Tunnel is a classic trend-following system developed by professional trader Vegas. It uses three pairs of EMA lines to construct short-term, medium-term, and long-term channels, helping traders identify trend direction and optimal entry points.
Channel Structure
Short-term Channel: EMA 21 / 26 - For quick trend identification and short-term entries
Medium-term Channel: EMA 144 / 169 - Core trend judgment and standard entries
Long-term Channel: EMA 576 / 676 - Major trend direction and key support/resistance levels
How to Use
Bullish Alignment: Short > Medium > Long channel, look for pullback entries to go long
Bearish Alignment: Short < Medium < Long channel, look for bounce entries to go short
Best Entry: Price pullback to channel and bounce provides optimal entry opportunities
Applicable Markets
Works on all instruments and timeframes. Best results on H1, H4, and Daily charts.

Pattern Multi-TF Dashboardesigned to identify the three primary phases of price action: Contraction, Expansion, and Trend. By combining technical momentum (ADX) with price range volatility, this script provides a "top-down" view of the market, allowing traders to see how lower-timeframe price action fits into the broader market cycle.
Core Logic & Market Phases
The indicator classifies market conditions based on a proprietary blend of ADX (Average Directional Index) and price deviation from the Fair Market Value (FMV).
🟦 Contraction (Blue): Identified when ADX is low and price is consolidating within a narrow range relative to the FMV. This represents "market value" where orders are being accumulated.
🟧 Expansion (Orange): Triggered when ADX begins to rise and price pushes away from the FMV. This represents the initial breakout phase where the market is seeking a new value area.
🟩 Trend (Green): Confirmed when ADX remains high and price maintains direction. This is the "momentum" phase of the cycle.
⬜ Neutral (Gray): Default state when neither contraction nor strong momentum is detected.
Key Features
Multi-TF Dashboard: A dynamic, real-time table displaying the Phase, Bias (Bullish/Bearish), and FMV price for eight different timeframes (1m through Monthly).
Visual Bias Tracking: The "Bias" column is color-coded (Green for Bullish, Red for Bearish) based on whether price is trading above or below the Fair Market Value (Mid-point of the range).
On-Chart Inefficiencies (FVG): Automatically plots Green/Red triangles to highlight Fair Value Gaps, identifying areas of price imbalance where liquidity may be resting.
HTF FMV Overlay: Plots the Fair Market Value (Mid-line) of a user-defined Higher Timeframe (e.g., 4H) directly onto your current chart for easy trend reference.
Optimized Performance: Built specifically for Pine Script® v6, the dashboard is designed to update only on the most recent bar to ensure zero chart lag during manual scrolling.
How to Use
Identify the HTF Phase: Look at the background color of your chart to see the 4H or Daily phase.
Check for Alignment: Use the Dashboard to see if the 1m and 5m biases match the HTF bias.
Find Entry: Look for Inefficiencies (FVGs) that align with the Expansion or Trend phases for high-probability entry points.

Pattern Multi-TF DashboardPattern indicator is a comprehensive market analysis tool designed to identify the three primary phases of price action: Contraction, Expansion, and Trend. By combining technical momentum (ADX) with price range volatility, this script provides a "top-down" view of the market, allowing traders to see how lower-timeframe price action fits into the broader market cycle.
Core Logic & Market Phases
The indicator classifies market conditions based on a proprietary blend of ADX (Average Directional Index) and price deviation from the Fair Market Value (FMV).
🟦 Contraction (Blue): Identified when ADX is low and price is consolidating within a narrow range relative to the FMV. This represents "market value" where orders are being accumulated.
🟧 Expansion (Orange): Triggered when ADX begins to rise and price pushes away from the FMV. This represents the initial breakout phase where the market is seeking a new value area.
🟩 Trend (Green): Confirmed when ADX remains high and price maintains direction. This is the "momentum" phase of the cycle.
⬜ Neutral (Gray): Default state when neither contraction nor strong momentum is detected.
Key Features
Multi-TF Dashboard: A dynamic, real-time table displaying the Phase, Bias (Bullish/Bearish), and FMV price for eight different timeframes (1m through Monthly).
Visual Bias Tracking: The "Bias" column is color-coded (Green for Bullish, Red for Bearish) based on whether price is trading above or below the Fair Market Value (Mid-point of the range).
On-Chart Inefficiencies (FVG): Automatically plots Green/Red triangles to highlight Fair Value Gaps, identifying areas of price imbalance where liquidity may be resting.
HTF FMV Overlay: Plots the Fair Market Value (Mid-line) of a user-defined Higher Timeframe (e.g., 4H) directly onto your current chart for easy trend reference.
Optimized Performance: Built specifically for Pine Script® v6, the dashboard is designed to update only on the most recent bar to ensure zero chart lag during manual scrolling.
How to Use
Identify the HTF Phase: Look at the background color of your chart to see the 4H or Daily phase.
Check for Alignment: Use the Dashboard to see if the 1m and 5m biases match the HTF bias.
Find Entry: Look for Inefficiencies (FVGs) that align with the Expansion or Trend phases for high-probability entry points.
