Amazing Crossover SystemEntry Rules
BUY when the 5 EMA crosses above the 10 EMA from underneath and the RSI crosses above the 50.0 mark from the bottom.
SELL when the 5 EMA crosses below the 10 EMA from the top and the RSI crosses below the 50.0 mark from the top.
Make sure that the RSI did cross 50.0 from the top or bottom and not just ranging tightly around the level.
How to setup Alert:
1) Add the Amazing Crossover System to your chart via Indicators
2) Find your currency pair
3) Set the timeframe on the chart to 1 hour
4) Press 'Alt + A' (create alert shortcut)
5) Set the following criteria for the alert:
Condition = 'Amazing Crossover System', Plot, ' BUY Signal'
The rest of the alert can be customized to your preferences
5) Repeat steps 1 - 4, but set the Condition = 'Amazing Crossover System', Plot, ' SELL Signal'
ค้นหาในสคริปต์สำหรับ "entry"

Zero Lag Bounce Detector Lite [ZLBD]Concept and Strategy This script implements a "Bounce Detection" strategy designed to catch reversals at key institutional levels with minimal lag. Unlike standard trend-following indicators, ZLBD focuses on price action interactions with Order Blocks (OB) and Fair Value Gaps (FVG).
How it Works The core original logic is the "Bounce Validation" mechanism:
Zone Detection: It identifies institutional interest zones (Order Blocks and FVGs) using fractal pivots.
Bounce Confirmation: It waits for price to dip into a Demand Zone (or rally into a Supply Zone) and then forcibly reject it.
Zero Lag Entry: The signal is triggered only when momentum shifts away from the zone, confirmed by a Zero-Lag limit (custom logic to avoid late entries).
Features
Dynamic Order Blocks: Automatically draws and cleans up valid OBs.
FVG Detection: Highlights imbalances and detects re-tests.
Trend Filtering: Uses a multi-timeframe EMA stack to filter signals against the trend.
RSI Integration: Adds momentum confirmation to avoid catching falling knives.
Usage
Green Triangles: Buy signals (Bounce off Demand + Momentum Shift).
Red Triangles: Sell signals (Rejection from Supply + Momentum Shift).
Use this on 5M or 15M timeframes for scalping breakouts.

SPX Professional - EMA + RSI + Blue Targets## **1. Indicator Description: SPX Professional**
The **"SPX Professional"** is a sophisticated technical analysis tool designed primarily for the **S&P 500 (SPX)**. It combines three critical market pillars: **Trend Identification**, **Momentum Filtering**, and **Volatility-based Price Targets**.
### **Key Features**
* **Smart Bar Coloring:** Candles dynamically change color to provide instant visual bias:
* **Green:** Strong Bullish Momentum (Price > EMAs and RSI > 50).
* **Red:** Strong Bearish Momentum (Price < EMAs and RSI < 50).
* **Gray:** Neutral or Consolidating Market.
* **Blue Fibonacci Targets:** Using Daily Pivot logic, the indicator automatically plots three blue upside targets and two downside support levels based on Fibonacci ratios (0.382, 0.618, and 1.000).
* **CALL/PUT Signals:** Automated entry shapes appear when the 9 EMA crosses the 21 EMA, filtered by the RSI to prevent entering trades during extreme overbought or oversold conditions.
---
## **2. How to Use**
1. **Identify the Bias:** Observe the candle colors. Trade in the direction of the color (Buy when Green, Sell when Red).
2. **Entry Execution:** * **CALL Signal:** Look for the green triangle when the blue EMA crosses above the orange EMA.
* **PUT Signal:** Look for the red triangle when the blue EMA crosses below the orange EMA.
3. **Take Profit (Targets):** Use the blue dashed lines as your primary exit zones. **Target 1** is for conservative traders, while **Target 2 and 3** are for trend followers.
4. **Stop Loss:** A common practice is to place your stop loss behind the **Orange EMA (21)** or the most recent swing high/low.
---
## **3. Important Disclaimer**
> ** :** This indicator is designed as a **Trading Assistant only**. It is not a financial advisor, nor does it provide guaranteed buy/sell recommendations. Financial markets involve significant risk, and no technical tool can guarantee 100% accuracy. Users are solely responsible for their capital and should always combine this indicator with other forms of analysis, such as Support/Resistance levels and economic news.

Dragon Flow Arrows (LITE)🚀 DRAGON FLOW ARROWS — LITE | Smart Trend Engine + Clean Reversal Arrows
A lightweight but highly-optimized trend system designed for clean charts, powerful visual signals, and no-noise directional flow.
Built for traders who want simplicity, clarity, and professional-level momentum-filtered signals without over-complication.
🔥 Dragon Channel (Clean 3-Line Ribbon)
A smooth adaptive channel formed from ATR + EMA, giving you structural trend zones without clutter.
✅ Dragon Flow Gradient
A horizontal, color-shifted flow:
🟢 Bull flow → green glow
🔴 Bear flow → red glow
Automatic blend based on trend direction
Smooth visual transitions (no vertical stripes)
✅ Momentum-Filtered Arrows (No Spam)
BUY/SELL arrows only print when:
Price breaks outside the Dragon Channel
Momentum confirms (RSI + MACD filters)
Trend flips → one clean arrow per direction
Text labels sit outside the channel for better readability.
✅ Smart Header Panel
At the top of your chart:
📌 Trend: Uptrend / Downtrend / Neutral
⚡ Impulse Strength: Weak / Normal / Strong
📊 How to Use
Entry:
BUY Setup
Price moving above baseline
Dragon Flow turns bullish (cyan side)
Arrow appears below channel
SELL Setup
Price breaks below baseline
Dragon Flow turns bearish (magenta side)
Arrow pops above channel
Exit / Filter:
Opposite arrow
Flow color shift
Trend panel flips
Works on Forex, Crypto, Stocks, Indices — all timeframes.
Happy trading!

AI Chakra for Global Markets by Pooja🔮 AI Chakra for Global Markets by Pooja
Invite-Only | Rule-Based Market Structure & Momentum Indicator
🔍 Overview
AI Chakra for Global Markets is a closed-source, rule-based market analysis indicator designed to assist traders in understanding market structure, trend alignment, and momentum strength across multiple asset classes.
The script does not execute trades or provide fixed targets or stop-loss levels.
It is intended strictly as a decision-support and analytical tool, where signals appear only after predefined structural and momentum conditions are satisfied on a confirmed candle close.
The focus of the indicator is clarity, structure, and signal discipline, not signal frequency.
🌍 Supported Markets
The indicator is designed to work consistently across:
Commodities
Forex
Crypto
It adapts to both intraday and higher-timeframe charts through internal timeframe-aware logic.
⚙️ Trading Modes
🔹 Intraday Mode
Directional bias resets at the start of each new trading day
Prevents repeated same-direction signals within the same session
Useful for short-term, session-based analysis
🔹 Positional Mode
Direction remains active until an opposite signal is confirmed
No daily reset of signal direction
Designed for swing and positional context analysis
🧠 Core Indicator Framework
Signals are evaluated using a multi-layer rule engine, combining:
EMA for trend bias
VWAP for fair-price alignment
RSI for momentum validation
Supertrend for trend continuation context
No single indicator can trigger a signal independently.
Signals are generated only when multiple components align together.
🧱 Smart Money Concept (SMC) Logic
🔹 Break of Structure (BOS)
Detected using swing-based pivot highs and lows
Indicates continuation of the prevailing structural trend
BOS events are plotted only after candle close
🔹 Change of Character (CHoCH)
Detected when price breaks prior structure in the opposite direction
Used to identify potential trend shifts
CHoCH remains valid for a limited number of bars to allow contextual confirmation
BOS and CHoCH are structural reference events, not standalone trade signals.
🔁 Partial Signal Architecture
Instead of producing only final buy or sell signals, the indicator provides partial signals that represent early or developing conditions.
Partial signal categories include:
CHoCH + RSI alignment
EMA + VWAP + Supertrend + RSI
EMA + VWAP + RSI
Breakout condition (RSI intentionally excluded)
Partial signals are informational and designed to help traders track setup development.
They do not imply trade execution.
✅ Signal Validation & Filters
All signals are gated through multiple validation layers, including:
RSI-MA distance and slope filter to block weak momentum
ADX strength filter to avoid low-energy or sideways markets
Optional ADX grace logic, allowing signals to trigger if strength recovers within a defined window
Candle-direction confirmation
Optional bar-close confirmation to avoid intrabar repainting
📍 Pivot Points & Support-Resistance Context
The indicator integrates Traditional Pivot Points for structural reference.
Key characteristics:
Multi-timeframe pivot calculation (Daily, Weekly, Monthly, etc.)
Optional price labels
Controlled historical plotting to keep charts clean
Pivot levels are not used to generate signals.
They serve only as contextual support and resistance zones.
📐 Trendline Module (Optional)
An optional dynamic trendline module is included:
Trendlines are derived from swing highs and lows
Slope calculation can be based on ATR, Standard Deviation, or Linear Regression
Extended trendlines project forward for future price interaction
Trendlines are used as contextual structure, not direct entry triggers
📊 Multi-Timeframe Trend Dashboard
An optional dashboard provides a visual summary of trend bias across multiple timeframes.
Bullish / Bearish / Neutral classification
Dashboard is informational only
Does not generate signals or alerts
🔔 Alerts
Supports partial-signal alerts
Alerts trigger only on confirmed candle close
Webhook-ready JSON format supported
No intrabar or repainting alerts
👤 Intended Audience
This script is intended for traders who:
Follow market structure and Smart Money Concepts
Prefer rule-based, non-repainting analysis
Use partial signals for setup development
Apply their own execution and risk-management rules
🔒 Why Invite-Only?
The script uses:
Multi-stage state-based logic
Structure-driven BOS/CHoCH evaluation
Partial-to-signal progression
Internal filters designed to work together as a system
Source access is restricted to protect the internal implementation of these mechanisms.
⚠️ Disclaimer
This indicator is provided for educational and analytical purposes only.
It does not constitute financial advice or a recommendation to trade.
All trading decisions and risk management remain the responsibility of the user.

AI Intraday Astra by Pooja v27📘 AI Intraday Astra v27
Invite-Only Intraday Indicator for Structured Option Trading
🔍 Overview
AI Intraday Astra v27 is a closed-source intraday trading indicator designed for rule-based option trading.
The script is built around signal validation and rejection, not signal frequency.
Instead of relying on a single indicator or basic crossovers, the system uses a layered decision framework where momentum, volatility, trend bias, and market structure must align on the same confirmed candle before a signal is produced.
This approach helps reduce false entries that commonly occur in noisy or low-energy intraday conditions.
🧠 Core Architecture (How the script works)
1️⃣ Dual RSI Engine (Independent Buy & Sell Logic)
The script uses two fully independent RSI + RSI-MA engines:
One engine dedicated to buy-side conditions
One engine dedicated to sell-side conditions
Each engine maintains its own:
RSI calculation and smoothing
RSI-MA distance validation
Directional slope evaluation
Signal gap control
Reset state tracking
This separation avoids mixed signals and allows buy and sell logic to behave independently instead of sharing a single oscillator state.
2️⃣ Momentum Validation (Beyond simple crossovers)
RSI signals are evaluated only when:
RSI crosses its moving average
The distance between RSI and RSI-MA exceeds a minimum threshold
Optional directional slope confirms momentum expansion
This prevents weak, flat, or low-energy RSI crosses from generating signals.
3️⃣ Volatility & Market Energy Gate
Before any signal is allowed, the script evaluates:
ADX to confirm directional strength
ATR relative to price to confirm sufficient intraday volatility
If market energy is below defined thresholds, signals are automatically blocked.
4️⃣ Trend Bias & Mean-Price Alignment
Signals must align with:
EMA-based trend bias
VWAP position (buy above / sell below)
These act as directional filters to avoid counter-trend or mean-reversion entries during trending phases.
5️⃣ Trendline-Based Market Structure Filtering
The script includes an internal dynamic trendline module derived from swing highs and swing lows.
Key characteristics:
Swing-based trend detection with configurable sensitivity
Slope calculation based on ATR, Standard Deviation, or Linear Regression
Extended trendlines projected forward for price interaction
Optional use of trendlines as signal filters, not breakout triggers
When enabled, signals are allowed only when price interacts near relevant structural levels, helping avoid entries made far from market structure or during overextended moves.
6️⃣ Pivot Points & Support-Resistance Context
The script integrates Traditional Pivot Points for structural reference.
Features include:
Multi-timeframe pivot calculation (Daily, Weekly, Monthly, and higher)
Optional price labels
Controlled historical plotting to keep charts uncluttered
Pivot levels are not used to generate signals directly.
They serve as contextual support and resistance zones for assessing reactions, potential targets, or rejection areas alongside indicator signals.
7️⃣ Signal Control, Gaps & Reset Logic
To prevent over-trading and repeated entries:
Signals trigger only on confirmed candle close
Minimum bar gaps are enforced between same-side signals
After a signal, price must break and re-accept across EMA before another same-side entry is allowed
This reset mechanism helps control trade clustering during strong trends.
8️⃣ Session-Based Signal Management
The script can optionally:
Disable signals during selected intraday session windows
Resume normal logic once the session window ends
This helps avoid execution during high-noise or unstable market phases.
📊 Visual Components (Optional)
Users can enable or disable:
EMA
VWAP
Supertrend
Trendlines
Pivot levels
Visual elements are assistive only and do not alter the core signal logic.
🔔 Alerts
BUY / SELL alerts trigger only on final confirmed signals
Compatible with TradingView alerts and webhook-based automation
No intrabar or repainting behavior
👤 Intended Use
This script is designed for traders who:
Trade intraday options
Prefer confirmation-driven, rule-based entries
Focus on signal quality rather than quantity
Apply their own execution and risk-management rules
🔒 Why Invite-Only?
The script uses state-based logic, independent buy/sell engines, layered filtering, and reset mechanisms that go beyond standard indicator combinations.
Source access is restricted to protect the implementation of these internal processes.
⚠️ Disclaimer
This script is provided for educational and analytical purposes only.
It does not constitute financial advice or trade recommendations.
All trading decisions and risk management remain the responsibility of the user.

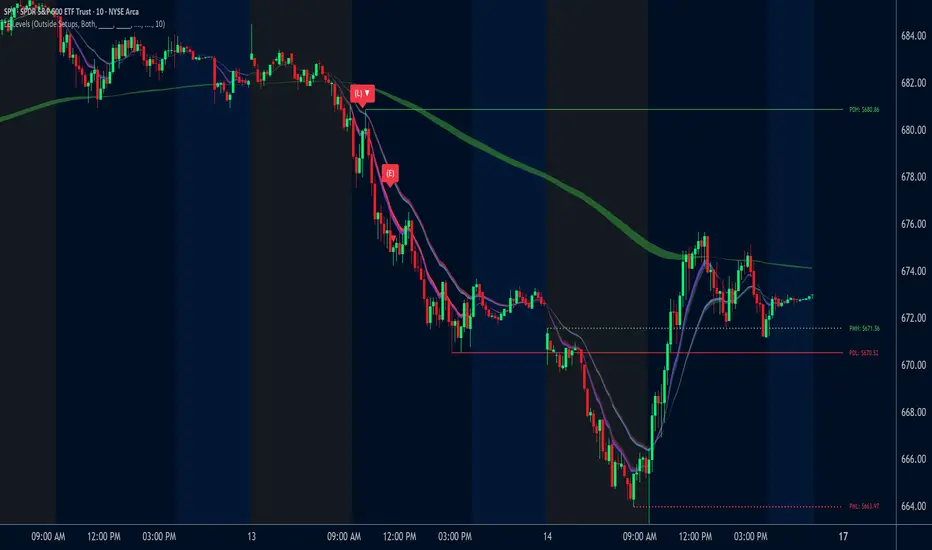
Unmitigated High Low (Day/MTF)
# Unmitigated High Low (Day/MTF)
## Overview
The **Unmitigated High Low (Day/MTF)** indicator tracks previous timeframe highs and lows that remain "unmitigated" (untouched by price) and displays them as dynamic support and resistance levels. By default, the indicator monitors daily highs and lows, making it ideal for intraday traders seeking key institutional levels, though it supports any multi-timeframe (MTF) interval. The indicator extends horizontal lines from each level until price touches them, creating visual "zones of interest" where price action may react.
## What It Does
This indicator identifies and plots two types of levels on your chart:
- **High Levels** (yellow lines) - Previous timeframe highs that price has not yet reached or exceeded
- **Low Levels** (cyan lines) - Previous timeframe lows that price has not yet broken below
Each time a new timeframe period completes (e.g., daily candle closes), the indicator captures that period's high and low and extends them forward as horizontal reference lines. When price finally touches or crosses these levels, they become "mitigated" - the line stops extending, becomes transparent (60% opacity), and is marked as historical.
## Key Features
**Multi-Timeframe Capability**: While defaulting to daily ("D") timeframe, you can switch to any interval (15-minute, 4-hour, weekly, etc.) to match your trading style.
**Band Visualization**: The indicator creates colored bands between the two most recent active levels in each direction - an upper band (purple fill) between the 1st and 2nd unmitigated highs, and a lower band (cyan fill) between the 1st and 2nd unmitigated lows.
**Visual Clarity**: Active unmitigated levels display in full color with customizable line width (default: 2), while mitigated levels fade to 60% transparency, helping you distinguish between current zones and historical references.
## How to Use It
Add the indicator to your chart and observe where unmitigated levels cluster - these zones often act as magnets for institutional order flow. The most recent unmitigated high represents overhead supply/resistance, while the most recent unmitigated low represents underlying demand/support. Traders commonly use these levels for:
- Entry zones when price approaches unmitigated levels with confluent signals
- Stop-loss placement beyond unmitigated levels to avoid institutional sweeps
- Profit targets at the next unmitigated level in the direction of your trade
- Breakout confirmation when price finally mitigates a long-standing level
The colored bands between the 1st and 2nd levels highlight "zones of friction" where price may consolidate or reverse before continuing its trend.
## Settings
**HL interval**: Select your desired timeframe (default: "D" for daily)
**High Line Color**: Color for unmitigated high levels (default: yellow #fff176)
**Low Line Color**: Color for unmitigated low levels (default: cyan #00bcd4)
**Upper Band Fill**: Fill color between 1st and 2nd highs (default: purple #880e4f at 85% transparency)
**Lower Band Fill**: Fill color between 1st and 2nd lows (default: cyan #00bcd4 at 85% transparency)
**Line Width**: Thickness of level lines (default: 2, range: 1-5)

Guru Dronacharya Option Pair Intelligence SystemGuru Dronacharya is an advanced options-pair analysis and intraday trading system designed for index and stock options (NIFTY, BANKNIFTY, and selected equities).
The script analyzes Call (CE) and Put (PE) option pairs simultaneously to identify:
• Low-risk option combinations
• Price overlap (compression) zones
• Breakout-based Buy Call / Buy Put opportunities
• Re-entry hedge signals
• Nth-candle angle-based momentum trades
It combines price structure, volatility and time-based geometry to produce high-probability directional option trades with automatic target projections.
IMPORTANT NOTES
• This is not a fully automated system
• Always use proper risk management
• Avoid trading during low-volume or sideways markets
• Designed for intraday option buying only
• Targets are projections, not guarantees
How to use : 1. Enter index/stock opening price in index/option stock price box.
2. Select the CE/PE pair from the center Grid Table.
3. Ensure that final condition showing "yes" in all section.
WHO SHOULD USE THIS?
✔ Intraday option buyers
✔ Traders who prefer structure + confirmation
✔ Users who want strike-selection assistance
✔ Traders avoiding emotional or random trades
DISCLAIMER
This indicator is for educational and analytical purposes only.
The author is not responsible for any financial losses.
Please consult a licensed financial advisor before trading.

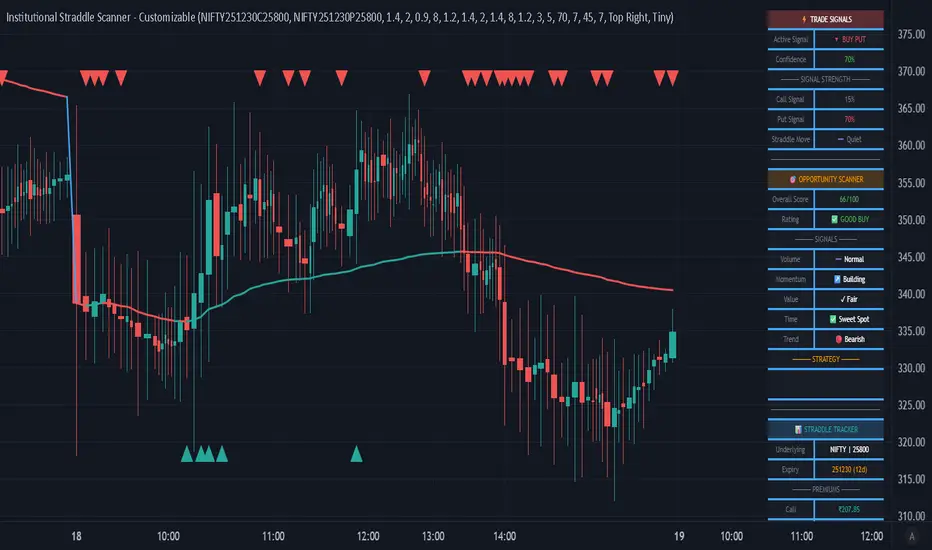
Institutional Straddle Scanner - Customizable
═══════════════════════════════════════════════════════════════
🎯 INSTITUTIONAL STRADDLE SCANNER - PROFESSIONAL EDITION
═══════════════════════════════════════════════════════════════
Advanced Options Trading Indicator with Customizable Buy Call & Buy Put Signals
📊 OVERVIEW
The Institutional Straddle Scanner is a professional-grade indicator designed for options traders who want to identify high-probability directional opportunities in Call and Put options. Built on institutional trading criteria, this indicator detects early momentum before major moves occur, giving you an edge in the options market.
Unlike traditional indicators that wait for price to cross VWAP or other lagging signals, this scanner uses a multi-factor analysis system that detects volume imbalances, premium momentum, sentiment shifts, and value opportunities in real-time.
🔥 KEY FEATURES
✅ DIRECTIONAL BUY SIGNALS
• 🚀 BUY CALL Signal - Green triangle appears when bullish criteria align
• 🔻 BUY PUT Signal - Red triangle appears when bearish criteria align
• Confidence scoring system (40-100%) with color-coded strength
• Early detection mode - no need to wait for VWAP crossover
✅ STRADDLE MOVEMENT DETECTION
• Detects when both Call and Put premiums start moving together
• Ideal for volatility expansion plays and earnings trades
• Shows exact movement percentage on dashboard
• Adjustable sensitivity and lookback period
✅ FULLY CUSTOMIZABLE CRITERIA
Every signal parameter is adjustable through the indicator settings:
🔹 BUY CALL CRITERIA (6 Factors)
1. Call Volume Dominance - Call volume > Put volume threshold
2. Call Premium Momentum - Minimum % price movement required
3. Bullish Sentiment (PCR) - Put-Call Ratio threshold for bullish bias
4. Call Undervalued - Premium below moving average by %
5. Straddle Above VWAP - Optional trend confirmation (disable for early signals)
6. Call Volume Spike - Volume vs average threshold
🔹 BUY PUT CRITERIA (6 Factors)
1. Put Volume Dominance - Put volume > Call volume threshold
2. Put Premium Momentum - Minimum % price movement required
3. Bearish Sentiment (PCR) - Put-Call Ratio threshold for bearish bias
4. Put Undervalued - Premium below moving average by %
5. Straddle Below VWAP - Optional trend confirmation (disable for early signals)
6. Put Volume Spike - Volume vs average threshold
✅ COMPREHENSIVE DASHBOARD
• Active signal display with confidence level
• Call and Put signal strength meters
• Straddle movement indicator
• Opportunity scanner with 6-factor scoring
• Real-time premium tracking (Call, Put, Straddle)
• Volume analysis with spike detection
• PCR (Put-Call Ratio) sentiment gauge
• Fully adjustable position and size
✅ PROFESSIONAL ALERTS
• BUY CALL Signal alert
• BUY PUT Signal alert
• Straddle Movement alert
• Strong opportunity alert (75+ score)
• VWAP crossover alert
📈 HOW TO USE
1️⃣ SETUP
• Add indicator to your TradingView chart
• Input your Call and Put option symbols in settings
• Choose your preferred criteria and thresholds
• Set minimum confidence level (lower = more signals)
2️⃣ SIGNAL INTERPRETATION
🚀 BUY CALL appears when:
- Call volume dominates Put volume
- Call premium showing upward momentum
- Market sentiment is bullish (low PCR)
- Call premium undervalued vs moving average
- Other enabled criteria are met
🔻 BUY PUT appears when:
- Put volume dominates Call volume
- Put premium showing upward momentum
- Market sentiment is bearish (high PCR)
- Put premium undervalued vs moving average
- Other enabled criteria are met
3️⃣ CONFIDENCE LEVELS
• 80-100% = 🟢 High conviction trade
• 70-79% = 🟡 Good opportunity
• 60-69% = 🟠 Moderate confidence
• Below 60% = ⚪ Wait for better setup
4️⃣ STRATEGY RECOMMENDATIONS
For Early Signals (Aggressive):
→ Set minimum confidence: 50-60%
→ Disable VWAP criteria
→ Lower momentum threshold: 1-2%
→ Enable straddle movement: 2-3%
→ Results: More signals, earlier entries
For Balanced Trading:
→ Set minimum confidence: 60-70% (default)
→ Keep VWAP criteria disabled
→ Momentum threshold: 2-3%
→ Straddle movement: 3-5%
→ Results: Good balance of quality and quantity
For High Quality (Conservative):
→ Set minimum confidence: 75-80%
→ Enable VWAP criteria
→ Momentum threshold: 3-5%
→ All volume criteria enabled
→ Results: Fewer but higher quality signals
⚙️ CUSTOMIZATION GUIDE
All criteria can be toggled ON/OFF and adjusted:
📌 Volume Thresholds (1.0-5.0x)
Control how much volume dominance is required
📌 Momentum % (0.5-10%)
Set minimum premium price movement needed
📌 PCR Thresholds
Adjust sentiment levels for bullish/bearish bias
📌 Value % (0-10%)
Define how undervalued premiums should be
📌 Confidence Level (40-100%)
Higher = fewer but stronger signals
Lower = more signals for active trading
📌 DTE Range (Days to Expiry)
Filter signals by option expiration timeframe
💡 USE CASES
1. Earnings Volatility Trading
Enable straddle movement detection to catch vol expansion
2. Directional Options Trading
Use Call/Put signals for directional bias entries
3. Premium Selling Entry Timing
Inverse the signals - sell when premiums spike above value
4. Spread Trading
Use signal strength differential for bull/bear spread setups
5. Institutional Flow Following
Volume dominance criteria tracks smart money movement
📊 WHAT MAKES THIS UNIQUE
✓ First indicator combining straddle analysis with directional signals
✓ Every parameter is adjustable - adapt to your trading style
✓ Early signal detection - don't wait for lagging indicators
✓ Institutional criteria - volume, sentiment, value, momentum
✓ Built-in opportunity scanner for overall market assessment
✓ Professional dashboard with real-time metrics
✓ Works on any timeframe (5m, 15m, 1H, 1D)
✓ Suitable for both day trading and swing trading
🎯 BEST PRACTICES
1. Use 5-15 minute timeframes for intraday trading
2. Verify DTE is in optimal range (7-45 days)
3. Check overall opportunity score before entering
4. Wait for confidence ≥70% for best risk/reward
5. Monitor straddle movement for volatility plays
6. Use in conjunction with price action and support/resistance
7. Set alerts to catch signals in real-time
⚠️ IMPORTANT NOTES
• This indicator is designed for Indian options (NSE/NFO)
• You must input correct Call and Put option symbols
• Signals are based on historical patterns and probabilities
• Always use proper risk management and position sizing
• Past performance does not guarantee future results
• Suitable for experienced options traders
🔔 ALERTS SETUP
1. Click "Add Alert" on the indicator
2. Choose desired alert condition:
- BUY CALL Signal
- BUY PUT Signal
- Straddle Moving
- Strong Buy Signal
3. Set notification preferences
4. Alert will fire when conditions are met
📚 RECOMMENDED SETTINGS FOR NIFTY OPTIONS
Intraday Trading (5-15min):
→ Minimum Confidence: 65%
→ Momentum: 2-3%
→ Volume threshold: 1.5-2.0x
→ Straddle movement: 3%
Swing Trading (1H-1D):
→ Minimum Confidence: 70%
→ Momentum: 3-5%
→ Volume threshold: 2.0-2.5x
→ Straddle movement: 5%
🎨 VISUAL FEATURES
• Color-coded candles (Bull/Bear)
• VWAP line with dynamic coloring
• Triangle markers for Buy signals on chart
• Professional dashboard with 3 sections:
1. Trade Signals (top)
2. Opportunity Scanner (middle)
3. Straddle Tracker (bottom)
• Movable and resizable table
• Clean, institutional-style interface
💼 WHO IS THIS FOR?
✓ Options day traders
✓ Options swing traders
✓ Institutional traders
✓ Professional options desks
✓ Traders using technical + options analysis
✓ Volume and sentiment-based traders
✓ Risk-defined options strategies
🚀 GETTING STARTED
1. Add indicator to chart
2. Input your option symbols (Call and Put)
3. Start with default settings
4. Observe signals for 1-2 days
5. Adjust criteria based on your preference
6. Set up alerts
7. Trade with confidence!
═══════════════════════════════════════════════════════════════
📧 FEEDBACK & SUPPORT
If you find this indicator valuable, please leave a comment and boost!
Your feedback helps improve future updates.
═══════════════════════════════════════════════════════════════
⚖️ DISCLAIMER
This indicator is for educational and informational purposes only. It should not be considered financial advice. Options trading involves substantial risk of loss. Always conduct your own research and consult with licensed financial advisors before making trading decisions. The creator of this indicator is not responsible for any trading losses incurred from using this tool.
═══════════════════════════════════════════════════════════════
📌 VERSION: 1.0
📅 RELEASE DATE: December 2025
🔧 PINE SCRIPT VERSION: 5
💻 COMPATIBLE: TradingView Premium/Pro/Pro+
═══════════════════════════════════════════════════════════════
#Options #OptionsTrading #CallOptions #PutOptions #Straddle #NIFTY #BankNIFTY
#TechnicalAnalysis #VolumeAnalysis #InstitutionalTrading #ProfessionalTrading
#TradingSignals #OptionsScanner #PutCallRatio #PCR #VWAP #VolatilityTrading
═══════════════════════════════════════════════════════════════
MSP Multi-TF Dashboard v4 EnhancedScan 4 Timeframes at Once for Trend, Momentum and Bias Alignment
This dashboard reads multiple timeframes simultaneously and scores each one for trend direction, RSI momentum, MACD confirmation, volume strength and ADX trend power. Instantly see if the market is aligned bullish, bearish or mixed.
What It Analyzes Per Timeframe:
- Trend: Price vs Fast EMA vs Slow EMA alignment
- RSI: Momentum above or below threshold
- MACD: Line vs Signal crossover direction
- Volume: Current vs 20-period average ratio
- ADX: Trend strength measurement
Dashboard Shows:
- Total bias score across all 4 TFs
- Individual trend, RSI, MACD, bias per TF
- Volume multiplier (1.2x means 20% above average)
- ADX strength values
- Alignment streak counter
- All-TF alignment status
Color Coded Cells:
- Green cells = Bullish signal
- Red cells = Bearish signal
- Gray cells = Neutral/mixed
- Brighter colors = Stronger signals
Chart Features:
- Background shading based on total bias
- BULL/BEAR markers when alignment triggers
- 4TF markers when all timeframes agree
- Customizable alert thresholds
Display Options:
- Full table with all metrics
- Compact mode for mobile
- Table position selector (any corner)
- Customizable colors and opacity
Best Used For:
- Multi-timeframe confluence trading
- Confirming trend direction before entry
- Avoiding trades against higher TF bias
- Finding high probability setups when all TFs align
Works on all markets and timeframes. Fully customizable settings.
Not financial advice. Always use proper risk management.

Daily Chart - VWMA Strategy SignalsIndicator uses Supertrend, RSI, EMA and VWMA to plot entry signals on the Daily chart

Weekly - VWMA Supertrend SignalsIndicators uses Supertrend, EMA, RSI and VWMA to filter for weekly chart entry signals

AKILLI ANALIZ TERMINALI (V20-REVIZE)SMART ANALYSIS TERMINAL (V20-ULTIMATE)
This indicator is a professional-grade analysis terminal designed for both strategic daily analysis (Swing Trade) and real-time intraday trading (Scalp/Day Trade). It allows you to perform a complete technical X-ray of the market on a single dashboard.
CORE FEATURES:
- Dual-Mode Hybrid Engine: Choose between "NIGHT (ANALYSIS)" or "IN-DAY (AGGRESSIVE)" modes in settings. Mathematical periods and target levels update automatically.
- Smart Scoring System: Blends RSI, MACD, EMA, ADX, and Volume data to produce 5 distinct signals from "VERY POSITIVE" to "VERY NEGATIVE."
- Symmetrical Visual Panel: Left panel displays Live Signal, Pivot Balance, Money Flow, and Target/Support; right panel focuses on RSI, Trend, Momentum, and Volume confirmation.
- Money Flow Algorithm: Detects institutional accumulation (Entry) or distribution (Exit) by analyzing price-volume correlation.
USER GUIDE:
1. NIGHT MODE: Use for evening analysis to plan for the next day. Based on EMA 20/50 and standard MACD values.
2. IN-DAY MODE: Use during live sessions on 5m and 15m charts. Catch instant momentum shifts with EMA 9/21 and aggressive settings.

FibLevel Size CalculatorThis skript calculates position sizes and new take profits for sizing into an long or short position with 3 entrys defined at custom fibonacci retracement levels.
TP: -0,272
Entry1: 0.382
Entry2: 0.618
Entry3: 0.83
SL: 1.05
Expected RR per trade is 0.2 with a High Win rate definitly profitable.
Search for an established trend on the higher timeframe, drop to the smaller ones and look for correction waves. Once they break to the trenddirection of the higher timeframe take the fib from lowest to highes point. Draw a fib level on the chart and use the Indicator to define these Levels above. The calculator gives you the Margin to use in each position, and will check that you will not get liquidated an that you have enough margin. It tells you the new TP for Limit2 and Limit3 if they get hit so you can get out of the trade full TP with a small bounce.
Inputs:
Account Balance, Risk Percentage, and Leverage: These inputs are used to calculate the position size and risk.
Entry 1, Entry 2, Entry 3, Take Profit (TP), and Stop Loss (SL): These prices are used for calculating position sizes, risk, and profit for up to three entry points.
Calculations:
Risk Amount: Calculated based on the account balance and risk percentage.
Position Sizes (Qty): For each entry point, the position size is determined. The second and third entries have a multiplier (3x for Entry 2, 5x for Entry 3) compared to the first.
Stop Loss and Profit Calculation: The script calculates the potential profit and adjusts the TP levels based on the average entries for Limit 2 and Limit 3.
Margin Calculation: Margin requirements for each position are calculated based on leverage.
Output:
Table Display: A table shows key values like entry prices, position sizes, TP levels, potential profit, and margin requirements for each limit.
Warnings: It includes a liquidation warning and a check for whether the account is at risk of liquidation based on leverage.
Position Type: It automatically detects if the trade is a long or short based on the relationship between TP and SL.
Visualization:
Lines: It draws horizontal lines on the chart to visually represent the entry, TP, and SL levels.
Overall, this script is designed to help traders manage risk and calculate position sizes for multi-level entries using leverage.
Pls drop feedback in the comments.

Nef33 Forex & Crypto Trading Signals PRO
1. Understanding the Indicator's Context
The indicator generates signals based on confluence (trend, volume, key zones, etc.), but it does not include predefined SL or TP levels. To establish them, we must:
Use dynamic or static support/resistance levels already present in the script.
Incorporate volatility (such as ATR) to adjust the levels based on market conditions.
Define a risk/reward ratio (e.g., 1:2).
2. Options for Determining SL and TP
Below, I provide several ideas based on the tools available in the script:
Stop Loss (SL)
The SL should protect you from adverse movements. You can base it on:
ATR (Volatility): Use the smoothed ATR (atr_smooth) multiplied by a factor (e.g., 1.5 or 2) to set a dynamic SL.
Buy: SL = Entry Price - (atr_smooth * atr_mult).
Sell: SL = Entry Price + (atr_smooth * atr_mult).
Key Zones: Place the SL below a support (for buys) or above a resistance (for sells), using Order Blocks, Fair Value Gaps, or Liquidity Zones.
Buy: SL below the nearest ob_lows or fvg_lows.
Sell: SL above the nearest ob_highs or fvg_highs.
VWAP: Use the daily VWAP (vwap_day) as a critical level.
Buy: SL below vwap_day.
Sell: SL above vwap_day.
Take Profit (TP)
The TP should maximize profits. You can base it on:
Risk/Reward Ratio: Multiply the SL distance by a factor (e.g., 2 or 3).
Buy: TP = Entry Price + (SL Distance * 2).
Sell: TP = Entry Price - (SL Distance * 2).
Key Zones: Target the next resistance (for buys) or support (for sells).
Buy: TP at the next ob_highs, fvg_highs, or liq_zone_high.
Sell: TP at the next ob_lows, fvg_lows, or liq_zone_low.
Ichimoku: Use the cloud levels (Senkou Span A/B) as targets.
Buy: TP at senkou_span_a or senkou_span_b (whichever is higher).
Sell: TP at senkou_span_a or senkou_span_b (whichever is lower).
3. Practical Implementation
Since the script does not automatically draw SL/TP, you can:
Calculate them manually: Observe the chart and use the levels mentioned.
Modify the code: Add SL/TP as labels (label.new) at the moment of the signal.
Here’s an example of how to modify the code to display SL and TP based on ATR with a 1:2 risk/reward ratio:
Modified Code (Signals Section)
Find the lines where the signals (trade_buy and trade_sell) are generated and add the following:
pinescript
// Calculate SL and TP based on ATR
atr_sl_mult = 1.5 // Multiplier for SL
atr_tp_mult = 3.0 // Multiplier for TP (1:2 ratio)
sl_distance = atr_smooth * atr_sl_mult
tp_distance = atr_smooth * atr_tp_mult
if trade_buy
entry_price = close
sl_price = entry_price - sl_distance
tp_price = entry_price + tp_distance
label.new(bar_index, low, "Buy: " + str.tostring(math.round(bull_conditions, 1)), color=color.green, textcolor=color.white, style=label.style_label_up, size=size.tiny)
label.new(bar_index, sl_price, "SL: " + str.tostring(math.round(sl_price, 2)), color=color.red, textcolor=color.white, style=label.style_label_down, size=size.tiny)
label.new(bar_index, tp_price, "TP: " + str.tostring(math.round(tp_price, 2)), color=color.blue, textcolor=color.white, style=label.style_label_up, size=size.tiny)
if trade_sell
entry_price = close
sl_price = entry_price + sl_distance
tp_price = entry_price - tp_distance
label.new(bar_index, high, "Sell: " + str.tostring(math.round(bear_conditions, 1)), color=color.red, textcolor=color.white, style=label.style_label_down, size=size.tiny)
label.new(bar_index, sl_price, "SL: " + str.tostring(math.round(sl_price, 2)), color=color.red, textcolor=color.white, style=label.style_label_up, size=size.tiny)
label.new(bar_index, tp_price, "TP: " + str.tostring(math.round(tp_price, 2)), color=color.blue, textcolor=color.white, style=label.style_label_down, size=size.tiny)
Code Explanation
SL: Calculated by subtracting/adding sl_distance to the entry price (close) depending on whether it’s a buy or sell.
TP: Calculated with a double distance (tp_distance) for a 1:2 risk/reward ratio.
Visualization: Labels are added to the chart to display SL (red) and TP (blue).
4. Practical Strategy Without Modifying the Code
If you don’t want to modify the script, follow these steps manually:
Entry: Take the trade_buy or trade_sell signal.
SL: Check the smoothed ATR (atr_smooth) on the chart or calculate a fixed level (e.g., 1.5 times the ATR). Also, review nearby key zones (OB, FVG, VWAP).
TP: Define a target based on the next key zone or multiply the SL distance by 2 or 3.
Example:
Buy at 100, ATR = 2.
SL = 100 - (2 * 1.5) = 97.
TP = 100 + (2 * 3) = 106.
5. Recommendations
Test in Demo: Apply this logic in a demo account to adjust the multipliers (atr_sl_mult, atr_tp_mult) based on the market (forex or crypto).
Combine with Zones: If the ATR-based SL is too wide, use the nearest OB or FVG as a reference.
Risk/Reward Ratio: Adjust the TP based on your tolerance (1:1, 1:2, 1:3)

Risk & Position DashboardRisk & Position Dashboard
Overview
The Risk & Position Dashboard is a comprehensive trading tool designed to help traders calculate optimal position sizes, manage risk, and visualize potential profit/loss scenarios before entering trades. This indicator provides real-time calculations for position sizing based on account size, risk percentage, and stop-loss levels, while displaying multiple take-profit targets with customizable risk-reward ratios.
Key Features
Position Sizing & Risk Management:
Automatic position size calculation based on account size and risk percentage
Support for leveraged trading with maximum leverage limits
Fractional shares support for brokers that allow partial share trading
Real-time fee calculation including entry, stop-loss, and take-profit fees
Break-even price calculation including trading fees
Multi-Target Profit Management:
Support for up to 3 take-profit levels with individual portion allocations
Customizable risk-reward ratios for each take-profit target
Visual profit/loss zones displayed as colored boxes on the chart
Individual profit calculations for each take-profit level
Visual Dashboard:
Clean, customizable table display showing all key metrics
Configurable label positioning and styling options
Real-time tracking of whether stop-loss or take-profit levels have been reached
Color-coded visual zones for easy identification of risk and reward areas
Advanced Configuration:
Comprehensive input validation and error handling
Support for different chart timeframes and symbols
Customizable colors, fonts, and display options
Hide/show individual data fields for personalized dashboard views
How to Use
Set Account Parameters: Configure your account size, maximum risk percentage per trade, and trading fees in the "Account Settings" section.
Define Trade Setup: Use the "Entry" time picker to select your entry point on the chart, then input your entry price and stop-loss level.
Configure Take Profits: Set your desired risk-reward ratios and portion allocations for each take-profit level. The script supports 1-3 take-profit targets.
Analyze Results: The dashboard will automatically calculate and display position size, number of shares, potential profits/losses, fees, and break-even levels.
Visual Confirmation: Colored boxes on the chart show profit zones (green) and loss zones (red), with lines extending to current price levels.
Reset Entry and SL:
You can easily reset the entry and stop-loss by clicking the "Reset points..." button from the script's "More" menu.
This is useful if you want to quickly clear your current trade setup and start fresh without manually adjusting the points on the chart.
Calculations
The script performs sophisticated calculations including:
Position size based on risk amount and price difference between entry and stop-loss
Leverage requirements and position amount calculations
Fee-adjusted risk-reward ratios for realistic profit expectations
Break-even price including all trading costs
Individual profit calculations for partial position closures
Detailed Take-Profit Calculation Formula:
The take-profit prices are calculated using the following mathematical formula:
// Core variables:
// risk_amount = account_size * (risk_percentage / 100)
// total_risk_per_share = |entry_price - sl_price| + (entry_price * fee%) + (sl_price * fee%)
// shares = risk_amount / total_risk_per_share
// direction_factor = 1 for long positions, -1 for short positions
// Take-profit calculation:
net_win = total_risk_per_share * shares * RR_ratio
tp_price = (net_win + (direction_factor * entry_price * shares) + (entry_price * fee% * shares)) / (direction_factor * shares - fee% * shares)
Step-by-step example for a long position (based on screenshot):
Account Size: 2,000 USDT, Risk: 2% = 40 USDT
Entry: 102,062.9 USDT, Stop Loss: 102,178.4 USDT, Fee: 0.06%
Risk per share: |102,062.9 - 102,178.4| + (102,062.9 × 0.0006) + (102,178.4 × 0.0006) = 115.5 + 61.24 + 61.31 = 238.05 USDT
Shares: 40 ÷ 238.05 = 0.168 shares (rounded to 0.17 in display)
Position Size: 0.17 × 102,062.9 = 17,350.69 USDT
Position Amount (with 9x leverage): 17,350.69 ÷ 9 = 1,927.85 USDT
For 2:1 RR: Net win = 238.05 × 0.17 × 2 = 80.94 USDT
TP1 price = (80.94 + (1 × 102,062.9 × 0.17) + (102,062.9 × 0.0006 × 0.17)) ÷ (1 × 0.17 - 0.0006 × 0.17) = 101,464.7 USDT
For 3:1 RR: TP2 price = 101,226.7 USDT (following same formula with RR=3)
This ensures that after accounting for all fees, the actual risk-reward ratio matches the specified target ratio.
Risk Management Features
Maximum Trade Amount: Optional setting to limit position size regardless of account size
Leverage Limits: Built-in maximum leverage protection
Fee Integration: All calculations include realistic trading fees for accurate expectations
Validation: Automatic checking that take-profit portions sum to 100%
Historical Tracking: Visual indication when stop-loss or take-profit levels are reached (within last 5000 bars)
Understanding Max Trade Amount - Multiple Simultaneous Trades:
The "Max Trade Amount" feature is designed for traders who want to open multiple positions simultaneously while maintaining proper risk management. Here's how it works:
Key Concept:
- Risk percentage (2%) always applies to your full Account Size
- Max Trade Amount limits the capital allocated per individual trade
- This allows multiple trades with full risk on each trade
Example from Screenshot:
Account Size: 2,000 USDT
Max Trade Amount: 500 USDT
Risk per Trade: 2% × 2,000 = 40 USDT per trade
Stop Loss Distance: 0.11% from entry
Result: Position Size = 17,350.69 USDT with 35x leverage
Total Risk (including fees): 40.46 USDT
Multiple Trades Strategy:
With this setup, you can open:
Trade 1: 40 USDT risk, 495.73 USDT position amount (35x leverage)
Trade 2: 40 USDT risk, 495.73 USDT position amount (35x leverage)
Trade 3: 40 USDT risk, 495.73 USDT position amount (35x leverage)
Trade 4: 40 USDT risk, 495.73 USDT position amount (35x leverage)
Total Portfolio Exposure:
- 4 simultaneous trades = 4 × 495.73 = 1,982.92 USDT position amount
- Total risk exposure = 4 × 40 = 160 USDT (8% of account)

PivotBoss VWAP Bands (Auto TF) - FixedWhat this indicator shows (high level)
The indicator plots a VWAP line and three bands above (R1, R2, R3) and three bands below (S1, S2, S3).
Band spacing is computed from STD(abs(VWAP − price), N) and multiplied by 1, 2 and 3 to form R1–R3 / S1–S3. The script is timeframe-aware: on 30m/1H charts it uses Weekly VWAP and weekly bands; on Daily charts it uses Monthly VWAP and monthly bands; otherwise it uses the session/chart VWAP.
VWAP = the market’s volume-weighted average price (a measure of fair value). Bands = volatility-scaled zones around that fair value.
Trading idea — concept summary
VWAP = fair value. Price above VWAP implies bullish bias; below VWAP implies bearish bias.
Bands = graded overbought/oversold zones. R1/S1 are near-term limits, R2/S2 are stronger, R3/S3 are extreme.
Use trend alignment + price action + volume to choose higher-probability trades. VWAP bands give location and magnitude; confirmations reduce false signals.
Entry rules (multiple strategies with examples)
A. Momentum breakout (trend-following) — preferred on trending markets
Setup: Price consolidates near or below R1 and then closes above R1 with above-average volume. Chart: 30m/1H (Weekly VWAP) or Daily (Monthly VWAP) depending on your timeframe.
Entry: Enter long at the close of the breakout bar that closes above R1.
Stop-loss: Place initial stop below the higher of (VWAP or recent swing low). Example: if price broke R1 at ₹1,200 and VWAP = ₹1,150, set stop at ₹1,145 (5 rupee buffer below VWAP) or below the last swing low if that is wider.
Target: Partial target at R2, full target at R3. Trail stop to VWAP or to R1 after price reaches R2.
Example numeric: Weekly VWAP = ₹1,150, R1 = ₹1,200, R2 = ₹1,260. Buy at ₹1,205 (close above R1), stop ₹1,145, target1 ₹1,260 (R2), target2 ₹1,320 (R3).
B. Mean-reversion fade near bands — for range-bound markets
Setup: Market is not trending (VWAP flatish). Price rallies up to R2 or R3 and shows rejection (pin bar, bearish engulfing) on increasing or neutral volume.
Entry: Enter short after a confirmed rejection candle that fails to sustain above R2 or R3 (prefer confirmation: close back below R1 or below the rejection candle low).
Stop-loss: Just above the recent high (e.g., 1–2 ATR or a fixed buffer above R2/R3).
Target: First target VWAP, second target S1. Reduce size if taking R3 fade as it’s an extreme.
Example numeric: VWAP = ₹950, R2 = ₹1,020. Price spikes to ₹1,025 and forms a bearish engulfing candle. Enter short at ₹1,015 after the next close below ₹1,020. Stop at ₹1,035, target VWAP ₹950.
C. Pullback entries in trending markets — higher probability
Setup: Price is above VWAP and trending higher (higher highs and higher lows). Price pulls back toward VWAP or S1 with decreasing downside volume and a reversal candle forms.
Entry: Long when price forms a bullish reversal (hammer/inside-bar) with a close back above the pullback candle.
Stop-loss: Below the pullback low (or below S2 if a larger stop is justified).
Target: VWAP then R1; if momentum resumes, trail toward R2/R3.
Example numeric: Price trending above Weekly VWAP at ₹1,400; pullback to S1 at ₹1,360. Enter long at ₹1,370 when a bullish candle closes; stop at ₹1,350; first target VWAP ₹1,400, second target R1 ₹1,450.
Exit rules and money management
Basic exit hierarchy
Hard stop exit — when price hits initial stop-loss. Always use.
Target exit — take partial profits at R1/R2 (for longs) or S1/S2 (for shorts). Use trailing stops for the remainder.
VWAP invalidation — if you entered long above VWAP and price returns and closes significantly below VWAP, consider exiting (condition depends on timeframe and trade size).
Price action exit — reversal patterns (strong opposite candle, bearish/bullish engulfing) near targets or beyond signals to exit.
Trailing rules
After price reaches R2, move stop to breakeven + a small buffer or to VWAP.
After price reaches R3, trail by 1 ATR or lock a defined profit percentage.
Position sizing & risk
Risk per trade: commonly 0.5–2% of account equity.
Determine position size by RiskAmount ÷ (EntryPrice − StopPrice).
If the stop distance is large (e.g., trading R3 fades), reduce position size.
Filters & confirmation (to reduce false signals)
Volume filter: For breakouts, require volume above short-term average (e.g., >20-period average). Breakouts on low volume are suspect.
Trend filter: Only take breakouts in the direction of the higher-timeframe trend (for example, use Daily/Weekly trend when trading 30m/1H).
Candle confirmation: Prefer entries on close of the confirming candle (not intrabar noise).
Multiple confirmations: When R1 break happens but RSI/plotted momentum indicator does not confirm, treat signal as lower probability.
Special considerations for timeframe-aware logic
On 30m/1H the script uses Weekly VWAP/bands. That means band levels change only on weekly candles — they are strong, structural levels. Treat R1/R2/R3 as significant and expect fewer, stronger signals.
On Daily, the script uses Monthly VWAP/bands. These are wider; trades should allow larger stops and smaller position sizes (or be used for swing trades).
On other intraday charts you get session VWAP (useful for intraday scalps).
Example: If you trade 1H and the Weekly R1 is at ₹2,400 while session VWAP is ₹2,350, a close above Weekly R1 represents a weekly-level breakout — prefer that for swing entries rather than scalps.
Example trade walkthrough (step-by-step)
Context: 1H chart, auto-mapped → Weekly VWAP used.
Weekly VWAP = ₹3,000; R1 = ₹3,080; R2 = ₹3,150.
Price consolidates below R1. A large bullish candle closes at ₹3,085 with volume 40% above the 20-bar average.
Entry: Buy at close ₹3,085.
Stop: Place stop at ₹2,995 (just under Weekly VWAP). Risk = ₹90.
Position size: If risking ₹900 per trade → size = 900 ÷ 90 = 10 units.
Targets: Partial take-profit at R2 = ₹3,150; rest trailed with stop moved to breakeven after R2 is hit.
If price reverses and closes below VWAP within two bars, exit immediately to limit drawdown.
When to avoid trading these signals
High-impact news (earnings, macro announcements) that can gap through bands unpredictably.
Thin markets with low volume — VWAP loses significance when volumes are extremely low.
When weekly/monthly bands are flat but intraday price is volatile without clear structure — prefer session VWAP on smaller timeframes.
Alerts & automation suggestions
Alert on close above R1 / below S1 (use the built-in alertcondition the script adds). For higher-confidence alerts, require volume filter in the alert condition.
Automated order rules (if you automate): use limit entry at breakout close plus a small slippage buffer, immediate stop order, and OCO for TP and SL.

AI Strat ATR Dinamico + ADX + Trend Adaptivo (No Repaint)Below is a fully self-contained, English-language description of every input, function, and logical block inside the “AI Strat ATR Dinamico + ADX + Trend Adaptivo (No Repaint)” indicator. You can copy and paste this into TradingView’s “Description” field when you publish, without exposing any Pine code.
---
## Indicator Name and Purpose
**Name (Short Title):**
AI Strat Adaptive v3 (NoRepaint)
**Overview:**
This indicator combines multiple technical tools—RSI, EMA, ATR (with a dynamic multiplier), ADX/DI, and an “AI‐style” scoring mechanism—to generate trend-filtered and reversal signals. It also optionally confirms signals on a higher timeframe, dynamically adjusts its sensitivity based on volatility, and plots intrabar stop‐loss (SL) and take‐profit (TP) levels derived from ATR. Special care has been taken to ensure that no signals “repaint” (i.e., once drawn on a closed bar, they never disappear or shift).
---
## 1. Main Inputs
All of the inputs appear in the Settings dialog for the published indicator. Below is a detailed explanation of each input, grouped by logical category.
### A. RSI & EMA Base Parameters
1. **RSI Length (Base)**
* **Input type:** Integer (default 14)
* **Description:** Number of bars used to calculate the Relative Strength Index (RSI). A shorter RSI reacts more quickly to price changes; a longer RSI is smoother.
2. **RSI Overbought Threshold**
* **Input type:** Integer (default 60)
* **Description:** If the RSI value rises above this level, it contributes a “sell” signal component. You can adjust this (e.g., 70) to make your system more conservative.
3. **RSI Oversold Threshold**
* **Input type:** Integer (default 40)
* **Description:** If the RSI falls below this level, it contributes a “buy” signal component. Raising this threshold (e.g., 50) makes the strategy more aggressive in seeking reversals.
4. **EMA Length (Base)**
* **Input type:** Integer (default 20)
* **Description:** Number of bars for the Exponential Moving Average (EMA). A shorter EMA will produce more frequent crossovers, a longer EMA is smoother.
### B. ATR & Volatility Filter Parameters
5. **ATR Length (Base)**
* **Input type:** Integer (default 14)
* **Description:** Number of bars to calculate Average True Range (ATR). The ATR is used both for measuring volatility and for dynamic SL/TP levels.
6. **ATR SMA Length**
* **Input type:** Integer (default 50)
* **Description:** Number of bars to compute a Simple Moving Average of the ATR itself. This gives a baseline of “normal” volatility. If ATR rises significantly above this SMA, the indicator treats the market as “high volatility.”
7. **ATR Multiplier Base**
* **Input type:** Float (default 1.2, step 0.1)
* **Description:** Base multiplier for ATR when filtering for volatility. The actual threshold is computed as `ATR_SMA × (ATR_Multiplier Base) × sqrt(current_ATR / ATR_SMA)`. In other words, the multiplier becomes larger if volatility is rising, and smaller if volatility is falling.
8. **Disable Volatility Filter**
* **Input type:** Boolean (default false)
* **Description:** If enabled (true), the indicator will ignore any volatility‐based filtering, using signals regardless of ATR behavior. If disabled (false), signals only fire when ATR > (ATR\_SMA × dynamic multiplier).
### C. Price-Change & “AI Score” Parameters
9. **Price Change Period (bars)**
* **Input type:** Integer (default 3)
* **Description:** The number of bars back to measure percentage price change. Used to ensure that a “trend” signal is accompanied by a sufficiently positive (for longs) or negative (for shorts) price movement over this many bars.
10. **Base AI Score Threshold**
* **Input type:** Float (default 0.1)
* **Description:** The indicator computes a composite “AI-style” score by combining the RSI signal (overbought/oversold) and an EMA crossover signal. Only if the absolute value of that composite score exceeds this threshold will a trend signal be eligible. Raising it makes signals rarer but (potentially) higher-conviction.
### D. SMA “ICT” Trend Filter Parameters
11. **ICT SMA Long Length (Base)**
* **Input type:** Integer (default 50)
* **Description:** Number of bars for the “long” Simple Moving Average (SMA) used in the internal trend filter. Typically, price must be above this SMA (and ADX must be strong) to confirm an uptrend, or below it (and ADX strong) to confirm a downtrend.
12. **ICT SMA Short1 Length (Base)**
* **Input type:** Integer (default 10)
* **Description:** Secondary “fast” SMA used both for reversal logic (e.g., price crossing above it can count as a bullish reversal) and part of the internal trend confirmation.
13. **ICT SMA Short2 Length (Base)**
* **Input type:** Integer (default 20)
* **Description:** A second “medium” SMA used for reversal triggers (e.g., crossovers or crossunders alongside RSI conditions).
### E. ADX & DI Parameters
14. **Base ADX Length**
* **Input type:** Integer (default 14)
* **Description:** Number of bars for the ADX (Average Directional Index) moving averages, which measure trend strength. The same length is used for +DI and –DI smoothing.
15. **Base ADX Threshold**
* **Input type:** Float (default 25.0, step 0.5)
* **Description:** If ADX > this threshold and +DI > –DI, we consider an uptrend; if ADX > this threshold and –DI > +DI, we consider a downtrend. Raising this value demands stronger trends to qualify.
### F. Sensitivity & Cooldown
16. **Sensitivity (0–1)**
* **Input type:** Float between 0.0 and 1.0 (default 0.5)
* **Description:** A general “mixture” parameter used internally to weight how aggressively the indicator leans into trend versus reversal. In practice, the code uses it to fine-tune exact thresholds for switching between trend and reversal conditions. You can leave it at 0.5 unless you want to bias more heavily toward either regime.
17. **Base Cooldown Bars Between Signals**
* **Input type:** Integer (default 5, min 0)
* **Description:** Once a long or short signal fires, the indicator will wait at least this many bars before allowing a new signal in the same direction. Prevents “signal flipping” on each bar. A higher number forces fewer, more spaced-out entries.
18. **Trend Confirmation Bars**
* **Input type:** Integer (default 3, min 1)
* **Description:** After the directional filters (+DI/–DI cross, price vs. SMA), the indicator still requires that price remains on the same side of the long SMA for at least this many consecutive bars before confirming “trend up” or “trend down.” Larger values smooth out false breakouts but may lag signals.
### G. Higher Timeframe Confirmation
19. **Use Higher Timeframe Confirmation**
* **Input type:** Boolean (default true)
* **Description:** If true, the indicator will request a block of values (SMA, +DI, –DI, ADX) from a higher timeframe (default 60 minutes) and require that the higher timeframe is also in agreement (strong uptrend or strong downtrend) before confirming your current-timeframe trend. This helps filter out lower-timeframe noise.
20. **Higher Timeframe (TF) for Confirmation**
* **Input type:** Timeframe (default “60”)
* **Description:** The chart timeframe (e.g., 5, 15, 60 minutes) whose trend conditions must also be true. It’s sent through a `request.security(..., lookahead=barmerge.lookahead_off)` call so that it never “paints ahead.”
### H. Dynamic TP/SL Parameters
21. **TP as ATR Multiple**
* **Input type:** Float (default 2.0, step 0.1)
* **Description:** When a trade is open, the “take-profit” price is determined by looking at the highest high (for longs) or lowest low (for shorts) observed since entry, and then plotting a cross (“X”) at that level when the trend finally flips. This is purely for display. However, separate from that, this parameter can be adapted if you want a strictly ATR–based TP. In the “Minimal” version, TP is ≈ (highest high) once trend inverts, but you could rewrite it to use `entry_price + ATR×TP_Multiplier`.
22. **SL as ATR Multiple**
* **Input type:** Float (default 1.0, step 0.1)
* **Description:** While in a trade, a trailing SL line is plotted each bar. Its value is always `entry_price ± (ATR × SL_Multiplier)`. When the trend inverts, the SL no longer updates, and you see it on the chart.
### I. Display and Mode Options
23. **Show Debug Lines**
* **Input type:** Boolean (default true)
* **Description:** When enabled, the indicator will plot all intermediate lines—ATR SMA, ATR Threshold, +DI, –DI, ADX (current and HTF), HTF SMA, etc.—so that you can diagnose exactly what’s happening. Turn this off to hide all debug information and only see entry/exit shapes.
24. **Enable Scalping Mode**
* **Input type:** Boolean (default false)
* **Description:** If true, many of the “base” parameters are halved (e.g., RSI length becomes 7 instead of 14, ATR length becomes 7 instead of 14, ADX length becomes 7, etc.), and the ADX threshold is multiplied by 0.8. This makes all oscillators and moving averages more reactive, suited for very short-term (scalping) setups.
---
## 2. Core Calculation Blocks
Below is a high-level description of each logical block (in code order), translated from Pine into conceptual steps.
### A. Adjust Inputs if “Scalping Mode” Is On
If **Scalping Mode** = true, then:
* `RSI_Length` becomes `max(1, round(Base_RSI_Length / 2))`
* `EMA_Length` becomes `max(1, round(Base_EMA_Length / 2))`
* `ATR_Length` becomes `max(1, round(Base_ATR_Length / 2))`
* `Price_Change_Period` becomes `max(1, round(Base_Price_Change_Period / 2))`
* `SMA_Long_Length`, `SMA_Short1_Length`, and `SMA_Short2_Length` are each halved (minimum 1).
* `ADX_Length` = `max(1, round(Base_ADX_Length / 2))`
* `ADX_Threshold` = `Base_ADX_Threshold × 0.8`
* `Cooldown_Bars` = `max(0, round(Base_Cooldown_Bars / 2))`
Otherwise, all adjusted lengths = their base values.
### B. RSI, EMA & “AI Score” on Current Timeframe
1. **Compute RSI:**
* Uses the (possibly adjusted) `RSI_Length`.
* Denote this as `RSI_Value`.
2. **Compute ATR & Its SMA:**
* `ATR_Value` = `ta.atr(ATR_Length)`.
* `ATR_SMA` = `ta.sma(ATR_Value, ATR_SMA_Length)`.
* Then define `Volatility_Increase` = (`ATR_Value > ATR_SMA`).
* If the volatility has increased, the weighting of RSI vs. EMA changes.
3. **Compute Weights:**
* If `Volatility_Increase == true`, then:
* `RSI_Weight = 0.7`
* `EMA_Weight = 0.3`
* Otherwise:
* `RSI_Weight = 0.3`
* `EMA_Weight = 0.7`
4. **RSI Signal Component (`RSI_Sig`):**
* If `RSI_Value > RSI_Overbought`, then `RSI_Sig = –1`.
* Else if `RSI_Value < RSI_Oversold`, then `RSI_Sig = +1`.
* Otherwise, `RSI_Sig = 0`.
5. **EMA Value & Signal Component (`EMA_Sig`):**
* `EMA_Value` = `ta.ema(close, EMA_Length)`.
* `EMA_Sig = +1` if the current close crosses **above** the EMA; `EMA_Sig = –1` if the current close crosses **below** the EMA; else `0`.
6. **Compute Raw “AI Score”:**
$$
Raw\_AI = (RSI\_Sig \times RSI\_Weight)\;+\;(EMA\_Sig \times EMA\_Weight)
$$
Then,
$$
AI\_Score = \frac{Raw\_AI}{(RSI\_Weight + EMA\_Weight)}
$$
(This normalization ensures the score always ranges between –1 and +1 if both weights sum to 1.)
### C. Dynamic ATR Multiplier & Volatility Filter
1. **Volatility Factor:**
$$
Volatility\_Factor = \frac{ATR\_Value}{ATR\_SMA}
$$
2. **Dynamic ATR Multiplier:**
$$
ATR\_Multiplier = ATR\_Multiplier\_Base \times \sqrt{Volatility\_Factor}
$$
3. **High Volatility Condition (`High_Volatility`):**
* If `Disable_Volatility_Filter == true`, then treat `High_Volatility = true` always.
* Else, `High_Volatility = (ATR_Value > ATR_SMA × ATR_Multiplier)`.
### D. Price Change Percentage
* **Compute Price Change:**
$$
Price\_Change = \frac{(Close - Close )}{Close } \times 100
$$
* This is the percent return from `Price_Change_Period` bars ago to now.
* For a valid long‐trend signal, we require `Price_Change > 0`; for a short trend, `Price_Change < 0`.
### E. Local SMAs for Trend/Reversal Filters
* `SMA_Close_Long` = `ta.sma(close, SMA_Long_Length)`.
* `SMA_Close_Short1` = `ta.sma(close, SMA_Short1_Length)`.
* `SMA_Close_Short2` = `ta.sma(close, SMA_Short2_Length)`.
These three SMAs help define the “local trend” and reversal breakout points:
* **Primary Trend Filter:**
* Price must be above `SMA_Close_Long` for an uptrend filter, or below `SMA_Close_Long` for a downtrend filter.
* **Reversal Filter:**
* A bullish reversal is detected if **(RSI < Oversold AND close crosses above EMA)** OR **(RSI < Oversold AND close crosses above SMA\_Close\_Short1)**.
* A bearish reversal is detected if **(RSI > Overbought AND close crosses below EMA)** OR **(RSI > Overbought AND close crosses below SMA\_Close\_Short1)**.
### F. Manual +DI, –DI & ADX on Current Timeframe
Instead of relying on the built-in `ta.adx`, the script calculates DI and ADX manually. This makes it easier to replicate the exact logic on a higher timeframe via `request.security`. The steps are:
1. **Directional Movement (DM) Components:**
* `Up_Move` = `high – high `
* `Down_Move` = `low – low`
* `Plus_DM` = `Up_Move` if (`Up_Move > Down_Move` AND `Up_Move > 0`), else `0`
* `Minus_DM` = `Down_Move` if (`Down_Move > Up_Move` AND `Down_Move > 0`), else `0`
2. **True Range (TR) Components:**
* `TR1` = `high – low`
* `TR2` = `abs(high – close )`
* `TR3` = `abs(low – close )`
* `True_Range` = `max(TR1, TR2, TR3)`
3. **Smoothed Averages (RMA):**
* `Sm_TR` = `ta.rma(True_Range, ADX_Length)`
* `Sm_Plus` = `ta.rma(Plus_DM, ADX_Length)`
* `Sm_Minus`= `ta.rma(Minus_DM, ADX_Length)`
4. **Compute DI%:**
$$
Plus\_DI = \frac{Sm\_Plus}{Sm\_TR} \times 100,\quad
Minus\_DI = \frac{Sm\_Minus}{Sm\_TR} \times 100
$$
5. **DX and ADX:**
$$
DX = \frac{|Plus\_DI - Minus\_DI|}{Plus\_DI + Minus\_DI} \times 100,\quad
ADX = ta.rma(DX, ADX_Length)
$$
These values are referred to as `(plus_di, minus_di, adx_val)` for the current timeframe.
---
## 3. Higher Timeframe (HTF) Confirmation Function
If **Use Higher Timeframe Confirmation** is enabled, the script calls a single helper (Pine) function `f_htf` with two parameters: the ADX length and the SMA length (both taken from the “base” or “scaled” values). Internally, `f_htf` simply reruns the manual DI/ADX logic (same as above) on the higher timeframe’s bar data, and also includes that timeframe’s closing price and its SMA for trend comparison.
* **Request.Security Call:**
```
= request.security(
syminfo.tickerid,
higher_tf,
f_htf(adx_length, sma_long_len),
lookahead=barmerge.lookahead_off
)
```
* `lookahead=barmerge.lookahead_off` ensures that no HTF value “paints” early; you always see only confirmed HTF bars.
* The returned tuple provides:
1. `ht_close` = HTF closing price
2. `ht_sma` = HTF SMA of length `sma_long_len`
3. `ht_pdi` = HTF +DI percentage
4. `ht_mdi` = HTF –DI percentage
5. `ht_adx` = HTF ADX value
---
## 4. Trend & Reversal Filters (Current & HTF)
### A. Current-Timeframe Trend Filter
1. **Uptrend\_Basic (Current TF)**
$$
(plus\_di > minus\_di)\;\land\;(adx\_val > ADX\_Threshold)\;\land\;(close > SMA\_Close\_Long)
$$
2. **Downtrend\_Basic (Current TF)**
$$
(minus\_di > plus\_di)\;\land\;(adx\_val > ADX\_Threshold)\;\land\;(close < SMA\_Close\_Long)
$$
3. **Trend Confirmation by Bars:**
* `Bars_Since_Below` = number of bars since `close <= SMA_Close_Long`.
* `Bars_Since_Above` = number of bars since `close >= SMA_Close_Long`.
* If `Uptrend_Basic == true` AND `Bars_Since_Below ≥ Trend_Confirmation_Bars` → mark `Uptrend_Confirm = true`.
* If `Downtrend_Basic == true` AND `Bars_Since_Above ≥ Trend_Confirmation_Bars` → mark `Downtrend_Confirm = true`.
### B. Reversal Filters (Current TF)
1. **Bullish Reversal (`Rev_Bullish`):**
* If `(RSI < RSI_Oversold AND close crosses above EMA_Value)` OR
`(RSI < RSI_Oversold AND close crosses above SMA_Close_Short1)`
→ then `Rev_Bullish = true`.
2. **Bearish Reversal (`Rev_Bearish`):**
* If `(RSI > RSI_Overbought AND close crosses below EMA_Value)` OR
`(RSI > RSI_Overbought AND close crosses below SMA_Close_Short1)`
→ then `Rev_Bearish = true`.
### C. Higher-Timeframe Trend Filter (HTF)
1. **HTF Uptrend (`HT_Uptrend`):**
$$
(ht\_pdi > ht\_mdi)\;\land\;(ht\_adx > ADX\_Threshold)\;\land\;(ht\_close > ht\_sma)
$$
2. **HTF Downtrend (`HT_Downtrend`):**
$$
(ht\_mdi > ht\_pdi)\;\land\;(ht\_adx > ADX\_Threshold)\;\land\;(ht\_close < ht\_sma)
$$
3. **Combine Current & HTF:**
* If **Use\_HTF\_Confirmation == true**, then:
* `Uptrend_Confirm := Uptrend_Confirm AND HT_Uptrend`
* `Downtrend_Confirm := Downtrend_Confirm AND HT_Downtrend`
* Otherwise, just use the current timeframe’s `Uptrend_Confirm` and `Downtrend_Confirm`.
4. **Define `CurrentTrend` (Integer):**
* `CurrentTrend = +1` if `Uptrend_Confirm == true`.
* `CurrentTrend = –1` if `Downtrend_Confirm == true`.
* Otherwise, `CurrentTrend = 0`.
5. **Reset “One Trade Per Trend”:**
* There is a persistent variable `LastTradeTrend`.
* Every time `CurrentTrend` flips (i.e., `CurrentTrend != CurrentTrend `), the code sets `LastTradeTrend := 0`.
* That allows one new entry once the detected trend has changed.
---
## 5. One‐Time “Cooldown” Logic
* **`LastSignalBar`**
* A persistent integer (initially undefined).
* After each confirmed long or short entry, `LastSignalBar` is set to the bar index where that signal fired.
* **`Bars_Since_Signal`**
* If `LastSignalBar` is undefined, treat as a very large number (so that initial signals are always allowed).
* Otherwise, `Bars_Since_Signal = bar_index – LastSignalBar`.
* **Cooldown Check:**
* A new long (or short) can only be generated if `(Bars_Since_Signal > Signal_Cooldown)`.
* This prevents multiple signals in rapid succession.
---
## 6. Entry Conditions (No Repaint)
All of the conditions below are calculated “intrabar,” but the script only actually registers a **signal** on **bar close** (`barstate.isconfirmed`) so that signals never repaint.
### A. Trend‐Based “Raw” Conditions
1. **Trend\_Long\_Raw:**
$$
(AI\_Score > AI\_Score\_Threshold)\;\land\;Uptrend\_Confirm\;\land\;High\_Volatility\;\land\;(Price\_Change > 0)
$$
2. **Trend\_Short\_Raw:**
$$
(AI\_Score < -AI\_Score\_Threshold)\;\land\;Downtrend\_Confirm\;\land\;High\_Volatility\;\land\;(Price\_Change < 0)
$$
### B. Reversal “Raw” Conditions
1. **Rev\_Long\_Raw:**
$$
Rev\_Bullish\;\land\;(CurrentTrend \neq +1)
$$
2. **Rev\_Short\_Raw:**
$$
Rev\_Bearish\;\land\;(CurrentTrend \neq -1)
$$
### C. Combine Raw Signals
* `Raw_Long = Trend_Long_Raw OR Rev_Long_Raw`.
* `Raw_Short = Trend_Short_Raw OR Rev_Short_Raw`.
### D. Confirmed Long/Short Signal Flags
On each new bar **close** (`barstate.isconfirmed == true`):
* **Long\_Signal\_Confirmed** can fire if:
1. `Raw_Long == true`
2. `LastTradeTrend != +1` (we haven’t already taken a long in this same trend)
3. `Bars_Since_Signal > Signal_Cooldown`
If all three hold, then on this bar close the code sets:
* `Long_Signal = true`
* `LastTradeTrend := +1`
* `LastSignalBar := bar_index`
Otherwise, `Long_Signal := false` on this bar.
* **Short\_Signal\_Confirmed** works the same way but with `Raw_Short`, `LastTradeTrend != -1`, etc.
If triggered, it sets `Short_Signal = true`, `LastTradeTrend := -1`, and `LastSignalBar := bar_index`. Otherwise `Short_Signal := false`.
* **Important:** If the bar is still forming (`else` branch of `barstate.isconfirmed`), then both `Long_Signal` and `Short_Signal` are forced to `false`. This guarantees that no shape or alert appears until the bar actually closes.
---
## 7. Plotting Entry/Exit Shapes
1. **Trend Long Signal (Triangle Up)**
* Condition: `Long_Signal == true` **AND** `Trend_Long_Raw == true`.
* Appearance: A small, semi-transparent lime green triangle drawn **below** the bar.
2. **Trend Short Signal (Triangle Down)**
* Condition: `Short_Signal == true` **AND** `Trend_Short_Raw == true`.
* Appearance: A small, semi-transparent maroon triangle drawn **above** the bar.
3. **Reversal Long Signal (Circle)**
* Condition: `Long_Signal == true` **AND** `Rev_Long_Raw == true`.
* Appearance: A tiny, more transparent green circle drawn **below** the bar.
4. **Reversal Short Signal (Circle)**
* Condition: `Short_Signal == true` **AND** `Rev_Short_Raw == true`.
* Appearance: A tiny, more transparent red circle drawn **above** the bar.
Since `Long_Signal` and `Short_Signal` only ever become true at bar close, these shapes are never repainted or removed once drawn.
---
## 8. Unified Alert Message
* As soon as a new bar closes with either `Long_Signal` or `Short_Signal == true`, an alert message is sent:
* If `Long_Signal`, then `alert_msg = "action=BUY"`.
* If `Short_Signal`, then `alert_msg = "action=SELL"`.
* If neither, `alert_msg = ""` (no alert).
* The code calls `alert(alert_msg, freq=alert.freq_once_per_bar)` only if `barstate.isconfirmed` and `alert_msg` is non‐empty. This ensures exactly one alert per confirmed bar, no intrabar pops.
---
## 9. Dynamic TP/SL Logic (Minimal Implementation)
Once a long or short position is “open,” the script tracks these variables:
1. **Persistent Flags and Prices** (all persist between bars until reset):
* `InLong` (Boolean)
* `InShort` (Boolean)
* `Long_Max` (Float)
* `Short_Min` (Float)
* `Entry_Price` (Float)
2. **On Bar Close:**
* If `Long_Signal == true` →
* Set `InLong := true`,
* `Entry_Price := close` of that bar,
* `Long_Max := high ` (last bar’s high, so that we’re not using “future” data).
* If `Short_Signal == true` →
* Set `InShort := true`,
* `Entry_Price := close`,
* `Short_Min := low `.
3. **While `InLong == true`:**
* Continuously update `Long_Max = max(Long_Max, current high)` on each bar (intrabar, but finalized each close).
* Compute a dynamic SL:
$$
SL_{Long} = Entry\_Price - (ATR \times SL\_ATR\_Multiplier).
$$
* If **current trend** flips to non-uptrend (`CurrentTrend != +1`), mark `ExitLong = true`.
* Then the routine plots `TP_Long = Long_Max` as a cross (“X”) at that level.
* Set `InLong := false` so that no further changes to `Long_Max` or `Entry_Price` happen on future bars.
4. **While `InShort == true`:**
* Continuously update `Short_Min = min(Short_Min, current low)`.
* Compute a dynamic SL:
$$
SL_{Short} = Entry\_Price + (ATR \times SL\_ATR\_Multiplier).
$$
* If trend flips to non-downtrend (`CurrentTrend != –1`), mark `ExitShort = true`.
* Then the routine plots `TP_Short = Short_Min`.
* Set `InShort := false` to freeze those values.
5. **Plotting TP/SL if “Show Debug” is On:**
* **TP Shapes:**
* When `ExitLong == true`, plot a solid lime “X” at `TP_Long` (highest high).
* When `ExitShort == true`, plot a solid maroon “X” at `TP_Short` (lowest low).
* **SL Lines:**
* If still `InLong`, draw a thin red line at `SL_Long` on each bar.
* If still `InShort`, draw a thin green line at `SL_Short`.
Thus, your charts visually show the highest‐high take-profit cross for longs, the lowest-low take-profit cross for shorts, and a continuously updating trailing SL until the trend flips. Because all of this is triggered on confirmed bars, nothing “jumps around” after the fact.
---
## 10. Debug‐Only Plot Lines (When Enabled)
When **Show Debug Lines** = true, the indicator will also plot:
1. **ATR SMA (Orange):**
* The simple moving average of ATR over `ATR_SMA_Length`.
2. **ATR Threshold (Yellow):**
* `ATR_SMA × ATR_Multiplier` (the dynamically scaled threshold).
3. **+DI & –DI (Current TF):**
* +DI plotted as a green line, –DI plotted as a red line (opacity \~70%).
4. **ADX (Current TF, Blue):**
* A blue line for the present timeframe’s ADX.
5. **ADX Threshold (Gray):**
* A horizontal gray line showing `ADX_Threshold`.
6. **+DI & –DI (HTF, Darker Colors):**
* If HTF confirmation is on, “HTF +DI” is a greener but more transparent line; “HTF –DI” is a redder but more transparent line.
7. **ADX (HTF, Blue but Transparent):**
* HTF ADX plotted in blue (high transparency).
8. **HTF SMA (Orange, Transparent):**
* The higher timeframe’s SMA (same length as `SMA_Long_Length`), drawn in fainter orange.
9. **Volatility Zone Fill (Yellow Tinted Area):**
* Fills the area between `ATR_SMA` and `ATR_SMA × ATR_Multiplier`.
* Indicates “normal” versus “high‐volatility” regimes.
These debug lines are purely visual aids. Disable them if you want a cleaner chart.
---
## 11. Putting It All Together — Step-By-Step Flow
1. **Read Inputs** (RSI lengths, EMA length, ATR settings, etc.).
2. **Optionally Halve All Lengths** if “Scalping Mode” is checked.
3. **Calculate Current TF Indicators:**
* RSI, ATR, ATR\_SMA, EMA, price change, various SMAs, DI/ADX.
4. **Compute “AI Score”** (weighted sum of RSI and EMA signals).
5. **Compute Dynamic ATR Multiplier** and decide if “High Volatility” is true.
6. **Compute Raw Trend/Reversal Conditions** on the current timeframe (without triggering yet).
7. **Fetch HTF Values** in one `request.security` call (SMAs, DI/ADX).
8. **Combine Current & HTF Trend Filters** to confirm `Uptrend_Confirm` or `Downtrend_Confirm`.
9. **Check Reversal Conditions** (price crossing EMA or SMA short, in overbought/oversold zones).
10. **Enforce “One Trade Per Trend”** (clear `LastTradeTrend` whenever `CurrentTrend` flips).
11. **Enforce Cooldown** (must wait at least `Signal_Cooldown` bars since the prior signal).
12. **On Bar Close:**
* If `Raw_Long` AND not already in a long trend AND cooldown met, then fire `Long_Signal`.
* Else if `Raw_Short` AND not already in a short trend AND cooldown met, then fire `Short_Signal`.
* Otherwise, no new signal on this bar.
13. **Plot Long/Short Entry Shapes** according to whether it was a Trend signal or a Reversal signal.
14. **Send Alert** (“action=BUY” or “action=SELL”) exactly once per confirmed bar.
15. **If New Long/Short Signal, Set `InLong`/`InShort`, Record Entry Price, Initialize `Long_Max`/`Short_Min`.**
16. **While `InLong` is true:** Update `Long_Max = max(previous Long_Max, current high)`. Compute `SL_Long`. If the current trend flips (no longer uptrend), set `ExitLong = true`, plot a “TP X,” and close the position logic.
17. **While `InShort` is true:** Similarly update `Short_Min`, compute `SL_Short`, and if trend flips, set `ExitShort = true`, plot a “TP X,” and close the position logic.
18. **Optionally Display Debug Lines** (ATR SMA, ATR threshold, DI/ADX, HTF DI/ADX, etc.).
---
## 12. How to Use in TradingView Community
When you publish this indicator to the TradingView community—choosing “Protected” or “Invite-only” visibility—you can paste the above description into the “Description” field. Users will see exactly what each input does, how signals are generated, and what the various plotted lines represent, **without ever seeing the script source**. In this way, the code itself remains hidden but the logic is fully documented.
1. **Go to “Create New Indicator”** on TradingView.
2. **Paste Your Pine Code** (the full indicator script) in the Pine editor and save it.
3. **Set Visibility = Protected** (or Invite-only).
4. **In the “Description” Text Box, paste the entirety of this document** (steps 1–11).
5. **Click “Publish Script.”**
Users who view your indicator will see its name (“AI Strat Adaptive v3 (NoRepaint)”), a list of all inputs (with default values), and the detailed English description above. They can then load it on any chart, adjust inputs, and see the plotted signals, TP/SL lines, and optional debug overlays—without accessing the underlying Pine code.
---
### Summary of Key Points
* **RSI, EMA, ATR, DI/ADX, and “AI Score”** work together to define “trend vs. reversal.”
* **Dynamic volatility filter** uses ATR and ATR\_SMA to adapt the weighting of RSI vs. EMA and decide whether “volatility is high enough” to permit a trend trade.
* **One trade per detected trend** and a **cooldown period** prevent over‐trading.
* **Higher timeframe confirmation** (optional) further filters out noise.
* **No-repaint logic**:
* All signals only appear at bar close (`barstate.isconfirmed`).
* HTF values are fetched with `lookahead=barmerge.lookahead_off`.
* **Entry shapes** (triangles and circles) clearly mark trend vs. reversal entries.
* **Dynamic TP/SL**: highest‐high (or lowest‐low) since entry is used as TP, ATR×multiplier as SL.
* **Debug mode** (optional) shows every intermediate line for full transparency.
Use this description verbatim (or adapt it slightly for your personal style) when publishing. That way, your community sees exactly how each component works—inputs, functions, filters—while the Pine source code remains private.
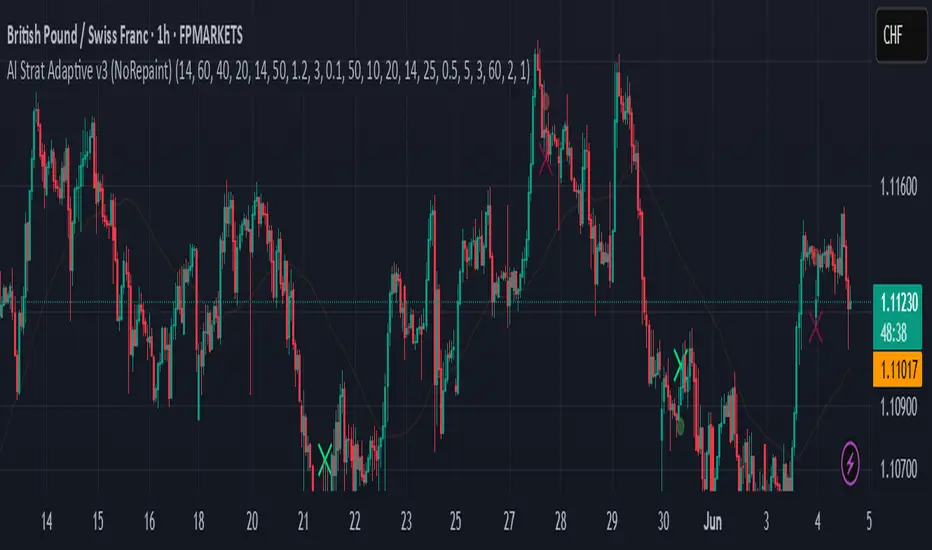
LE LevelsGENERAL OVERVIEW:
The LE Levels indicator plots yesterday’s high/low and today’s pre-market high/low directly on your chart, then layers signal logic around those levels and a set of EMA waves. You can choose “Inside” setups, “Outside” setups, or both. You can also pick entries that trigger at levels, entries that trigger off the EMA wave, or both.
This indicator was developed by Flux Charts in collaboration with Ellis Dillinger (Ellydtrades).
What is the purpose of the indicator?:
The purpose of the LE Levels indicator is to give traders a clear view of how price is behaving around key session levels and EMA structure. It follows the same model EllyD teaches by showing where price is relative to the Previous Day High and Low and the Pre-Market High and Low, then printing signals when specific reactions occur around those levels.
What is the theory behind the indicator?:
The theory behind the LE Levels indicator is based on the concept of inside and outside days. An inside day occurs when price trades within the previous day’s high and low, signaling compression and potential breakout conditions. An outside day occurs when price moves beyond those boundaries, confirming expansion and directional bias. When price trades above the PDH or PMH, it reflects bullish control and potential continuation if supported by volume and momentum. When price trades below the PDL or PML, it shows bearish control and possible downside continuation. The idea is to combine this logic with tickers that have catalysts or news, since these events often bring higher-than-normal volume.
LE SCANNER FEATURES:
Key Levels
Signals
EMA Waves
Key Levels:
The LE Levels indicator automatically plots four key levels each day:
Previous Day High (PDH)
Previous Day Low (PDL)
Pre-Market High (PMH)
Pre-Market Low (PML)
🔹How are Key Levels used in the indicator?:
The key levels are a crucial factor in determining if the trend is bullish, bearish, or neutral trend bias. The indicator uses the key levels as a condition for identifying inside or outside setups (explained below). After determining a trend bias and setup type, the indicator prints long and short entry signals based on how price interacts with the key levels and 8 EMA Wave. (explained below).
These levels define where price previously reacted or reversed, helping traders visualize how current price action relates to prior session structure. They update automatically each day and pre-market session, allowing traders to see if price is trading inside, above, or below prior key ranges without manually drawing them.
Please Note: Pre-market times are based on U.S. market hours (Eastern Standard Time) and may vary for non-U.S. tickers or exchanges.
🔹Previous Day High (PDH):
The PDH marks the highest price reached during the previous regular trading session. It shows where buyers pushed price to its highest point before the market closed. This value is automatically pulled from the daily chart and projected forward onto intraday timeframes.
🔹Previous Day Low (PDL):
The PDL marks the lowest price reached during the previous regular trading session. It shows where selling pressure reached its lowest point before buyers stepped in. Like the PDH, this level is retrieved from the prior day’s data and extended into the current session.
🔹Pre-Market High (PMH):
The PMH is the highest price reached between 4:00 AM and 9:29 AM EST, before the regular market open. It shows how far buyers managed to push price up during the pre-market session.
🔹Pre-Market Low (PML):
The PML is the lowest price reached between 4:00 AM and 9:29 AM EST, before the regular market open. It shows how far sellers were able to drive price down during the pre-market session.
🔹Customization Options:
Extend Levels:
Extends each plotted line a user-defined number of bars into the future, keeping them visible even as new candles print. This helps maintain a clear visual reference as the session progresses.
Extend PDH/L Left & Extend PMH/L Left:
These settings let you extend the Previous Day and Pre-Market levels back to their origin point, so you can see exactly where each level was formed on the prior trading day. This makes it easy to understand the context of each level and how it developed. When this option is disabled, the lines begin at the regular session open instead of extending backward into the previous day’s data.
Show Name / Show Price:
Enabling Show Name displays labels (PDH, PDL, PMH, PML) beside each line, while Show Price adds the exact price value. You can choose to show just the name, just the price, or both for a complete label format.
Line Color and Style:
Each level can be fully customized. You can change the line color and select between solid, dashed, or dotted styles to visually distinguish each level type.
At the bottom of the indicator settings, under the ‘Miscellaneous’ section, two additional options allow further control over how levels are displayed:
Hide Previous Day Highs/Lows:
When enabled, the previous day’s high and low levels aren’t shown. When disabled, users can view previous day levels without using replay mode. By default, this setting is enabled.
Disabled:
Enabled:
Hide Previous Pre-Market Highs/Lows:
When enabled, the previous pre-market high and low levels aren’t shown. When disabled, users can view previous pre-market levels without using replay mode. By default, this setting is enabled.
Disabled:
Enabled:
Signals:
The LE Levels indicator automatically prints long and short entry signals based on how price interacts with its key levels (PDH, PDL, PMH, PML) and the EMA Waves. It identifies moments when price either breaks out beyond prior ranges or retests those levels in alignment with momentum shown by the EMA Waves.
There are two types of setups (Inside and Outside) and two entry types ((L)evels and (E)MAs). Together, these settings allow traders to customize the type of structure the indicator recognizes and how signals are generated.
🔹What is an Inside Setup?
An Inside Setup occurs when the current trading session forms entirely within the previous day’s range, meaning price has not yet broken above the Previous Day High (PDH) or below the Previous Day Low (PDL). In the LE Levels indicator, inside setups are recognized when price trades within the previous day’s boundaries while also considering the pre-market range (Pre-Market High and Pre-Market Low).
Inside Setups have two main conditions, depending on directional bias:
Bullish Inside Setup:
Price trades above the Pre-Market High (PMH) and above the Previous Day Low (PDL), while still below the Previous Day High (PDH).
Bearish Inside Setup:
Price trades below the Pre-Market Low (PML) and below the Previous Day High (PDH), while still above the Previous Day Low (PDL).
🔹What is an Outside Setup?
An Outside Setup occurs when the current trading session extends beyond the previous day’s range, meaning price has broken above the Previous Day High (PDH) or below the Previous Day Low (PDL). This structure reflects expansion and directional control, showing that either buyers or sellers have taken price into new territory beyond the prior session’s boundaries.
In the indicator, an Outside Setup forms once price closes beyond both the previous day and pre-market boundaries, showing bias in one direction.
Bullish Outside Setup:
Price closes above both the PDH and the PMH, confirming buyers have pushed through every key resistance from the prior session and the pre-market.
Bearish Outside Setup:
Price closes below both the PDL and the PML, showing sellers have pushed price beneath all key support levels from the previous session and the pre-market.
🔹Entry Types: (L)evels and (E)MAs
Once a setup type (Inside or Outside) has been established, the LE Levels indicator generates trade signals using one of two entry confirmation methods: (L) for Key Level based Entries and (E) for EMA Wave based Entries. These determine how the signal prints and what triggers it within.
🔹(L)evels Entry:
The (L)evels entry type is built around how price reacts to the key levels (PDH, PDL, PMH, PML). It prints when price retests those levels during an active setup. The logic focuses on retests, where price returns to confirm a previous breakout or breakdown before continuing in the same direction.
Bullish Outside (L)evels Setup:
A Bullish Outside Setup forms when price breaks above both the PDH and PMH. Once this breakout occurs, the indicator waits for a pullback to one of those levels. For a signal to print, the 8 EMA Wave must also be near that level, showing momentum is supporting the structure. A small buffer is applied between price and the level so that even if price only comes close, without fully touching, the retest still counts. When price holds above the PDH or PMH with the 8 EMA nearby, the indicator prints an (L) ▲ entry.
Bearish Outside (L)evels Setup:
A Bearish Outside Setup forms when price breaks below both the PDL and PML. Once this breakdown occurs, the indicator waits for a pullback to one of those levels. For a signal to print, the 8 EMA Wave must also be near that area, confirming momentum is aligned with the move. A small buffer is included so that even if price comes close but doesn’t fully touch the level, the retest still qualifies. When price holds below the PDL or PML with the 8 EMA nearby, the indicator prints an (L) ▼ entry.
Bullish Inside (L)evels Setup:
A Bullish Inside Setup forms when price trades above the PMH but stays below the PDH and above the PDL. Once this condition is met, the indicator waits for a pullback to the PMH. For a signal to print, the 8 EMA Wave must also be near that level. A small buffer is applied so that even if price only comes close to the level, the retest still counts. When price holds above the PMH with the 8 EMA nearby, the indicator prints an (L) ▲ entry.
Bearish Inside (L)evels Setup:
A Bearish Inside Setup forms when price trades below the PML but stays above the PDL and below the PDH. Once this condition is met, the indicator waits for a pullback to the PML. For a signal to print, the 8 EMA Wave must also be near that level. A small buffer is applied so that even if price only comes close, the retest still counts. When price holds below the PML with the 8 EMA nearby, the indicator prints an (L) ▼ entry.
🔹(E)MAs Entry:
The (E)MA Entry type focuses on how price reacts to the 8 EMA Wave. It identifies when price first interacts with the EMAs, then confirms continuation once momentum resumes in the setup’s direction. The first candle that touches the EMA prints an (E) marker, and the confirmation signal triggers only after price breaks above or below that candle, depending on the bias.
Bullish Outside (E)MA Setup:
A Bullish Outside Setup forms when price is trading above both the PDH and PMH. Once this breakout occurs, the indicator waits for price to pull back and touch the 8 EMA Wave, which prints the initial (E) label. If price then breaks above that candle’s high, the continuation setup is confirmed.
Bearish Outside (E)MA Setup:
A Bearish Outside Setup forms when price is trading below both the PDL and PML. After the breakdown, the indicator waits for price to pull back to the 8 EMA Wave, marking the candle that touches it with an (E) label. If price then breaks below that candle’s low, the continuation setup is confirmed.
Bullish Inside (E)MA Setup:
A Bullish Inside Setup forms when price trades above the PMH but remains below the PDH and above the PDL. The indicator waits for price to retrace and touch the 8 EMA Wave, which prints the initial (E) label. If price then breaks above that candle’s high, the continuation setup is confirmed.
Bearish Inside (E)MA Setup:
A Bearish Inside Setup forms when price trades below the PML but remains above the PDL and below the PDH. Once price touches the 8 EMA Wave, the indicator prints an (E) marker. If price then breaks below that candle’s low, the continuation setup is confirmed.
🔹Signal Settings:
At the bottom of the indicator settings panel, three core controls define how signals are displayed and which setups the indicator actively scans for. These settings allow you to refine signal generation based on your trading approach and chart preference.
Setup Type:
This setting determines which structural conditions the indicator tracks.
Inside Setups: Signals only appear when price is trading within the previous day’s range (between PDH and PDL).
Outside Setups: Signals only appear when price breaks outside the previous day’s range (above PDH/PMH or below PDL/PML).
Both: Enables signals for both Inside and Outside setups.
Entry Type:
Controls how the indicator confirms entries.
(E)MAs: Prints signals based on price interacting with the 8 EMA Wave.
(L)evels: Prints signals based on price retesting key levels such as PDH, PDL, PMH, or PML.
Both: Allows both EMA and Level-based signals to appear on the same chart.
Signal Filters (Long, Short, and Re-Entry):
These toggles let you control which trade directions are active.
Long: Displays only bullish entries and ignores all short setups.
Short: Displays only bearish entries and ignores long setups.
Re-Entry: Enables or disables repeated signals in the same direction after the first valid setup has printed. When off, only the initial signal is shown until conditions reset.
EMA Waves:
The EMA Waves help identify potential entries and show directional bias. They’re made of grouped EMAs that form shaded areas to create a “wave” look. The color-coding on the waves allows users to view when price is consolidating, in a bullish trend, or in a bearish trend. The wave updates in real time as new candles form and does not repaint historical data.
🔹8 EMA Wave
The 8 EMA Wave is used directly in the indicator’s signal logic described earlier. It reacts fastest to price compared to the other EAM Waves and determines when (L) and (E) signals can trigger.
How It Works:
The wave is made from the 8, 9, and 10 EMAs and fills the space between them to create a “wave” look. The 8 EMA Wave continuously updates its color based on where price trades relative to the key levels (PDH, PDL, PMH, PML). The color changes are conditional and based solely on price position relative to key levels.
Price is above both PDH and PMH: The wave is bright green, and the top half is purple.
Price is between PDH and PMH: The wave is dark green, and the top half is purple.
Price is below both PDL and PML: The wave is bright red, and the bottom half is purple.
Price is between PDL and PML: The wave is dark red, and the bottom half is purple.
Price is between all four levels: The wave is gray to represent consolidation or neutral bias.
🔹8 EMA Wave Signal Function:
For (L)evels entries, the 8 EMA must be close to the key level being retested, with a small buffer that allows near touches to qualify.
For (E)MA entries, the first candle that touches the wave prints an (E), and the confirmation signal appears when price breaks that candle’s high or low.
🔹8 EMA Wave Customization:
Users can customize all colors for bullish, bearish, and neutral conditions directly in the settings. The purple overlay color cannot be changed, as it is hard-coded into the indicator. The 8 EMA Wave can also be toggled on or off. Turning it off only removes the visual display from the chart and does not affect signals.
🔹20 EMA Wave
The 20 EMA Wave measures medium-term momentum and helps visualize larger pullbacks. It reacts more slowly than the 8 EMA Wave, giving a smoother wave look. No signals are generated from it. It’s purely a visual guide for spotting potential pullback areas for continuation setups.
How It Works:
The wave is made from the 19, 20, and 21 EMAs and fills the space between them to create a shaded “wave.” The color updates continuously based on where price trades relative to the key levels (PDH, PDL, PMH, PML). The color changes are conditional and based only on price position relative to these levels.
Price is above both PDH and PMH: The wave is bright green, and the top half is blue.
Price is between PDH and PMH: The wave is dark green, and the top half is blue.
Price is below both PDL and PML: The wave is bright red, and the bottom half is blue.
Price is between PDL and PML: The wave is dark red, and the bottom half is blue.
Price is between all four levels: The wave is gray to represent consolidation or neutral bias.
🔹20 EMA Wave Use Case:
After 12:00 PM EST, the 20 EMA Wave is used to spot larger pullbacks that form later in the session. No signals are generated from it; it only serves as a visual guide for identifying potential continuation areas.
Bullish Continuation Pullback:
Bearish Continuation Pullback:
🔹20 EMA Wave Customization:
Users can customize all colors for bullish, bearish, and neutral conditions directly in the settings. The blue overlay color cannot be changed, as it is hard-coded into the indicator. The 20 EMA Wave can also be toggled on or off.
🔹200 EMA Wave
The 200 EMA Wave is used to determine long-term trend bias. When price is above it, the bias is bullish; when price is below it, the bias is bearish. It updates automatically in real time and is used to define the broader directional bias for the day.
How it Works:
The 200 EMA Wave is created using the 190, 199, and 200 EMAs, with the area between them shaded to form a “wave.”
🔹200 EMA Wave Use Case:
When price is above the 200 EMA Wave and both the 8 and 20 EMA Waves are stacked above it, the overall trend is bullish.
When price is below the 200 EMA Wave and both shorter-term waves are also below it, the overall trend is bearish.
🔹200 EMA Wave Customization:
Users can customize both colors that form the 200 EMA Wave. The entire wave can also be toggled on or off in the settings.
Uniqueness:
The LE Levels indicator is unique because it combines signal logic with a clear visual structure. It automatically detects inside and outside setups, printing (L) and (E) entries based on how price reacts to key levels and the EMA Waves. Each signal follows strict conditions tied to the 8 EMA and key levels. The color-coded EMA Waves make it simple to understand where price is in relation to the key levels and getting a quick trend bias overview.