RifleShooterLibLibrary "RifleShooterLib"
Provides a collection of helper functions in support of the Rifle Shooter Indicators.
Functions support the key components of the Rifle Trade algorithm including
* measuring momentum
* identifying paraboloic price action (to disable the algorthim during such time)
* determine the lookback criteria of X point movement in last N minutes
* processing and navigating between the 23/43/73 levels
* maintaining a status table of algorithm progress
toStrRnd(val, digits)
Parameters:
val (float)
digits (int)
_isValidTimeRange(startTimeInput, endTimeInput)
Parameters:
startTimeInput (string)
endTimeInput (string)
_normalize(_src, _min, _max)
_normalize Normalizes series with unknown min/max using historical min/max.
Parameters:
_src (float) : Source series to normalize
_min (float) : minimum value of the rescaled series
_max (float) : maximum value of the rescaled series
Returns: The series scaled with values between min and max
arrayToSeries(arrayInput)
arrayToSeries Return an array from the provided series.
Parameters:
arrayInput (array) : Source array to convert to a series
Returns: The array as a series datatype
f_parabolicFiltering(_activeCount, long, shooterRsi, shooterRsiLongThreshold, shooterRsiShortThreshold, fiveMinuteRsi, fiveMinRsiLongThreshold, fiveMinRsiShortThreshold, shooterRsiRoc, shooterRsiRocLongThreshold, shooterRsiRocShortThreshold, quickChangeLookbackBars, quckChangeThreshold, curBarChangeThreshold, changeFromPrevBarThreshold, maxBarsToholdParabolicMoveActive, generateLabels)
f_parabolicFiltering Return true when price action indicates a parabolic active movement based on the provided inputs and thresholds.
Parameters:
_activeCount (int)
long (bool)
shooterRsi (float)
shooterRsiLongThreshold (float)
shooterRsiShortThreshold (float)
fiveMinuteRsi (float)
fiveMinRsiLongThreshold (float)
fiveMinRsiShortThreshold (float)
shooterRsiRoc (float)
shooterRsiRocLongThreshold (float)
shooterRsiRocShortThreshold (float)
quickChangeLookbackBars (int)
quckChangeThreshold (int)
curBarChangeThreshold (int)
changeFromPrevBarThreshold (int)
maxBarsToholdParabolicMoveActive (int)
generateLabels (bool)
rsiValid(rsi, buyThreshold, sellThreshold)
rsiValid Returns true if the provided RSI value is withing the associated threshold. For the unused threshold set it to na
Parameters:
rsi (float)
buyThreshold (float)
sellThreshold (float)
squezeBands(source, length)
squezeBands Returns the squeeze bands momentum color of current source series input
Parameters:
source (float)
length (int)
f_momentumOscilator(source, length, transperency)
f_momentumOscilator Returns the squeeze pro momentum value and bar color states of the series input
Parameters:
source (float)
length (int)
transperency (int)
f_getLookbackExtreme(lowSeries, highSeries, lbBars, long)
f_getLookbackExtreme Return the highest high or lowest low over the look back window
Parameters:
lowSeries (float)
highSeries (float)
lbBars (int)
long (bool)
f_getInitialMoveTarget(lbExtreme, priveMoveOffset, long)
f_getInitialMoveTarget Return the point delta required to achieve an initial rifle move (X points over Y lookback)
Parameters:
lbExtreme (float)
priveMoveOffset (int)
long (bool)
isSymbolSupported(sym)
isSymbolSupported Return true if provided symbol is one of the supported DOW Rifle Indicator symbols
Parameters:
sym (string)
getBasePrice(price)
getBasePrice Returns integer portion of provided float
Parameters:
price (float)
getLastTwoDigitsOfPrice(price)
getBasePrice Returns last two integer numerals of provided float value
Parameters:
price (float)
getNextLevelDown(price, lowestLevel, middleLevel, highestLevel)
getNextLevelDown Returns the next level above the provided price value
Parameters:
price (float)
lowestLevel (float)
middleLevel (float)
highestLevel (float)
getNextLevelUp(price, lowestLevel, middleLevel, highestLevel)
getNextLevelUp Returns the next level below the provided price value
Parameters:
price (float)
lowestLevel (float)
middleLevel (float)
highestLevel (float)
isALevel(price, lowestLevel, middleLevel, highestLevel)
isALevel Returns true if the provided price is onve of the specified levels
Parameters:
price (float)
lowestLevel (float)
middleLevel (float)
highestLevel (float)
getClosestLevel(price, lowestLevel, middleLevel, highestLevel)
getClosestLevel Returns the level closest to the price value provided
Parameters:
price (float)
lowestLevel (float)
middleLevel (float)
highestLevel (float)
f_fillSetupTableCell(_table, _col, _row, _text, _bgcolor, _txtcolor, _text_size)
f_fillSetupTableCell Helper function to fill a setup table celll
Parameters:
_table (table)
_col (int)
_row (int)
_text (string)
_bgcolor (color)
_txtcolor (color)
_text_size (string)
f_fillSetupTableRow(_table, _row, _col0Str, _col1Str, _col2Str, _bgcolor, _textColor, _textSize)
f_fillSetupTableRow Helper function to fill a setup table row
Parameters:
_table (table)
_row (int)
_col0Str (string)
_col1Str (string)
_col2Str (string)
_bgcolor (color)
_textColor (color)
_textSize (string)
f_addBlankRow(_table, _row)
f_addBlankRow Helper function to fill a setup table row with empty values
Parameters:
_table (table)
_row (int)
f_updateVersionTable(versionTable, versionStr, versionDateStr)
f_updateVersionTable Helper function to fill the version table with provided values
Parameters:
versionTable (table)
versionStr (string)
versionDateStr (string)
f_updateSetupTable(_table, parabolicMoveActive, initialMoveTargetOffset, initialMoveAchieved, shooterRsi, shooterRsiValid, rsiRocEnterThreshold, shooterRsiRoc, fiveMinuteRsi, fiveMinuteRsiValid, requireValid5MinuteRsiForEntry, stallLevelOffset, stallLevelExceeded, stallTargetOffset, recoverStallLevelValid, curBarChangeValid, volumeRoc, volumeRocThreshold, enableVolumeRocForTrigger, tradeActive, entryPrice, curCloseOffset, curSymCashDelta, djiCashDelta, showDjiDelta, longIndicator, fontSize)
f_updateSetupTable Manages writing current data to the setup table
Parameters:
_table (table)
parabolicMoveActive (bool)
initialMoveTargetOffset (float)
initialMoveAchieved (bool)
shooterRsi (float)
shooterRsiValid (bool)
rsiRocEnterThreshold (float)
shooterRsiRoc (float)
fiveMinuteRsi (float)
fiveMinuteRsiValid (bool)
requireValid5MinuteRsiForEntry (bool)
stallLevelOffset (float)
stallLevelExceeded (bool)
stallTargetOffset (float)
recoverStallLevelValid (bool)
curBarChangeValid (bool)
volumeRoc (float)
volumeRocThreshold (float)
enableVolumeRocForTrigger (bool)
tradeActive (bool)
entryPrice (float)
curCloseOffset (float)
curSymCashDelta (float)
djiCashDelta (float)
showDjiDelta (bool)
longIndicator (bool)
fontSize (string)
ค้นหาในสคริปต์สำหรับ "entry"
light_logLight Log - A Defensive Programming Library for Pine Script
Overview
The Light Log library transforms Pine Script development by introducing structured logging and defensive programming patterns typically found in enterprise languages like C#. This library addresses a fundamental challenge in Pine Script: the lack of sophisticated error handling and debugging tools that developers expect when building complex trading systems.
At its core, Light Log provides three transformative capabilities that work together to create more reliable and maintainable code. First, it wraps all native Pine Script types in error-aware containers, allowing values to carry validation state alongside their data. Second, it offers a comprehensive logging system with severity levels and conditional rendering. Third, it includes defensive programming utilities that catch errors early and make code self-documenting.
The Philosophy of Errors as Values
Traditional Pine Script error handling relies on runtime errors that halt execution, making it difficult to build resilient systems that can gracefully handle edge cases. Light Log introduces a paradigm shift by treating errors as first-class values that flow through your program alongside regular data.
When you wrap a value using Light Log's type system, you're not just storing data – you're creating a container that can carry both the value and its validation state. For example, when you call myNumber.INT() , you receive an INT object that contains both the integer value and a Log object that can describe any issues with that value. This approach, inspired by functional programming languages, allows errors to propagate through calculations without causing immediate failures.
Consider how this changes error handling in practice. Instead of a calculation failing catastrophically when it encounters invalid input, it can produce a result object that contains both the computed value (which might be na) and a detailed log explaining what went wrong. Subsequent operations can check has_error() to decide whether to proceed or handle the error condition gracefully.
The Typed Wrapper System
Light Log provides typed wrappers for every native Pine Script type: INT, FLOAT, BOOL, STRING, COLOR, LINE, LABEL, BOX, TABLE, CHART_POINT, POLYLINE, and LINEFILL. These wrappers serve multiple purposes beyond simple value storage.
Each wrapper type contains two fields: the value field v holds the actual data, while the error field e contains a Log object that tracks the value's validation state. This dual nature enables powerful programming patterns. You can perform operations on wrapped values and accumulate error information along the way, creating an audit trail of how values were processed.
The wrapper system includes convenient methods for converting between wrapped and unwrapped values. The extension methods like INT() , FLOAT() , etc., make it easy to wrap existing values, while the from_INT() , from_FLOAT() methods extract the underlying values when needed. The has_error() method provides a consistent interface for checking whether any wrapped value has encountered issues during processing.
The Log Object: Your Debugging Companion
The Log object represents the heart of Light Log's debugging capabilities. Unlike simple string concatenation for error messages, the Log object provides a structured approach to building, modifying, and rendering diagnostic information.
Each Log object carries three essential pieces of information: an error type (info, warning, error, or runtime_error), a message string that can be built incrementally, and an active flag that controls conditional rendering. This structure enables sophisticated logging patterns where you can build up detailed diagnostic information throughout your script's execution and decide later whether and how to display it.
The Log object's methods support fluent chaining, allowing you to build complex messages in a readable way. The write() and write_line() methods append text to the log, while new_line() adds formatting. The clear() method resets the log for reuse, and the rendering methods ( render_now() , render_condition() , and the general render() ) control when and how messages appear.
Defensive Programming Made Easy
Light Log's argument validation functions transform how you write defensive code. Instead of cluttering your functions with verbose validation logic, you can use concise, self-documenting calls that make your intentions clear.
The argument_error() function provides strict validation that halts execution when conditions aren't met – perfect for catching programming errors early. For less critical issues, argument_log_warning() and argument_log_error() record problems without stopping execution, while argument_log_info() provides debug visibility into your function's behavior.
These functions follow a consistent pattern: they take a condition to check, the function name, the argument name, and a descriptive message. This consistency makes error messages predictable and helpful, automatically formatting them to show exactly where problems occurred.
Building Modular, Reusable Code
Light Log encourages a modular approach to Pine Script development by providing tools that make functions more self-contained and reliable. When functions validate their inputs and return wrapped values with error information, they become true black boxes that can be safely composed into larger systems.
The void_return() function addresses Pine Script's requirement that all code paths return a value, even in error handling branches. This utility function provides a clean way to satisfy the compiler while making it clear that a particular code path should never execute.
The static log pattern, initialized with init_static_log() , enables module-wide error tracking. You can create a persistent Log object that accumulates information across multiple function calls, building a comprehensive diagnostic report that helps you understand complex behaviors in your indicators and strategies.
Real-World Applications
In practice, Light Log shines when building sophisticated trading systems. Imagine developing a complex indicator that processes multiple data streams, performs statistical calculations, and generates trading signals. With Light Log, each processing stage can validate its inputs, perform calculations, and pass along both results and diagnostic information.
For example, a moving average calculation might check that the period is positive, that sufficient data exists, and that the input series contains valid values. Instead of failing silently or throwing runtime errors, it can return a FLOAT object that contains either the calculated average or a detailed explanation of why the calculation couldn't be performed.
Strategy developers benefit even more from Light Log's capabilities. Complex entry and exit logic often involves multiple conditions that must all be satisfied. With Light Log, each condition check can contribute to a comprehensive log that explains exactly why a trade was or wasn't taken, making strategy debugging and optimization much more straightforward.
Performance Considerations
While Light Log adds a layer of abstraction over raw Pine Script values, its design minimizes performance impact. The wrapper objects are lightweight, containing only two fields. The logging operations only consume resources when actually rendered, and the conditional rendering system ensures that production code can run with logging disabled for maximum performance.
The library follows Pine Script best practices for performance, using appropriate data structures and avoiding unnecessary operations. The var keyword in init_static_log() ensures that persistent logs don't create new objects on every bar, maintaining efficiency even in real-time calculations.
Getting Started
Adopting Light Log in your Pine Script projects is straightforward. Import the library, wrap your critical values, add validation to your functions, and use Log objects to track important events. Start small by adding logging to a single function, then expand as you see the benefits of better error visibility and code organization.
Remember that Light Log is designed to grow with your needs. You can use as much or as little of its functionality as makes sense for your project. Even simple uses, like adding argument validation to key functions, can significantly improve code reliability and debugging ease.
Transform your Pine Script development experience with Light Log – because professional trading systems deserve professional development tools.
Light Log Technical Deep Dive: Advanced Patterns and Architecture
Understanding Errors as Values
The concept of "errors as values" represents a fundamental shift in how we think about error handling in Pine Script. In traditional Pine Script development, errors are events – they happen at a specific moment in time and immediately interrupt program flow. Light Log transforms errors into data – they become information that flows through your program just like any other value.
This transformation has profound implications. When errors are values, they can be stored, passed between functions, accumulated, transformed, and inspected. They become part of your program's data flow rather than exceptions to it. This approach, popularized by languages like Rust with its Result type and Haskell with its Either monad, brings functional programming's elegance to Pine Script.
Consider a practical example. Traditional Pine Script might calculate a momentum indicator like this:
momentum = close - close
If period is invalid or if there isn't enough historical data, this calculation might produce na or cause subtle bugs. With Light Log's approach:
calculate_momentum(src, period)=>
result = src.FLOAT()
if period <= 0
result.e.write("Invalid period: must be positive", true, ErrorType.error)
result.v := na
else if bar_index < period
result.e.write("Insufficient data: need " + str.tostring(period) + " bars", true, ErrorType.warning)
result.v := na
else
result.v := src - src
result.e.write("Momentum calculated successfully", false, ErrorType.info)
result
Now the function returns not just a value but a complete computational result that includes diagnostic information. Calling code can make intelligent decisions based on both the value and its associated metadata.
The Monad Pattern in Pine Script
While Pine Script lacks the type system features to implement true monads, Light Log brings monadic thinking to Pine Script development. The wrapped types (INT, FLOAT, etc.) act as computational contexts that carry both values and metadata through a series of transformations.
The key insight of monadic programming is that you can chain operations while automatically propagating context. In Light Log, this context is the error state. When you have a FLOAT that contains an error, operations on that FLOAT can check the error state and decide whether to proceed or propagate the error.
This pattern enables what functional programmers call "railway-oriented programming" – your code follows a success track when all is well but can switch to an error track when problems occur. Both tracks lead to the same destination (a result with error information), but they take different paths based on the validity of intermediate values.
Composable Error Handling
Light Log's design encourages composition – building complex functionality from simpler, well-tested components. Each component can validate its inputs, perform its calculation, and return a result with appropriate error information. Higher-level functions can then combine these results intelligently.
Consider building a complex trading signal from multiple indicators:
generate_signal(src, fast_period, slow_period, signal_period) =>
log = init_static_log(ErrorType.info)
// Calculate components with error tracking
fast_ma = calculate_ma(src, fast_period)
slow_ma = calculate_ma(src, slow_period)
// Check for errors in components
if fast_ma.has_error()
log.write_line("Fast MA error: " + fast_ma.e.message, true)
if slow_ma.has_error()
log.write_line("Slow MA error: " + slow_ma.e.message, true)
// Proceed with calculation if no errors
signal = 0.0.FLOAT()
if not (fast_ma.has_error() or slow_ma.has_error())
macd_line = fast_ma.v - slow_ma.v
signal_line = calculate_ma(macd_line, signal_period)
if signal_line.has_error()
log.write_line("Signal line error: " + signal_line.e.message, true)
signal.e := log
else
signal.v := macd_line - signal_line.v
log.write("Signal generated successfully")
else
signal.e := log
signal.v := na
signal
This composable approach makes complex calculations more reliable and easier to debug. Each component is responsible for its own validation and error reporting, and the composite function orchestrates these components while maintaining comprehensive error tracking.
The Static Log Pattern
The init_static_log() function introduces a powerful pattern for maintaining state across function calls. In Pine Script, the var keyword creates variables that persist across bars but are initialized only once. Light Log leverages this to create logging objects that can accumulate information throughout a script's execution.
This pattern is particularly valuable for debugging complex strategies where you need to understand behavior across multiple bars. You can create module-level logs that track important events:
// Module-level diagnostic log
diagnostics = init_static_log(ErrorType.info)
// Track strategy decisions across bars
check_entry_conditions() =>
diagnostics.clear() // Start fresh each bar
diagnostics.write_line("Bar " + str.tostring(bar_index) + " analysis:")
if close > sma(close, 20)
diagnostics.write_line("Price above SMA20", false)
else
diagnostics.write_line("Price below SMA20 - no entry", true, ErrorType.warning)
if volume > sma(volume, 20) * 1.5
diagnostics.write_line("Volume surge detected", false)
else
diagnostics.write_line("Normal volume", false)
// Render diagnostics based on verbosity setting
if debug_mode
diagnostics.render_now()
Advanced Validation Patterns
Light Log's argument validation functions enable sophisticated precondition checking that goes beyond simple null checks. You can implement complex validation logic while keeping your code readable:
validate_price_data(open_val, high_val, low_val, close_val) =>
argument_error(na(open_val) or na(high_val) or na(low_val) or na(close_val),
"validate_price_data", "OHLC values", "contain na values")
argument_error(high_val < low_val,
"validate_price_data", "high/low", "high is less than low")
argument_error(close_val > high_val or close_val < low_val,
"validate_price_data", "close", "is outside high/low range")
argument_log_warning(high_val == low_val,
"validate_price_data", "high/low", "are equal (no range)")
This validation function documents its requirements clearly and fails fast with helpful error messages when assumptions are violated. The mix of errors (which halt execution) and warnings (which allow continuation) provides fine-grained control over how strict your validation should be.
Performance Optimization Strategies
While Light Log adds abstraction, careful design minimizes overhead. Understanding Pine Script's execution model helps you use Light Log efficiently.
Pine Script executes once per bar, so operations that seem expensive in traditional programming might have negligible impact. However, when building real-time systems, every optimization matters. Light Log provides several patterns for efficient use:
Lazy Evaluation: Log messages are only built when they'll be rendered. Use conditional logging to avoid string concatenation in production:
if debug_mode
log.write_line("Calculated value: " + str.tostring(complex_calculation))
Selective Wrapping: Not every value needs error tracking. Wrap values at API boundaries and critical calculation points, but use raw values for simple operations:
// Wrap at boundaries
input_price = close.FLOAT()
validated_period = validate_period(input_period).INT()
// Use raw values internally
sum = 0.0
for i = 0 to validated_period.v - 1
sum += close
Error Propagation: When errors occur early, avoid expensive calculations:
process_data(input) =>
validated = validate_input(input)
if validated.has_error()
validated // Return early with error
else
// Expensive processing only if valid
perform_complex_calculation(validated)
Integration Patterns
Light Log integrates smoothly with existing Pine Script code. You can adopt it incrementally, starting with critical functions and expanding coverage as needed.
Boundary Validation: Add Light Log at the boundaries of your system – where user input enters and where final outputs are produced. This catches most errors while minimizing changes to existing code.
Progressive Enhancement: Start by adding argument validation to existing functions. Then wrap return values. Finally, add comprehensive logging. Each step improves reliability without requiring a complete rewrite.
Testing and Debugging: Use Light Log's conditional rendering to create debug modes for your scripts. Production users see clean output while developers get detailed diagnostics:
// User input for debug mode
debug = input.bool(false, "Enable debug logging")
// Conditional diagnostic output
if debug
diagnostics.render_now()
else
diagnostics.render_condition() // Only shows errors/warnings
Future-Proofing Your Code
Light Log's patterns prepare your code for Pine Script's evolution. As Pine Script adds more sophisticated features, code that uses structured error handling and defensive programming will adapt more easily than code that relies on implicit assumptions.
The type wrapper system, in particular, positions your code to take advantage of potential future features or more sophisticated type inference. By thinking in terms of wrapped values and error propagation today, you're building code that will remain maintainable and extensible tomorrow.
Light Log doesn't just make your Pine Script better today – it prepares it for the trading systems you'll need to build tomorrow.
Library "light_log"
A lightweight logging and defensive programming library for Pine Script.
Designed for modular and extensible scripts, this utility provides structured runtime validation,
conditional logging, and reusable `Log` objects for centralized error propagation.
It also introduces a typed wrapping system for all native Pine values (e.g., `INT`, `FLOAT`, `LABEL`),
allowing values to carry errors alongside data. This enables functional-style flows with built-in
validation tracking, error detection (`has_error()`), and fluent chaining.
Inspired by structured logging patterns found in systems like C#, it reduces boilerplate,
enforces argument safety, and encourages clean, maintainable code architecture.
method INT(self, error_type)
Wraps an `int` value into an `INT` struct with an optional log severity.
Namespace types: series int, simple int, input int, const int
Parameters:
self (int) : The raw `int` value to wrap.
error_type (series ErrorType) : Optional severity level to associate with the log. Default is `ErrorType.error`.
Returns: An `INT` object containing the value and a default Log instance.
method FLOAT(self, error_type)
Wraps a `float` value into a `FLOAT` struct with an optional log severity.
Namespace types: series float, simple float, input float, const float
Parameters:
self (float) : The raw `float` value to wrap.
error_type (series ErrorType) : Optional severity level to associate with the log. Default is `ErrorType.error`.
Returns: A `FLOAT` object containing the value and a default Log instance.
method BOOL(self, error_type)
Wraps a `bool` value into a `BOOL` struct with an optional log severity.
Namespace types: series bool, simple bool, input bool, const bool
Parameters:
self (bool) : The raw `bool` value to wrap.
error_type (series ErrorType) : Optional severity level to associate with the log. Default is `ErrorType.error`.
Returns: A `BOOL` object containing the value and a default Log instance.
method STRING(self, error_type)
Wraps a `string` value into a `STRING` struct with an optional log severity.
Namespace types: series string, simple string, input string, const string
Parameters:
self (string) : The raw `string` value to wrap.
error_type (series ErrorType) : Optional severity level to associate with the log. Default is `ErrorType.error`.
Returns: A `STRING` object containing the value and a default Log instance.
method COLOR(self, error_type)
Wraps a `color` value into a `COLOR` struct with an optional log severity.
Namespace types: series color, simple color, input color, const color
Parameters:
self (color) : The raw `color` value to wrap.
error_type (series ErrorType) : Optional severity level to associate with the log. Default is `ErrorType.error`.
Returns: A `COLOR` object containing the value and a default Log instance.
method LINE(self, error_type)
Wraps a `line` object into a `LINE` struct with an optional log severity.
Namespace types: series line
Parameters:
self (line) : The raw `line` object to wrap.
error_type (series ErrorType) : Optional severity level to associate with the log. Default is `ErrorType.error`.
Returns: A `LINE` object containing the value and a default Log instance.
method LABEL(self, error_type)
Wraps a `label` object into a `LABEL` struct with an optional log severity.
Namespace types: series label
Parameters:
self (label) : The raw `label` object to wrap.
error_type (series ErrorType) : Optional severity level to associate with the log. Default is `ErrorType.error`.
Returns: A `LABEL` object containing the value and a default Log instance.
method BOX(self, error_type)
Wraps a `box` object into a `BOX` struct with an optional log severity.
Namespace types: series box
Parameters:
self (box) : The raw `box` object to wrap.
error_type (series ErrorType) : Optional severity level to associate with the log. Default is `ErrorType.error`.
Returns: A `BOX` object containing the value and a default Log instance.
method TABLE(self, error_type)
Wraps a `table` object into a `TABLE` struct with an optional log severity.
Namespace types: series table
Parameters:
self (table) : The raw `table` object to wrap.
error_type (series ErrorType) : Optional severity level to associate with the log. Default is `ErrorType.error`.
Returns: A `TABLE` object containing the value and a default Log instance.
method CHART_POINT(self, error_type)
Wraps a `chart.point` value into a `CHART_POINT` struct with an optional log severity.
Namespace types: chart.point
Parameters:
self (chart.point) : The raw `chart.point` value to wrap.
error_type (series ErrorType) : Optional severity level to associate with the log. Default is `ErrorType.error`.
Returns: A `CHART_POINT` object containing the value and a default Log instance.
method POLYLINE(self, error_type)
Wraps a `polyline` object into a `POLYLINE` struct with an optional log severity.
Namespace types: series polyline, series polyline, series polyline, series polyline
Parameters:
self (polyline) : The raw `polyline` object to wrap.
error_type (series ErrorType) : Optional severity level to associate with the log. Default is `ErrorType.error`.
Returns: A `POLYLINE` object containing the value and a default Log instance.
method LINEFILL(self, error_type)
Wraps a `linefill` object into a `LINEFILL` struct with an optional log severity.
Namespace types: series linefill
Parameters:
self (linefill) : The raw `linefill` object to wrap.
error_type (series ErrorType) : Optional severity level to associate with the log. Default is `ErrorType.error`.
Returns: A `LINEFILL` object containing the value and a default Log instance.
method from_INT(self)
Extracts the integer value from an INT wrapper.
Namespace types: INT
Parameters:
self (INT) : The wrapped INT instance.
Returns: The underlying `int` value.
method from_FLOAT(self)
Extracts the float value from a FLOAT wrapper.
Namespace types: FLOAT
Parameters:
self (FLOAT) : The wrapped FLOAT instance.
Returns: The underlying `float` value.
method from_BOOL(self)
Extracts the boolean value from a BOOL wrapper.
Namespace types: BOOL
Parameters:
self (BOOL) : The wrapped BOOL instance.
Returns: The underlying `bool` value.
method from_STRING(self)
Extracts the string value from a STRING wrapper.
Namespace types: STRING
Parameters:
self (STRING) : The wrapped STRING instance.
Returns: The underlying `string` value.
method from_COLOR(self)
Extracts the color value from a COLOR wrapper.
Namespace types: COLOR
Parameters:
self (COLOR) : The wrapped COLOR instance.
Returns: The underlying `color` value.
method from_LINE(self)
Extracts the line object from a LINE wrapper.
Namespace types: LINE
Parameters:
self (LINE) : The wrapped LINE instance.
Returns: The underlying `line` object.
method from_LABEL(self)
Extracts the label object from a LABEL wrapper.
Namespace types: LABEL
Parameters:
self (LABEL) : The wrapped LABEL instance.
Returns: The underlying `label` object.
method from_BOX(self)
Extracts the box object from a BOX wrapper.
Namespace types: BOX
Parameters:
self (BOX) : The wrapped BOX instance.
Returns: The underlying `box` object.
method from_TABLE(self)
Extracts the table object from a TABLE wrapper.
Namespace types: TABLE
Parameters:
self (TABLE) : The wrapped TABLE instance.
Returns: The underlying `table` object.
method from_CHART_POINT(self)
Extracts the chart.point from a CHART_POINT wrapper.
Namespace types: CHART_POINT
Parameters:
self (CHART_POINT) : The wrapped CHART_POINT instance.
Returns: The underlying `chart.point` value.
method from_POLYLINE(self)
Extracts the polyline object from a POLYLINE wrapper.
Namespace types: POLYLINE
Parameters:
self (POLYLINE) : The wrapped POLYLINE instance.
Returns: The underlying `polyline` object.
method from_LINEFILL(self)
Extracts the linefill object from a LINEFILL wrapper.
Namespace types: LINEFILL
Parameters:
self (LINEFILL) : The wrapped LINEFILL instance.
Returns: The underlying `linefill` object.
method has_error(self)
Returns true if the INT wrapper has an active log entry.
Namespace types: INT
Parameters:
self (INT) : The INT instance to check.
Returns: True if an error or message is active in the log.
method has_error(self)
Returns true if the FLOAT wrapper has an active log entry.
Namespace types: FLOAT
Parameters:
self (FLOAT) : The FLOAT instance to check.
Returns: True if an error or message is active in the log.
method has_error(self)
Returns true if the BOOL wrapper has an active log entry.
Namespace types: BOOL
Parameters:
self (BOOL) : The BOOL instance to check.
Returns: True if an error or message is active in the log.
method has_error(self)
Returns true if the STRING wrapper has an active log entry.
Namespace types: STRING
Parameters:
self (STRING) : The STRING instance to check.
Returns: True if an error or message is active in the log.
method has_error(self)
Returns true if the COLOR wrapper has an active log entry.
Namespace types: COLOR
Parameters:
self (COLOR) : The COLOR instance to check.
Returns: True if an error or message is active in the log.
method has_error(self)
Returns true if the LINE wrapper has an active log entry.
Namespace types: LINE
Parameters:
self (LINE) : The LINE instance to check.
Returns: True if an error or message is active in the log.
method has_error(self)
Returns true if the LABEL wrapper has an active log entry.
Namespace types: LABEL
Parameters:
self (LABEL) : The LABEL instance to check.
Returns: True if an error or message is active in the log.
method has_error(self)
Returns true if the BOX wrapper has an active log entry.
Namespace types: BOX
Parameters:
self (BOX) : The BOX instance to check.
Returns: True if an error or message is active in the log.
method has_error(self)
Returns true if the TABLE wrapper has an active log entry.
Namespace types: TABLE
Parameters:
self (TABLE) : The TABLE instance to check.
Returns: True if an error or message is active in the log.
method has_error(self)
Returns true if the CHART_POINT wrapper has an active log entry.
Namespace types: CHART_POINT
Parameters:
self (CHART_POINT) : The CHART_POINT instance to check.
Returns: True if an error or message is active in the log.
method has_error(self)
Returns true if the POLYLINE wrapper has an active log entry.
Namespace types: POLYLINE
Parameters:
self (POLYLINE) : The POLYLINE instance to check.
Returns: True if an error or message is active in the log.
method has_error(self)
Returns true if the LINEFILL wrapper has an active log entry.
Namespace types: LINEFILL
Parameters:
self (LINEFILL) : The LINEFILL instance to check.
Returns: True if an error or message is active in the log.
void_return()
Utility function used when a return is syntactically required but functionally unnecessary.
Returns: Nothing. Function never executes its body.
argument_error(condition, function, argument, message)
Throws a runtime error when a condition is met. Used for strict argument validation.
Parameters:
condition (bool) : Boolean expression that triggers the runtime error.
function (string) : Name of the calling function (for formatting).
argument (string) : Name of the problematic argument.
message (string) : Description of the error cause.
Returns: Never returns. Halts execution if the condition is true.
argument_log_info(condition, function, argument, message)
Logs an informational message when a condition is met. Used for optional debug visibility.
Parameters:
condition (bool) : Boolean expression that triggers the log.
function (string) : Name of the calling function.
argument (string) : Argument name being referenced.
message (string) : Informational message to log.
Returns: Nothing. Logs if the condition is true.
argument_log_warning(condition, function, argument, message)
Logs a warning when a condition is met. Non-fatal but highlights potential issues.
Parameters:
condition (bool) : Boolean expression that triggers the warning.
function (string) : Name of the calling function.
argument (string) : Argument name being referenced.
message (string) : Warning message to log.
Returns: Nothing. Logs if the condition is true.
argument_log_error(condition, function, argument, message)
Logs an error message when a condition is met. Does not halt execution.
Parameters:
condition (bool) : Boolean expression that triggers the error log.
function (string) : Name of the calling function.
argument (string) : Argument name being referenced.
message (string) : Error message to log.
Returns: Nothing. Logs if the condition is true.
init_static_log(error_type, message, active)
Initializes a persistent (var) Log object. Ideal for global logging in scripts or modules.
Parameters:
error_type (series ErrorType) : Initial severity level (required).
message (string) : Optional starting message string. Default value of ("").
active (bool) : Whether the log should be flagged active on initialization. Default value of (false).
Returns: A static Log object with the given parameters.
method new_line(self)
Appends a newline character to the Log message. Useful for separating entries during chained writes.
Namespace types: Log
Parameters:
self (Log) : The Log instance to modify.
Returns: The updated Log object with a newline appended.
method write(self, message, flag_active, error_type)
Appends a message to a Log object without a newline. Updates severity and active state if specified.
Namespace types: Log
Parameters:
self (Log) : The Log instance being modified.
message (string) : The text to append to the log.
flag_active (bool) : Whether to activate the log for conditional rendering. Default value of (false).
error_type (series ErrorType) : Optional override for the severity level. Default value of (na).
Returns: The updated Log object.
method write_line(self, message, flag_active, error_type)
Appends a message to a Log object, prefixed with a newline for clarity.
Namespace types: Log
Parameters:
self (Log) : The Log instance being modified.
message (string) : The text to append to the log.
flag_active (bool) : Whether to activate the log for conditional rendering. Default value of (false).
error_type (series ErrorType) : Optional override for the severity level. Default value of (na).
Returns: The updated Log object.
method clear(self, flag_active, error_type)
Clears a Log object’s message and optionally reactivates it. Can also update the error type.
Namespace types: Log
Parameters:
self (Log) : The Log instance being cleared.
flag_active (bool) : Whether to activate the log after clearing. Default value of (false).
error_type (series ErrorType) : Optional new error type to assign. If not provided, the previous type is retained. Default value of (na).
Returns: The cleared Log object.
method render_condition(self, flag_active, error_type)
Conditionally renders the log if it is active. Allows overriding error type and controlling active state afterward.
Namespace types: Log
Parameters:
self (Log) : The Log instance to evaluate and render.
flag_active (bool) : Whether to activate the log after rendering. Default value of (false).
error_type (series ErrorType) : Optional error type override. Useful for contextual formatting just before rendering. Default value of (na).
Returns: The updated Log object.
method render_now(self, flag_active, error_type)
Immediately renders the log regardless of `active` state. Allows overriding error type and active flag.
Namespace types: Log
Parameters:
self (Log) : The Log instance to render.
flag_active (bool) : Whether to activate the log after rendering. Default value of (false).
error_type (series ErrorType) : Optional error type override. Allows dynamic severity adjustment at render time. Default value of (na).
Returns: The updated Log object.
render(self, condition, flag_active, error_type)
Renders the log conditionally or unconditionally. Allows full control over render behavior.
Parameters:
self (Log) : The Log instance to render.
condition (bool) : If true, renders only if the log is active. If false, always renders. Default value of (false).
flag_active (bool) : Whether to activate the log after rendering. Default value of (false).
error_type (series ErrorType) : Optional error type override passed to the render methods. Default value of (na).
Returns: The updated Log object.
Log
A structured object used to store and render logging messages.
Fields:
error_type (series ErrorType) : The severity level of the message (from the ErrorType enum).
message (series string) : The text of the log message.
active (series bool) : Whether the log should trigger rendering when conditionally evaluated.
INT
A wrapped integer type with attached logging for validation or tracing.
Fields:
v (series int) : The underlying `int` value.
e (Log) : Optional log object describing validation status or error context.
FLOAT
A wrapped float type with attached logging for validation or tracing.
Fields:
v (series float) : The underlying `float` value.
e (Log) : Optional log object describing validation status or error context.
BOOL
A wrapped boolean type with attached logging for validation or tracing.
Fields:
v (series bool) : The underlying `bool` value.
e (Log) : Optional log object describing validation status or error context.
STRING
A wrapped string type with attached logging for validation or tracing.
Fields:
v (series string) : The underlying `string` value.
e (Log) : Optional log object describing validation status or error context.
COLOR
A wrapped color type with attached logging for validation or tracing.
Fields:
v (series color) : The underlying `color` value.
e (Log) : Optional log object describing validation status or error context.
LINE
A wrapped line object with attached logging for validation or tracing.
Fields:
v (series line) : The underlying `line` value.
e (Log) : Optional log object describing validation status or error context.
LABEL
A wrapped label object with attached logging for validation or tracing.
Fields:
v (series label) : The underlying `label` value.
e (Log) : Optional log object describing validation status or error context.
BOX
A wrapped box object with attached logging for validation or tracing.
Fields:
v (series box) : The underlying `box` value.
e (Log) : Optional log object describing validation status or error context.
TABLE
A wrapped table object with attached logging for validation or tracing.
Fields:
v (series table) : The underlying `table` value.
e (Log) : Optional log object describing validation status or error context.
CHART_POINT
A wrapped chart point with attached logging for validation or tracing.
Fields:
v (chart.point) : The underlying `chart.point` value.
e (Log) : Optional log object describing validation status or error context.
POLYLINE
A wrapped polyline object with attached logging for validation or tracing.
Fields:
v (series polyline) : The underlying `polyline` value.
e (Log) : Optional log object describing validation status or error context.
LINEFILL
A wrapped linefill object with attached logging for validation or tracing.
Fields:
v (series linefill) : The underlying `linefill` value.
e (Log) : Optional log object describing validation status or error context.

Strategy Stats [presentTrading]Hello! it's another weekend. This tool is a strategy performance analysis tool. Looking at the TradingView community, it seems few creators focus on this aspect. I've intentionally created a shared version. Welcome to share your idea or question on this.
█ Introduction and How it is Different
Strategy Stats is a comprehensive performance analytics framework designed specifically for trading strategies. Unlike standard strategy backtesting tools that simply show cumulative profits, this analytics suite provides real-time, multi-timeframe statistical analysis of your trading performance.
Multi-timeframe analysis: Automatically tracks performance metrics across the most recent time periods (last 7 days, 30 days, 90 days, 1 year, and 4 years)
Advanced statistical measures: Goes beyond basic metrics to include Information Coefficient (IC) and Sortino Ratio
Real-time feedback: Updates performance statistics with each new trade
Visual analytics: Color-coded performance table provides instant visual feedback on strategy health
Integrated risk management: Implements sophisticated take profit mechanisms with 3-step ATR and percentage-based exits
BTCUSD Performance
The table in the upper right corner is a comprehensive performance dashboard showing trading strategy statistics.
Note: While this presentation uses Vegas SuperTrend as the underlying strategy, this is merely an example. The Stats framework can be applied to any trading strategy. The Vegas SuperTrend implementation is included solely to demonstrate how the analytics module integrates with a trading strategy.
⚠️ Timeframe Limitations
Important: TradingView's backtesting engine has a maximum storage limit of 10,000 bars. When using this strategy stats framework on smaller timeframes such as 1-hour or 2-hour charts, you may encounter errors if your backtesting period is too long.
Recommended Timeframe Usage:
Ideal for: 4H, 6H, 8H, Daily charts and above
May cause errors on: 1H, 2H charts spanning multiple years
Not recommended for: Timeframes below 1H with long history
█ Strategy, How it Works: Detailed Explanation
The Strategy Stats framework consists of three primary components: statistical data collection, performance analysis, and visualization.
🔶 Statistical Data Collection
The system maintains several critical data arrays:
equityHistory: Tracks equity curve over time
tradeHistory: Records profit/loss of each trade
predictionSignals: Stores trade direction signals (1 for long, -1 for short)
actualReturns: Records corresponding actual returns from each trade
For each closed trade, the system captures:
float tradePnL = strategy.closedtrades.profit(tradeIndex)
float tradeReturn = strategy.closedtrades.profit_percent(tradeIndex)
int tradeType = entryPrice < exitPrice ? 1 : -1 // Direction
🔶 Performance Metrics Calculation
The framework calculates several key performance metrics:
Information Coefficient (IC):
The correlation between prediction signals and actual returns, measuring forecast skill.
IC = Correlation(predictionSignals, actualReturns)
Where Correlation is the Pearson correlation coefficient:
Correlation(X,Y) = (nΣXY - ΣXY) / √
Sortino Ratio:
Measures risk-adjusted return focusing only on downside risk:
Sortino = (Avg_Return - Risk_Free_Rate) / Downside_Deviation
Where Downside Deviation is:
Downside_Deviation = √
R_i represents individual returns, T is the target return (typically the risk-free rate), and n is the number of observations.
Maximum Drawdown:
Tracks the largest percentage drop from peak to trough:
DD = (Peak_Equity - Trough_Equity) / Peak_Equity * 100
🔶 Time Period Calculation
The system automatically determines the appropriate number of bars to analyze for each timeframe based on the current chart timeframe:
bars_7d = math.max(1, math.round(7 * barsPerDay))
bars_30d = math.max(1, math.round(30 * barsPerDay))
bars_90d = math.max(1, math.round(90 * barsPerDay))
bars_365d = math.max(1, math.round(365 * barsPerDay))
bars_4y = math.max(1, math.round(365 * 4 * barsPerDay))
Where barsPerDay is calculated based on the chart timeframe:
barsPerDay = timeframe.isintraday ?
24 * 60 / math.max(1, (timeframe.in_seconds() / 60)) :
timeframe.isdaily ? 1 :
timeframe.isweekly ? 1/7 :
timeframe.ismonthly ? 1/30 : 0.01
🔶 Visual Representation
The system presents performance data in a color-coded table with intuitive visual indicators:
Green: Excellent performance
Lime: Good performance
Gray: Neutral performance
Orange: Mediocre performance
Red: Poor performance
█ Trade Direction
The Strategy Stats framework supports three trading directions:
Long Only: Only takes long positions when entry conditions are met
Short Only: Only takes short positions when entry conditions are met
Both: Takes both long and short positions depending on market conditions
█ Usage
To effectively use the Strategy Stats framework:
Apply to existing strategies: Add the performance tracking code to any strategy to gain advanced analytics
Monitor multiple timeframes: Use the multi-timeframe analysis to identify performance trends
Evaluate strategy health: Review IC and Sortino ratios to assess predictive power and risk-adjusted returns
Optimize parameters: Use performance data to refine strategy parameters
Compare strategies: Apply the framework to multiple strategies to identify the most effective approach
For best results, allow the strategy to generate sufficient trade history for meaningful statistical analysis (at least 20-30 trades).
█ Default Settings
The default settings have been carefully calibrated for cryptocurrency markets:
Performance Tracking:
Time periods: 7D, 30D, 90D, 1Y, 4Y
Statistical measures: Return, Win%, MaxDD, IC, Sortino Ratio
IC color thresholds: >0.3 (green), >0.1 (lime), <-0.1 (orange), <-0.3 (red)
Sortino color thresholds: >1.0 (green), >0.5 (lime), <0 (red)
Multi-Step Take Profit:
ATR multipliers: 2.618, 5.0, 10.0
Percentage levels: 3%, 8%, 17%
Short multiplier: 1.5x (makes short take profits more aggressive)
Stop loss: 20%

Keltner Channel StrategyOverview
The Keltner Channel Strategy is a powerful trend-following and mean-reversion system that leverages the Keltner Channels, EMA crossovers, and ATR-based stop-losses to optimize trade entries and exits. This strategy has proven to be highly effective, particularly when applied to Gold (XAUUSD) and other commodities with strong trend characteristics.
📈 How It Works
This strategy incorporates two trading approaches: 1️⃣ Keltner Channel Reversal Trades – Identifies overbought and oversold conditions when price touches the outer bands.
2️⃣ Trend Following Trades – Uses the 9 EMA & 21 EMA crossover, with confirmation from the 50 EMA, to enter trades in the direction of the trend.
🔍 Entry & Exit Criteria
📊 Keltner Channel Entries (Reversal Strategy)
✅ Long Entry: When the price crosses below the lower Keltner Band (potential reversal).
✅ Short Entry: When the price crosses above the upper Keltner Band (potential reversal).
⏳ Exit Conditions:
Long positions close when price crosses back above the mid-band (EMA-based).
Short positions close when price crosses back below the mid-band (EMA-based).
📈 Trend Following Entries (Momentum Strategy)
✅ Long Entry: When the 9 EMA crosses above the 21 EMA, and price is above the 50 EMA (bullish momentum).
✅ Short Entry: When the 9 EMA crosses below the 21 EMA, and price is below the 50 EMA (bearish momentum).
⏳ Exit Conditions:
Long positions close when the 9 EMA crosses back below the 21 EMA.
Short positions close when the 9 EMA crosses back above the 21 EMA.
📌 Risk Management & Profit Targeting
ATR-based Stop-Losses:
Long trades: Stop set at 1.5x ATR below entry price.
Short trades: Stop set at 1.5x ATR above entry price.
Take-Profit Levels:
Long trades: Profit target 2x ATR above entry price.
Short trades: Profit target 2x ATR below entry price.
🚀 Why Use This Strategy?
✅ Works exceptionally well on Gold (XAUUSD) due to high volatility.
✅ Combines reversal & trend strategies for improved adaptability.
✅ Uses ATR-based risk management for dynamic position sizing.
✅ Fully automated alerts for trade entries and exits.
🔔 Alerts
This script includes automated TradingView alerts for:
🔹 Keltner Band touches (Reversal signals).
🔹 EMA crossovers (Momentum trades).
🔹 Stop-loss & Take-profit activations.
📊 Ideal Markets & Timeframes
Best for: Gold (XAUUSD), NASDAQ (NQ), Crude Oil (CL), and trending assets.
Recommended Timeframes: 15m, 1H, 4H, Daily.
⚡️ How to Use
1️⃣ Add this script to your TradingView chart.
2️⃣ Select a 15m, 1H, or 4H timeframe for optimal results.
3️⃣ Enable alerts to receive trade notifications in real time.
4️⃣ Backtest and tweak ATR settings to fit your trading style.
🚀 Optimize your Gold trading with this Keltner Channel Strategy! Let me know how it performs for you. 💰📊

Money Flow Indicator (Chaikin Oscillator) with VWAPStrategy Overview
Entry Conditions:
Buy Entry:
The Chaikin Oscillator crosses above the signal line.
The current price is above the VWAP.
Sell Entry:
The Chaikin Oscillator crosses below the signal line.
The current price is below the VWAP.
Exit Conditions:
Profit Taking:
Take profit when a target profit is reached (e.g., a 2% increase from the entry price).
Stop Loss:
Set a stop loss, for example, at a 1% decline from the entry price.
Risk Management:
Manage risk by limiting each trade to no more than 1-2% of the account balance.
Calculate position size based on risk and trade accordingly.
Trend Confirmation:
Use other indicators (like moving averages) to confirm the overall trend and focus trades in the direction of the trend.
In an uptrend, prioritize buy entries; in a downtrend, prioritize sell entries.
Specific Trade Scenarios
Example 1: Buy Entry:
Enter a buy position when the Chaikin Oscillator crosses above the signal line and the price is above the VWAP.
Set a stop loss 1% below the entry price and a profit target 2% above the entry price.
Example 2: Sell Entry:
Enter a sell position when the Chaikin Oscillator crosses below the signal line and the price is below the VWAP.
Set a stop loss 1% above the entry price and a profit target 2% below the entry price.
Additional Considerations
Backtesting: Test this strategy with historical data to evaluate performance and make adjustments as needed.
Market Conditions: Pay attention to market volatility and economic indicators, adjusting the trading strategy flexibly.
Psychological Factors: Avoid emotional decisions and follow clear rules when trading.

Candlestick Pattern Detector - Vijay PrasadOverview:
This Pine Script v6 indicator is designed to detect and label key candlestick patterns on TradingView charts. It provides real-time visual markers for major bullish and bearish reversal signals, aiding traders in decision-making.
Usefulness:
✅ Saves time by automating candlestick pattern detection.
✅ Reduces manual chart analysis errors.
✅ Works across all markets & timeframes.
✅ Enhances trading strategies with accurate signals.
Candlestick Patterns Recognises:
Bullish Engulfing – A strong bullish reversal pattern.
Bearish Engulfing – Indicates a potential downtrend.
Hammer – Suggests a market bottom or reversal.
Shooting Star – A bearish reversal signal at the top of an uptrend.
Doji – Signals market indecision and possible trend change.
Key Functions:
Automated Pattern Visible
Identifies candlestick patterns dynamically and plots them on the chart.
Visual Labels for Patterns
Labels to indicate specific candlestick formations.
Labels appear only when a valid pattern is detected, avoiding unnecessary clutter.
Buy/Sell Signal
Plots buy signals at bullish patterns and sell signals at bearish patterns.
Helps traders recognize trend reversals and entry/exit points.
Bullish Engulfing Pattern (Green Label)
What it means: A bullish engulfing pattern typically signals a potential reversal from a downtrend to an uptrend. The current candle fully engulfs the previous candle, signaling strong buying interest.
Identifying Candlestick Patterns on the Chart
How to use it:
Entry: Look for a green label (bullish engulfing) at the bottom of the chart. When it appears, consider entering a long position (buy).
Confirmation: To increase reliability, wait for confirmation by observing if price moves above the high of the bullish engulfing candle.
Exit: Exit when the trend shows signs of reversing or take profit at predefined levels (e.g., resistance or a risk-to-reward ratio).
Bearish Engulfing Pattern (Red Label)
What it means: A bearish engulfing pattern is a signal of a potential reversal from an uptrend to a downtrend. The current candle fully engulfs the previous candle, signaling strong selling pressure.
How to use it:
Entry: Look for a red label (bearish engulfing) at the top of the chart. When it appears, consider entering a short position (sell).
Confirmation: Wait for the price to move below the low of the bearish engulfing candle to confirm the bearish trend.
Exit: Close the trade when the price reaches support levels or the trend shows signs of reversing.
Doji Pattern (Blue Circle)
What it means: A Doji candle signals market indecision. It represents a balance between buyers and sellers, often marking a potential reversal or consolidation point.
How to use it:
Entry: If the Doji appears after a strong trend (bullish or bearish), wait for the next candle to break above or below the Doji's high or low. This can signal a continuation or reversal.
Confirmation: You can look for additional indicators like moving averages, RSI, or MACD for confirmation before taking any action.
Exit: Exit when the price shows clear momentum in your entry direction.
Hammer Pattern (Orange Triangle)
What it means: The hammer pattern is a bullish reversal pattern that appears after a downtrend. It suggests that sellers pushed the price down during the session, but buyers managed to push the price back up.
How to use it:
Entry: When a hammer appears, consider entering a long position (buy). The price should move above the hammer's high for confirmation.
Confirmation: Look for strong volume and a follow-up bullish candle to confirm the reversal.
Exit: Set a target based on the next resistance level, or use a trailing stop to lock in profits.
Using Candlestick Patterns with Other Indicators
To increase your chances of success, combine candlestick patterns with other technical indicators.
Here are some ideas:
RSI (Relative Strength Index): Use RSI to check whether the market is overbought or oversold. A bullish engulfing in an oversold market could indicate a stronger buy signal, and a bearish engulfing in an overbought market could indicate a stronger sell signal.
Moving Averages (e.g., 50 EMA, 200 EMA): Confirm trend direction. If the candlestick pattern aligns with the direction of the moving averages, it can give a stronger signal.
MACD (Moving Average Convergence Divergence): Use MACD to confirm momentum and potential trend changes. If a candlestick pattern aligns with a MACD crossover, it strengthens the signal.
Volume: Look for higher-than-average volume when a pattern appears. This can give you additional confirmation that the market is reacting strongly.
Practice and Refine
It's important to practice using the candlestick patterns in a demo account or backtest them to see how they perform under different market conditions. Over time, you can adjust the settings and patterns to fit your trading style and preferences.

CapitalManagementLibrary "CapitalManagement"
TODO: Manage the capital
order_volume(percent_risk, order_entry_price, stop_loss_price)
: Function to calculate order volume according to give risk percent_risk
Parameters:
percent_risk (float)
order_entry_price (float)
stop_loss_price (float)
calculate_takeprofit_price(entry_price, stop_loss_price, risk_reward)
: Function to calculate take profit price according to given risk:reward ratio
Parameters:
entry_price (float)
stop_loss_price (float)
risk_reward (float)
Returns: Return take profit value according to given risk:reward ratio
Ichimoku + RSI + MACD Strategy1. Relative Strength Index (RSI)
Overview:
The Relative Strength Index (RSI) is a momentum oscillator that measures the speed and change of price movements. It ranges from 0 to 100 and is typically used to identify overbought or oversold conditions in a market.
How to Use with Ichimoku:
Long Entry: Look for RSI to be above 30 (indicating it is not oversold) when the price is above the Ichimoku Cloud.
Short Entry: Look for RSI to be below 70 (indicating it is not overbought) when the price is below the Ichimoku Cloud.
2. Moving Average Convergence Divergence (MACD)
Overview:
The MACD is a trend-following momentum indicator that shows the relationship between two moving averages of a security’s price. It consists of the MACD line, signal line, and histogram.
How to Use with Ichimoku:
Long Entry: Enter a long position when the MACD line crosses above the signal line while the price is above the Ichimoku Cloud.
Short Entry: Enter a short position when the MACD line crosses below the signal line while the price is below the Ichimoku Cloud.
Combined Strategy Example
Here’s a brief outline of how to structure a trading strategy using Ichimoku, RSI, and MACD:
Long Entry Conditions:
Price is above the Ichimoku Cloud.
RSI is above 30.
MACD line crosses above the signal line.
Short Entry Conditions:
Price is below the Ichimoku Cloud.
RSI is below 70.
MACD line crosses below the signal line.
Exit Conditions:
Exit long when MACD line crosses below the signal line.
Exit short when MACD line crosses above the signal line.

Mean Reversion Cloud (Ornstein-Uhlenbeck) // AlgoFyreThe Mean Reversion Cloud (Ornstein-Uhlenbeck) indicator detects mean-reversion opportunities by applying the Ornstein-Uhlenbeck process. It calculates a dynamic mean using an Exponential Weighted Moving Average, surrounded by volatility bands, signaling potential buy/sell points when prices deviate.
TABLE OF CONTENTS
🔶 ORIGINALITY
🔸Adaptive Mean Calculation
🔸Volatility-Based Cloud
🔸Speed of Reversion (θ)
🔶 FUNCTIONALITY
🔸Dynamic Mean and Volatility Bands
🞘 How it works
🞘 How to calculate
🞘 Code extract
🔸Visualization via Table and Plotshapes
🞘 Table Overview
🞘 Plotshapes Explanation
🞘 Code extract
🔶 INSTRUCTIONS
🔸Step-by-Step Guidelines
🞘 Setting Up the Indicator
🞘 Understanding What to Look For on the Chart
🞘 Possible Entry Signals
🞘 Possible Take Profit Strategies
🞘 Possible Stop-Loss Levels
🞘 Additional Tips
🔸Customize settings
🔶 CONCLUSION
▅▅▅▅▅▅▅▅▅▅▅▅▅▅▅▅▅▅▅▅▅▅▅▅▅▅▅▅▅▅▅▅▅▅▅▅▅▅▅▅▅▅▅▅▅▅
🔶 ORIGINALITY The Mean Reversion Cloud (Ornstein-Uhlenbeck) is a unique indicator that applies the Ornstein-Uhlenbeck stochastic process to identify mean-reverting behavior in asset prices. Unlike traditional moving average-based indicators, this model uses an Exponentially Weighted Moving Average (EWMA) to calculate the long-term mean, dynamically adjusting to recent price movements while still considering all historical data. It also incorporates volatility bands, providing a "cloud" that visually highlights overbought or oversold conditions. By calculating the speed of mean reversion (θ) through the autocorrelation of log returns, this indicator offers traders a more nuanced and mathematically robust tool for identifying mean-reversion opportunities. These innovations make it especially useful for markets that exhibit range-bound characteristics, offering timely buy and sell signals based on statistical deviations from the mean.
🔸Adaptive Mean Calculation Traditional MA indicators use fixed lengths, which can lead to lagging signals or over-sensitivity in volatile markets. The Mean Reversion Cloud uses an Exponentially Weighted Moving Average (EWMA), which adapts to price movements by dynamically adjusting its calculation, offering a more responsive mean.
🔸Volatility-Based Cloud Unlike simple moving averages that only plot a single line, the Mean Reversion Cloud surrounds the dynamic mean with volatility bands. These bands, based on standard deviations, provide traders with a visual cue of when prices are statistically likely to revert, highlighting potential reversal zones.
🔸Speed of Reversion (θ) The indicator goes beyond price averages by calculating the speed at which the price reverts to the mean (θ), using the autocorrelation of log returns. This gives traders an additional tool for estimating the likelihood and timing of mean reversion, making the signals more reliable in practice.
🔶 FUNCTIONALITY The Mean Reversion Cloud (Ornstein-Uhlenbeck) indicator is designed to detect potential mean-reversion opportunities in asset prices by applying the Ornstein-Uhlenbeck stochastic process. It calculates a dynamic mean through the Exponentially Weighted Moving Average (EWMA) and plots volatility bands based on the standard deviation of the asset's price over a specified period. These bands create a "cloud" that represents expected price fluctuations, helping traders to identify overbought or oversold conditions. By calculating the speed of reversion (θ) from the autocorrelation of log returns, the indicator offers a more refined way of assessing how quickly prices may revert to the mean. Additionally, the inclusion of volatility provides a comprehensive view of market conditions, allowing for more accurate buy and sell signals.
Let's dive into the details:
🔸Dynamic Mean and Volatility Bands The dynamic mean (μ) is calculated using the EWMA, giving more weight to recent prices but considering all historical data. This process closely resembles the Ornstein-Uhlenbeck (OU) process, which models the tendency of a stochastic variable (such as price) to revert to its mean over time. Volatility bands are plotted around the mean using standard deviation, forming the "cloud" that signals overbought or oversold conditions. The cloud adapts dynamically to price fluctuations and market volatility, making it a versatile tool for mean-reversion strategies. 🞘 How it works Step one: Calculate the dynamic mean (μ) The Ornstein-Uhlenbeck process describes how a variable, such as an asset's price, tends to revert to a long-term mean while subject to random fluctuations. In this indicator, the EWMA is used to compute the dynamic mean (μ), mimicking the mean-reverting behavior of the OU process. Use the EWMA formula to compute a weighted mean that adjusts to recent price movements. Assign exponentially decreasing weights to older data while giving more emphasis to current prices. Step two: Plot volatility bands Calculate the standard deviation of the price over a user-defined period to determine market volatility. Position the upper and lower bands around the mean by adding and subtracting a multiple of the standard deviation. 🞘 How to calculate Exponential Weighted Moving Average (EWMA)
The EWMA dynamically adjusts to recent price movements:
mu_t = lambda * mu_{t-1} + (1 - lambda) * P_t
Where mu_t is the mean at time t, lambda is the decay factor, and P_t is the price at time t. The higher the decay factor, the more weight is given to recent data.
Autocorrelation (ρ) and Standard Deviation (σ)
To measure mean reversion speed and volatility: rho = correlation(log(close), log(close ), length) Where rho is the autocorrelation of log returns over a specified period.
To calculate volatility:
sigma = stdev(close, length)
Where sigma is the standard deviation of the asset's closing price over a specified length.
Upper and Lower Bands
The upper and lower bands are calculated as follows:
upper_band = mu + (threshold * sigma)
lower_band = mu - (threshold * sigma)
Where threshold is a multiplier for the standard deviation, usually set to 2. These bands represent the range within which the price is expected to fluctuate, based on current volatility and the mean.
🞘 Code extract // Calculate Returns
returns = math.log(close / close )
// Calculate Long-Term Mean (μ) using EWMA over the entire dataset
var float ewma_mu = na // Initialize ewma_mu as 'na'
ewma_mu := na(ewma_mu ) ? close : decay_factor * ewma_mu + (1 - decay_factor) * close
mu = ewma_mu
// Calculate Autocorrelation at Lag 1
rho1 = ta.correlation(returns, returns , corr_length)
// Ensure rho1 is within valid range to avoid errors
rho1 := na(rho1) or rho1 <= 0 ? 0.0001 : rho1
// Calculate Speed of Mean Reversion (θ)
theta = -math.log(rho1)
// Calculate Volatility (σ)
sigma = ta.stdev(close, corr_length)
// Calculate Upper and Lower Bands
upper_band = mu + threshold * sigma
lower_band = mu - threshold * sigma
🔸Visualization via Table and Plotshapes
The table shows key statistics such as the current value of the dynamic mean (μ), the number of times the price has crossed the upper or lower bands, and the consecutive number of bars that the price has remained in an overbought or oversold state.
Plotshapes (diamonds) are used to signal buy and sell opportunities. A green diamond below the price suggests a buy signal when the price crosses below the lower band, and a red diamond above the price indicates a sell signal when the price crosses above the upper band.
The table and plotshapes provide a comprehensive visualization, combining both statistical and actionable information to aid decision-making.
🞘 Code extract // Reset consecutive_bars when price crosses the mean
var consecutive_bars = 0
if (close < mu and close >= mu) or (close > mu and close <= mu)
consecutive_bars := 0
else if math.abs(deviation) > 0
consecutive_bars := math.min(consecutive_bars + 1, dev_length)
transparency = math.max(0, math.min(100, 100 - (consecutive_bars * 100 / dev_length)))
🔶 INSTRUCTIONS
The Mean Reversion Cloud (Ornstein-Uhlenbeck) indicator can be set up by adding it to your TradingView chart and configuring parameters such as the decay factor, autocorrelation length, and volatility threshold to suit current market conditions. Look for price crossovers and deviations from the calculated mean for potential entry signals. Use the upper and lower bands as dynamic support/resistance levels for setting take profit and stop-loss orders. Combining this indicator with additional trend-following or momentum-based indicators can improve signal accuracy. Adjust settings for better mean-reversion detection and risk management.
🔸Step-by-Step Guidelines
🞘 Setting Up the Indicator
Adding the Indicator to the Chart:
Go to your TradingView chart.
Click on the "Indicators" button at the top.
Search for "Mean Reversion Cloud (Ornstein-Uhlenbeck)" in the indicators list.
Click on the indicator to add it to your chart.
Configuring the Indicator:
Open the indicator settings by clicking on the gear icon next to its name on the chart.
Decay Factor: Adjust the decay factor (λ) to control the responsiveness of the mean calculation. A higher value prioritizes recent data.
Autocorrelation Length: Set the autocorrelation length (θ) for calculating the speed of mean reversion. Longer lengths consider more historical data.
Threshold: Define the number of standard deviations for the upper and lower bands to determine how far price must deviate to trigger a signal.
Chart Setup:
Select the appropriate timeframe (e.g., 1-hour, daily) based on your trading strategy.
Consider using other indicators such as RSI or MACD to confirm buy and sell signals.
🞘 Understanding What to Look For on the Chart
Indicator Behavior:
Observe how the price interacts with the dynamic mean and volatility bands. The price staying within the bands suggests mean-reverting behavior, while crossing the bands signals potential entry points.
The indicator calculates overbought/oversold conditions based on deviation from the mean, highlighted by color-coded cloud areas on the chart.
Crossovers and Deviation:
Look for crossovers between the price and the mean (μ) or the bands. A bullish crossover occurs when the price crosses below the lower band, signaling a potential buying opportunity.
A bearish crossover occurs when the price crosses above the upper band, suggesting a potential sell signal.
Deviations from the mean indicate market extremes. A large deviation indicates that the price is far from the mean, suggesting a potential reversal.
Slope and Direction:
Pay attention to the slope of the mean (μ). A rising slope suggests bullish market conditions, while a declining slope signals a bearish market.
The steepness of the slope can indicate the strength of the mean-reversion trend.
🞘 Possible Entry Signals
Bullish Entry:
Crossover Entry: Enter a long position when the price crosses below the lower band with a positive deviation from the mean.
Confirmation Entry: Use additional indicators like RSI (above 50) or increasing volume to confirm the bullish signal.
Bearish Entry:
Crossover Entry: Enter a short position when the price crosses above the upper band with a negative deviation from the mean.
Confirmation Entry: Look for RSI (below 50) or decreasing volume to confirm the bearish signal.
Deviation Confirmation:
Enter trades when the deviation from the mean is significant, indicating that the price has strayed far from its expected value and is likely to revert.
🞘 Possible Take Profit Strategies
Static Take Profit Levels:
Set predefined take profit levels based on historical volatility, using the upper and lower bands as guides.
Place take profit orders near recent support/resistance levels, ensuring you're capitalizing on the mean-reversion behavior.
Trailing Stop Loss:
Use a trailing stop based on a percentage of the price deviation from the mean to lock in profits as the trend progresses.
Adjust the trailing stop dynamically along the calculated bands to protect profits as the price returns to the mean.
Deviation-Based Exits:
Exit when the deviation from the mean starts to decrease, signaling that the price is returning to its equilibrium.
🞘 Possible Stop-Loss Levels
Initial Stop Loss:
Place an initial stop loss outside the lower band (for long positions) or above the upper band (for short positions) to protect against excessive deviations.
Use a volatility-based buffer to avoid getting stopped out during normal price fluctuations.
Dynamic Stop Loss:
Move the stop loss closer to the mean as the price converges back towards equilibrium, reducing risk.
Adjust the stop loss dynamically along the bands to account for sudden market movements.
🞘 Additional Tips
Combine with Other Indicators:
Enhance your strategy by combining the Mean Reversion Cloud with momentum indicators like MACD, RSI, or Bollinger Bands to confirm market conditions.
Backtesting and Practice:
Backtest the indicator on historical data to understand how it performs in various market environments.
Practice using the indicator on a demo account before implementing it in live trading.
Market Awareness:
Keep an eye on market news and events that might cause extreme price movements. The indicator reacts to price data and might not account for news-driven events that can cause large deviations.
🔸Customize settings 🞘 Decay Factor (λ): Defines the weight assigned to recent price data in the calculation of the mean. A value closer to 1 places more emphasis on recent prices, while lower values create a smoother, more lagging mean.
🞘 Autocorrelation Length (θ): Sets the period for calculating the speed of mean reversion and volatility. Longer lengths capture more historical data, providing smoother calculations, while shorter lengths make the indicator more responsive.
🞘 Threshold (σ): Specifies the number of standard deviations used to create the upper and lower bands. Higher thresholds widen the bands, producing fewer signals, while lower thresholds tighten the bands for more frequent signals.
🞘 Max Gradient Length (γ): Determines the maximum number of consecutive bars for calculating the deviation gradient. This setting impacts the transparency of the plotted bands based on the length of deviation from the mean.
🔶 CONCLUSION
The Mean Reversion Cloud (Ornstein-Uhlenbeck) indicator offers a sophisticated approach to identifying mean-reversion opportunities by applying the Ornstein-Uhlenbeck stochastic process. This dynamic indicator calculates a responsive mean using an Exponentially Weighted Moving Average (EWMA) and plots volatility-based bands to highlight overbought and oversold conditions. By incorporating advanced statistical measures like autocorrelation and standard deviation, traders can better assess market extremes and potential reversals. The indicator’s ability to adapt to price behavior makes it a versatile tool for traders focused on both short-term price deviations and longer-term mean-reversion strategies. With its unique blend of statistical rigor and visual clarity, the Mean Reversion Cloud provides an invaluable tool for understanding and capitalizing on market inefficiencies.

Ichimoku Crosses_RSI_AITIchimoku Crosser_RSI_AIT
Overview
The "Ichimoku Cloud Crosses_AIT" strategy is a technical trading strategy that combines the Ichimoku Cloud components with the Relative Strength Index (RSI) to generate trade signals. This strategy leverages the crossovers of the Tenkan-sen and Kijun-sen lines of the Ichimoku Cloud, along with RSI levels, to identify potential entry and exit points for long and short trades. This guide explains the strategy components, conditions, and how to use it effectively in your trading.
1. Strategy Parameters
User Inputs
Tenkan-sen Period (tenkanLength): Default value is 21. This is the period used to calculate the Tenkan-sen line (conversion line) of the Ichimoku Cloud.
Kijun-sen Period (kijunLength): Default value is 120. This is the period used to calculate the Kijun-sen line (base line) of the Ichimoku Cloud.
Senkou Span B Period (senkouBLength): Default value is 52. This is the period used to calculate the Senkou Span B line (leading span B) of the Ichimoku Cloud.
RSI Period (rsiLength): Default value is 14. This period is used to calculate the Relative Strength Index (RSI).
RSI Long Entry Level (rsiLongLevel): Default value is 60. This level indicates the minimum RSI value for a long entry signal.
RSI Short Entry Level (rsiShortLevel): Default value is 40. This level indicates the maximum RSI value for a short entry signal.
2. Strategy Components
Ichimoku Cloud
Tenkan-sen: A short-term trend indicator calculated as the simple moving average (SMA) of the highest high and the lowest low over the Tenkan-sen period.
Kijun-sen: A medium-term trend indicator calculated as the SMA of the highest high and the lowest low over the Kijun-sen period.
Senkou Span A: Calculated as the average of the Tenkan-sen and Kijun-sen, plotted 26 periods ahead.
Senkou Span B: Calculated as the SMA of the highest high and lowest low over the Senkou Span B period, plotted 26 periods ahead.
Chikou Span: The closing price plotted 26 periods behind.
Relative Strength Index (RSI)
RSI: A momentum oscillator that measures the speed and change of price movements. It ranges from 0 to 100 and is used to identify overbought or oversold conditions.
3. Entry and Exit Conditions
Entry Conditions
Long Entry:
The Tenkan-sen crosses above the Kijun-sen (bullish crossover).
The RSI value is greater than or equal to the rsiLongLevel.
Short Entry:
The Tenkan-sen crosses below the Kijun-sen (bearish crossover).
The RSI value is less than or equal to the rsiShortLevel.
Exit Conditions
Exit Long Position: The Tenkan-sen crosses below the Kijun-sen.
Exit Short Position: The Tenkan-sen crosses above the Kijun-sen.
4. Visual Representation
Tenkan-sen Line: Plotted on the chart. The color changes based on its relation to the Kijun-sen (green if above, red if below) and is displayed with a line width of 2.
Kijun-sen Line: Plotted as a white line with a line width of 1.
Entry Arrows:
Long Entry: Displayed as a yellow triangle below the bar.
Short Entry: Displayed as a fuchsia triangle above the bar.
5. How to Use
Apply the Strategy: Apply the "Ichimoku Cloud Crosses_AIT" strategy to your chart in TradingView.
Configure Parameters: Adjust the strategy parameters (Tenkan-sen, Kijun-sen, Senkou Span B, and RSI settings) according to your trading preferences.
Interpret the Signals:
Long Entry: A yellow triangle appears below the bar when a long entry signal is generated.
Short Entry: A fuchsia triangle appears above the bar when a short entry signal is generated.
Monitor Open Positions: The strategy automatically exits positions based on the defined conditions.
Backtesting and Live Trading: Use the strategy for backtesting and live trading. Adjust risk management settings in the strategy properties as needed.
Conclusion
The "Ichimoku Cloud Crosses_AIT" strategy uses Ichimoku Cloud crossovers and RSI to generate trading signals. This strategy aims to capture market trends and potential reversals, providing a structured way to enter and exit trades. Make sure to backtest and optimize the strategy parameters to suit your trading style and market conditions before using it in a live trading environment.

TRADINGLibrary "TRADING"
This library is a client script for making a webhook signal formatted string to PoABOT server.
entry_message(password, percent, leverage, margin_mode, kis_number)
Create a entry message for POABOT
Parameters:
password (string) : (string) The password of your bot.
percent (float) : (float) The percent for entry based on your wallet balance.
leverage (int) : (int) The leverage of entry. If not set, your levereage doesn't change.
margin_mode (string) : (string) The margin mode for trade(only for OKX). "cross" or "isolated"
kis_number (int) : (int) The number of koreainvestment account. Default 1
Returns: (string) A json formatted string for webhook message.
order_message(password, percent, leverage, margin_mode, kis_number)
Create a order message for POABOT
Parameters:
password (string) : (string) The password of your bot.
percent (float) : (float) The percent for entry based on your wallet balance.
leverage (int) : (int) The leverage of entry. If not set, your levereage doesn't change.
margin_mode (string) : (string) The margin mode for trade(only for OKX). "cross" or "isolated"
kis_number (int) : (int) The number of koreainvestment account. Default 1
Returns: (string) A json formatted string for webhook message.
close_message(password, percent, margin_mode, kis_number)
Create a close message for POABOT
Parameters:
password (string) : (string) The password of your bot.
percent (float) : (float) The percent for close based on your wallet balance.
margin_mode (string) : (string) The margin mode for trade(only for OKX). "cross" or "isolated"
kis_number (int) : (int) The number of koreainvestment account. Default 1
Returns: (string) A json formatted string for webhook message.
exit_message(password, percent, margin_mode, kis_number)
Create a exit message for POABOT
Parameters:
password (string) : (string) The password of your bot.
percent (float) : (float) The percent for exit based on your wallet balance.
margin_mode (string) : (string) The margin mode for trade(only for OKX). "cross" or "isolated"
kis_number (int) : (int) The number of koreainvestment account. Default 1
Returns: (string) A json formatted string for webhook message.
manual_message(password, exchange, base, quote, side, qty, price, percent, leverage, margin_mode, kis_number, order_name)
Create a manual message for POABOT
Parameters:
password (string) : (string) The password of your bot.
exchange (string) : (string) The exchange
base (string) : (string) The base
quote (string) : (string) The quote of order message
side (string) : (string) The side of order messsage
qty (float) : (float) The qty of order message
price (float) : (float) The price of order message
percent (float) : (float) The percent for order based on your wallet balance.
leverage (int) : (int) The leverage of entry. If not set, your levereage doesn't change.
margin_mode (string) : (string) The margin mode for trade(only for OKX). "cross" or "isolated"
kis_number (int) : (int) The number of koreainvestment account.
order_name (string) : (string) The name of order message
Returns: (string) A json formatted string for webhook message.
in_trade(start_time, end_time, hide_trade_line)
Create a trade start line
Parameters:
start_time (int) : (int) The start of time.
end_time (int) : (int) The end of time.
hide_trade_line (bool) : (bool) if true, hide trade line. Default false.
Returns: (bool) Get bool for trade based on time range.
real_qty(qty, precision, leverage, contract_size, default_qty_type, default_qty_value)
Get exchange specific real qty
Parameters:
qty (float) : (float) qty
precision (float) : (float) precision
leverage (int) : (int) leverage
contract_size (float) : (float) contract_size
default_qty_type (string)
default_qty_value (float)
Returns: (float) exchange specific qty.
method set(this, password, start_time, end_time, leverage, initial_capital, default_qty_type, default_qty_value, margin_mode, contract_size, kis_number, entry_percent, close_percent, exit_percent, fixed_qty, fixed_cash, real, auto_alert_message, hide_trade_line)
Set bot object.
Namespace types: bot
Parameters:
this (bot)
password (string) : (string) password for poabot.
start_time (int) : (int) start_time timestamp.
end_time (int) : (int) end_time timestamp.
leverage (int) : (int) leverage.
initial_capital (float)
default_qty_type (string)
default_qty_value (float)
margin_mode (string) : (string) The margin mode for trade(only for OKX). "cross" or "isolated"
contract_size (float)
kis_number (int) : (int) kis_number for poabot.
entry_percent (float) : (float) entry_percent for poabot.
close_percent (float) : (float) close_percent for poabot.
exit_percent (float) : (float) exit_percent for poabot.
fixed_qty (float) : (float) fixed qty.
fixed_cash (float) : (float) fixed cash.
real (bool) : (bool) convert qty for exchange specific.
auto_alert_message (bool) : (bool) convert alert_message for exchange specific.
hide_trade_line (bool) : (bool) if true, Hide trade line. Default false.
Returns: (void)
method print(this, message)
Print message using log table.
Namespace types: bot
Parameters:
this (bot)
message (string)
Returns: (void)
method start_trade(this)
start trade using start_time and end_time
Namespace types: bot
Parameters:
this (bot)
Returns: (void)
method entry(this, id, direction, qty, limit, stop, oca_name, oca_type, comment, alert_message, when)
It is a command to enter market position. If an order with the same ID is already pending, it is possible to modify the order. If there is no order with the specified ID, a new order is placed. To deactivate an entry order, the command strategy.cancel or strategy.cancel_all should be used. In comparison to the function strategy.order, the function strategy.entry is affected by pyramiding and it can reverse market position correctly. If both 'limit' and 'stop' parameters are 'NaN', the order type is market order.
Namespace types: bot
Parameters:
this (bot)
id (string) : (string) A required parameter. The order identifier. It is possible to cancel or modify an order by referencing its identifier.
direction (string) : (string) A required parameter. Market position direction: 'strategy.long' is for long, 'strategy.short' is for short.
qty (float) : (float) An optional parameter. Number of contracts/shares/lots/units to trade. The default value is 'NaN'.
limit (float) : (float) An optional parameter. Limit price of the order. If it is specified, the order type is either 'limit', or 'stop-limit'. 'NaN' should be specified for any other order type.
stop (float) : (float) An optional parameter. Stop price of the order. If it is specified, the order type is either 'stop', or 'stop-limit'. 'NaN' should be specified for any other order type.
oca_name (string) : (string) An optional parameter. Name of the OCA group the order belongs to. If the order should not belong to any particular OCA group, there should be an empty string.
oca_type (string) : (string) An optional parameter. Type of the OCA group. The allowed values are: "strategy.oca.none" - the order should not belong to any particular OCA group; "strategy.oca.cancel" - the order should belong to an OCA group, where as soon as an order is filled, all other orders of the same group are cancelled; "strategy.oca.reduce" - the order should belong to an OCA group, where if X number of contracts of an order is filled, number of contracts for each other order of the same OCA group is decreased by X.
comment (string) : (string) An optional parameter. Additional notes on the order.
alert_message (string) : (string) An optional parameter which replaces the {{strategy.order.alert_message}} placeholder when it is used in the "Create Alert" dialog box's "Message" field.
when (bool) : (bool) An optional parmeter. Condition, deprecated.
Returns: (void)
method order(this, id, direction, qty, limit, stop, oca_name, oca_type, comment, alert_message, when)
It is a command to place order. If an order with the same ID is already pending, it is possible to modify the order. If there is no order with the specified ID, a new order is placed. To deactivate order, the command strategy.cancel or strategy.cancel_all should be used. In comparison to the function strategy.entry, the function strategy.order is not affected by pyramiding. If both 'limit' and 'stop' parameters are 'NaN', the order type is market order.
Namespace types: bot
Parameters:
this (bot)
id (string) : (string) A required parameter. The order identifier. It is possible to cancel or modify an order by referencing its identifier.
direction (string) : (string) A required parameter. Market position direction: 'strategy.long' is for long, 'strategy.short' is for short.
qty (float) : (float) An optional parameter. Number of contracts/shares/lots/units to trade. The default value is 'NaN'.
limit (float) : (float) An optional parameter. Limit price of the order. If it is specified, the order type is either 'limit', or 'stop-limit'. 'NaN' should be specified for any other order type.
stop (float) : (float) An optional parameter. Stop price of the order. If it is specified, the order type is either 'stop', or 'stop-limit'. 'NaN' should be specified for any other order type.
oca_name (string) : (string) An optional parameter. Name of the OCA group the order belongs to. If the order should not belong to any particular OCA group, there should be an empty string.
oca_type (string) : (string) An optional parameter. Type of the OCA group. The allowed values are: "strategy.oca.none" - the order should not belong to any particular OCA group; "strategy.oca.cancel" - the order should belong to an OCA group, where as soon as an order is filled, all other orders of the same group are cancelled; "strategy.oca.reduce" - the order should belong to an OCA group, where if X number of contracts of an order is filled, number of contracts for each other order of the same OCA group is decreased by X.
comment (string) : (string) An optional parameter. Additional notes on the order.
alert_message (string) : (string) An optional parameter which replaces the {{strategy.order.alert_message}} placeholder when it is used in the "Create Alert" dialog box's "Message" field.
when (bool) : (bool) An optional parmeter. Condition, deprecated.
Returns: (void)
method close_all(this, comment, alert_message, immediately, when)
Exits the current market position, making it flat.
Namespace types: bot
Parameters:
this (bot)
comment (string) : (string) An optional parameter. Additional notes on the order.
alert_message (string) : (string) An optional parameter which replaces the {{strategy.order.alert_message}} placeholder when it is used in the "Create Alert" dialog box's "Message" field.
immediately (bool) : (bool) An optional parameter. If true, the closing order will be executed on the tick where it has been placed, ignoring the strategy parameters that restrict the order execution to the open of the next bar. The default is false.
when (bool) : (bool) An optional parmeter. Condition, deprecated.
Returns: (void)
method cancel(this, id, when)
It is a command to cancel/deactivate pending orders by referencing their names, which were generated by the functions: strategy.order, strategy.entry and strategy.exit.
Namespace types: bot
Parameters:
this (bot)
id (string) : (string) A required parameter. The order identifier. It is possible to cancel an order by referencing its identifier.
when (bool) : (bool) An optional parmeter. Condition, deprecated.
Returns: (void)
method cancel_all(this, when)
It is a command to cancel/deactivate all pending orders, which were generated by the functions: strategy.order, strategy.entry and strategy.exit.
Namespace types: bot
Parameters:
this (bot)
when (bool) : (bool) An optional parmeter. Condition, deprecated.
Returns: (void)
method close(this, id, comment, qty, qty_percent, alert_message, immediately, when)
It is a command to exit from the entry with the specified ID. If there were multiple entry orders with the same ID, all of them are exited at once. If there are no open entries with the specified ID by the moment the command is triggered, the command will not come into effect. The command uses market order. Every entry is closed by a separate market order.
Namespace types: bot
Parameters:
this (bot)
id (string) : (string) A required parameter. The order identifier. It is possible to close an order by referencing its identifier.
comment (string) : (string) An optional parameter. Additional notes on the order.
qty (float) : (float) An optional parameter. Number of contracts/shares/lots/units to exit a trade with. The default value is 'NaN'.
qty_percent (float) : (float) Defines the percentage (0-100) of the position to close. Its priority is lower than that of the 'qty' parameter. Optional. The default is 100.
alert_message (string) : (string) An optional parameter which replaces the {{strategy.order.alert_message}} placeholder when it is used in the "Create Alert" dialog box's "Message" field.
immediately (bool) : (bool) An optional parameter. If true, the closing order will be executed on the tick where it has been placed, ignoring the strategy parameters that restrict the order execution to the open of the next bar. The default is false.
when (bool) : (bool) An optional parmeter. Condition, deprecated.
Returns: (void)
ticks_to_price(ticks, from)
Converts ticks to a price offset from the supplied price or the average entry price.
Parameters:
ticks (float) : (float) Ticks to convert to a price.
from (float) : (float) A price that can be used to calculate from. Optional. The default value is `strategy.position_avg_price`.
Returns: (float) A price level that has a distance from the entry price equal to the specified number of ticks.
method exit(this, id, from_entry, qty, qty_percent, profit, limit, loss, stop, trail_price, trail_points, trail_offset, oca_name, comment, comment_profit, comment_loss, comment_trailing, alert_message, alert_profit, alert_loss, alert_trailing, when)
It is a command to exit either a specific entry, or whole market position. If an order with the same ID is already pending, it is possible to modify the order. If an entry order was not filled, but an exit order is generated, the exit order will wait till entry order is filled and then the exit order is placed. To deactivate an exit order, the command strategy.cancel or strategy.cancel_all should be used. If the function strategy.exit is called once, it exits a position only once. If you want to exit multiple times, the command strategy.exit should be called multiple times. If you use a stop loss and a trailing stop, their order type is 'stop', so only one of them is placed (the one that is supposed to be filled first). If all the following parameters 'profit', 'limit', 'loss', 'stop', 'trail_points', 'trail_offset' are 'NaN', the command will fail. To use market order to exit, the command strategy.close or strategy.close_all should be used.
Namespace types: bot
Parameters:
this (bot)
id (string) : (string) A required parameter. The order identifier. It is possible to cancel or modify an order by referencing its identifier.
from_entry (string) : (string) An optional parameter. The identifier of a specific entry order to exit from it. To exit all entries an empty string should be used. The default values is empty string.
qty (float) : (float) An optional parameter. Number of contracts/shares/lots/units to exit a trade with. The default value is 'NaN'.
qty_percent (float) : (float) Defines the percentage of (0-100) the position to close. Its priority is lower than that of the 'qty' parameter. Optional. The default is 100.
profit (float) : (float) An optional parameter. Profit target (specified in ticks). If it is specified, a limit order is placed to exit market position when the specified amount of profit (in ticks) is reached. The default value is 'NaN'.
limit (float) : (float) An optional parameter. Profit target (requires a specific price). If it is specified, a limit order is placed to exit market position at the specified price (or better). Priority of the parameter 'limit' is higher than priority of the parameter 'profit' ('limit' is used instead of 'profit', if its value is not 'NaN'). The default value is 'NaN'.
loss (float) : (float) An optional parameter. Stop loss (specified in ticks). If it is specified, a stop order is placed to exit market position when the specified amount of loss (in ticks) is reached. The default value is 'NaN'.
stop (float) : (float) An optional parameter. Stop loss (requires a specific price). If it is specified, a stop order is placed to exit market position at the specified price (or worse). Priority of the parameter 'stop' is higher than priority of the parameter 'loss' ('stop' is used instead of 'loss', if its value is not 'NaN'). The default value is 'NaN'.
trail_price (float) : (float) An optional parameter. Trailing stop activation level (requires a specific price). If it is specified, a trailing stop order will be placed when the specified price level is reached. The offset (in ticks) to determine initial price of the trailing stop order is specified in the 'trail_offset' parameter: X ticks lower than activation level to exit long position; X ticks higher than activation level to exit short position. The default value is 'NaN'.
trail_points (float) : (float) An optional parameter. Trailing stop activation level (profit specified in ticks). If it is specified, a trailing stop order will be placed when the calculated price level (specified amount of profit) is reached. The offset (in ticks) to determine initial price of the trailing stop order is specified in the 'trail_offset' parameter: X ticks lower than activation level to exit long position; X ticks higher than activation level to exit short position. The default value is 'NaN'.
trail_offset (float) : (float) An optional parameter. Trailing stop price (specified in ticks). The offset in ticks to determine initial price of the trailing stop order: X ticks lower than 'trail_price' or 'trail_points' to exit long position; X ticks higher than 'trail_price' or 'trail_points' to exit short position. The default value is 'NaN'.
oca_name (string) : (string) An optional parameter. Name of the OCA group (oca_type = strategy.oca.reduce) the profit target, the stop loss / the trailing stop orders belong to. If the name is not specified, it will be generated automatically.
comment (string) : (string) Additional notes on the order. If specified, displays near the order marker on the chart. Optional. The default is na.
comment_profit (string) : (string) Additional notes on the order if the exit was triggered by crossing `profit` or `limit` specifically. If specified, supercedes the `comment` parameter and displays near the order marker on the chart. Optional. The default is na.
comment_loss (string) : (string) Additional notes on the order if the exit was triggered by crossing `stop` or `loss` specifically. If specified, supercedes the `comment` parameter and displays near the order marker on the chart. Optional. The default is na.
comment_trailing (string) : (string) Additional notes on the order if the exit was triggered by crossing `trail_offset` specifically. If specified, supercedes the `comment` parameter and displays near the order marker on the chart. Optional. The default is na.
alert_message (string) : (string) Text that will replace the '{{strategy.order.alert_message}}' placeholder when one is used in the "Message" field of the "Create Alert" dialog. Optional. The default is na.
alert_profit (string) : (string) Text that will replace the '{{strategy.order.alert_message}}' placeholder when one is used in the "Message" field of the "Create Alert" dialog. Only replaces the text if the exit was triggered by crossing `profit` or `limit` specifically. Optional. The default is na.
alert_loss (string) : (string) Text that will replace the '{{strategy.order.alert_message}}' placeholder when one is used in the "Message" field of the "Create Alert" dialog. Only replaces the text if the exit was triggered by crossing `stop` or `loss` specifically. Optional. The default is na.
alert_trailing (string) : (string) Text that will replace the '{{strategy.order.alert_message}}' placeholder when one is used in the "Message" field of the "Create Alert" dialog. Only replaces the text if the exit was triggered by crossing `trail_offset` specifically. Optional. The default is na.
when (bool) : (bool) An optional parmeter. Condition, deprecated.
Returns: (void)
percent_to_ticks(percent, from)
Converts a percentage of the supplied price or the average entry price to ticks.
Parameters:
percent (float) : (float) The percentage of supplied price to convert to ticks. 50 is 50% of the entry price.
from (float) : (float) A price that can be used to calculate from. Optional. The default value is `strategy.position_avg_price`.
Returns: (float) A value in ticks.
percent_to_price(percent, from)
Converts a percentage of the supplied price or the average entry price to a price.
Parameters:
percent (float) : (float) The percentage of the supplied price to convert to price. 50 is 50% of the supplied price.
from (float) : (float) A price that can be used to calculate from. Optional. The default value is `strategy.position_avg_price`.
Returns: (float) A value in the symbol's quote currency (USD for BTCUSD).
bot
Fields:
password (series__string)
start_time (series__integer)
end_time (series__integer)
leverage (series__integer)
initial_capital (series__float)
default_qty_type (series__string)
default_qty_value (series__float)
margin_mode (series__string)
contract_size (series__float)
kis_number (series__integer)
entry_percent (series__float)
close_percent (series__float)
exit_percent (series__float)
log_table (series__table)
fixed_qty (series__float)
fixed_cash (series__float)
real (series__bool)
auto_alert_message (series__bool)
hide_trade_line (series__bool)
ORB Algo | Flux Charts💎 GENERAL OVERVIEW
Introducing our new ORB Algo indicator! ORB stands for "Opening Range Breakout" which is a common trading strategy. The indicator can analyze the market trend in the current session and give "Buy / Sell", "Take Profit" and "Stop Loss" signals. For more information about the analyzing process of the indicator, you can read "How Does It Work ?" section of the description.
Features of the new ORB Algo indicator :
Buy & Sell Signals
Up To 3 Take Profit Signals
Stop-Loss Signals
Alerts for Buy / Sell, Take-Profit and Stop-Loss
Customizable Algoritm
Session Dashboard
Backtesting Dashboard
📌 HOW DOES IT WORK ?
This indicator works best in 1-minute timeframe. The idea is that the trend of the current session can be forecasted by analyzing the market for a while after the session starts. However, each market has it's own dynamics and the algorithm will need fine-tuning to get the best performance possible. So, we've implemented a "Backtesting Dashboard" that shows the past performance of the algorithm in the current ticker with your current settings. Always keep in mind that past performance does not guarantee future results.
Here are the steps of the algorithm explained briefly :
1. The algorithm follows and analyzes the first 30 minutes (can be adjusted) of the session.
2. Then, algorithm checks for breakouts of the opening range's high or low.
3. If a breakout happens in a bullish or a bearish direction, the algorithm will now check for retests of the breakout. Depending on the sensitivity setting, there must be 0 / 1 / 2 / 3 failed retests for the breakout to be considered as reliable.
4. If the breakout is reliable, the algorithm will give an entry signal.
5. After the position entry, algorithm will now wait for Take-Profit or Stop-Loss zones and signal if any of them occur.
If you wonder how does the indicator find Take-Profit & Stop-Loss zones, you can check the "Settings" section of the description.
🚩UNIQUENESS
While there are indicators that show the opening range of the session, they come short with features like indicating breakouts, entries, and Take-Profit & Stop-Loss zones. We are also aware of that different stock markets have different dynamics, and tuning the algorithm for different markets is really important for better results, so we decided to make the algorithm fully customizable. Besides all that, our indicator contains a detailed backtesting dashboard, so you can see past performance of the algorithm in the current ticker. While past performance does not yield any guarantee for future results, we believe that a backtesting dashboard is necessary for tuning the algorithm. Another strength of this indicator is that there are multiple options for detection of Take-Profit and Stop-Loss zones, which the trader can select one of their liking.
⚙️SETTINGS
Keep in mind that best chart timeframe for this indicator to work is the 1-minute timeframe.
TP = Take-Profit
SL = Stop-Loss
EMA = Exponential Moving Average
OR = Opening Range
ATR = Average True Range
1. Algorithm
ORB Timeframe -> This setting determines the timeframe that the algorithm will analyze the market after a new session begins before giving any signals. It's important to experiment with this setting and find the best option that suits the current ticker for the best performance. More volatile stocks will often require this setting to be larger, while more stabilized stocks may have this setting shorter.
Sensitivity -> This setting determines how much failed retests are needed to take a position entry. Higher senstivity means that less retests are needed to consider the breakout as reliable. If you think that the current ticker makes strong movements in a bullish & bearish direction after a breakout, you should set this setting higher. If you think the opposite, meaning that the ticker does not decide the trend right after a breakout, this setting show be lower.
(High = 0 Retests, Medium = 1 Retest, Low = 2 Retests, Lowest = 3 Retests)
Breakout Condition -> The condition for the algorithm to detect breakouts.
Close = Bar needs to close higher than the OR High Line in a bullish breakout, or lower than the OR Low Line in a bearish breakout. EMA = The EMA of the bar must be higher / lower than OR Lines instead of the close price.
TP Method -> The method for the algorithm to use when determining TP zones.
Dynamic = This TP method essentially tries to find the bar that price starts declining the current trend and going to the other direction, and puts a TP zone there. To achieve this, it uses an EMA line, and when the close price of a bar crosses the EMA line, It's a TP spot.
ATR = In this TP method, instead of a dynamic approach the TP zones are pre-determined using the ATR of the entry bar. This option is generally for traders who just want to know their TP spots beforehand while trading. Selecting this option will also show TP zones at the ORB Dashboard.
"Dynamic" option generally performs better, while the "ATR" method is safer to use.
EMA Length -> This setting determines the length of the EMA line used in "Dynamic TP method" and "EMA Breakout Condition". This is completely up to the trader's choice, though the default option should generally perform well. You might want to experiment with this setting and find the optimal length for the current ticker.
Stop-Loss -> Algorithm will place the Stop-Loss zone using setting.
Safer = The SL zone will be placed closer to the OR High for a bullish entry, and closer to the OR Low for a bearish entry.
Balanced = The SL zone will be placed in the center of OR High & OR Low
Risky = The SL zone will be placed closer to the OR Low for a bullish entry, and closer to the OR High for a bearish entry.
Adaptive SL -> This option only takes effect if the first TP zone is hit.
Enabled = After the 1st TP zone is hit, the SL zone will be moved to the entry price, essentially making the position risk-free.
Disabled = The SL zone will never change.
2. ORB Dashboard
ORB Dashboard shows the information about the current session.
3. ORB Backtesting
ORB Backtesting Dashboard allows you to see past performance of the algorithm in the current ticker with current settings.
Total amount of days that can be backtested depends on your TV subscription.
Backtesting Exit Ratios -> You can select how much of percent your entry will be closed at any TP zone while backtesting. For example, %90, %5, %5 means that %90 of the position will be closed at the first TP zone, %5 of it will be closed at the 2nd TP zone, and %5 of it will be closed at the last TP zone.

[imba]lance algo🟩 INTRODUCTION
Hello, everyone!
Please take the time to review this description and source code to utilize this script to its fullest potential.
🟩 CONCEPTS
This is a trend indicator. The trend is the 0.5 fibonacci level for a certain period of time.
A trend change occurs when at least one candle closes above the level of 0.236 (for long) or below 0.786 (for short). Also it has massive amout of settings and features more about this below.
With good settings, the indicator works great on any market and any time frame!
A distinctive feature of this indicator is its backtest panel. With which you can dynamically view the results of setting up a strategy such as profit, what the deposit size is, etc.
Please note that the profit is indicated as a percentage of the initial deposit. It is also worth considering that all profit calculations are based on the risk % setting.
🟩 FEATURES
First, I want to show you what you see on the chart. And I’ll show you everything closer and in more detail.
1. Position
2. Statistic panel
3. Backtest panel
Indicator settings:
Let's go in order:
1. Strategies
This setting is responsible for loading saved strategies. There are only two preset settings, MANUAL and UNIVERSAL. If you choose any strategy other than MANUAL, then changing the settings for take profits, stop loss, sensitivity will not bring any results.
You can also save your customized strategies, this is discussed in a separate paragraph “🟩HOW TO SAVE A STRATEGY”
2. Sensitive
Responsible for the time period in bars to create Fibonacci levels
3. Start calculating date
This is the time to start backtesting strategies
4. Position group
Show checkbox - is responsible for displaying positions
Fill checkbox - is responsible for filling positions with background
Risk % - is responsible for what percentage of the deposit you are willing to lose if there is a stop loss
BE target - here you can choose when you reach which take profit you need to move your stop loss to breakeven
Initial deposit- starting deposit for profit calculation
5. Stoploss group
Fixed stoploss % checkbox - If choosed: stoploss will be calculated manually depending on the setting below( formula: entry_price * (1 - stoploss percent)) If NOT choosed: stoploss will be ( formula: fibonacci level(0.786/0.236) * (1 + stoploss percent))
6. Take profit group
This group of settings is responsible for how far from the entry point take profits will be and what % of the position to fix
7. RSI
Responsible for configuring the built-in RSI. Suitable bars will be highlighted with crosses above or below, depending on overbought/oversold
8. Infopanels group
Here I think everything is clear, you can hide or show information panels
9. Developer mode
If enabled, all events that occur will be shown, for example, reaching a take profit or stop loss with detailed information about the unfixed balance of the position
🟩 HOW TO USE
Very simple. All you need is to wait for the trend to change to long or short, you will immediately see a stop loss and four take profits, and you will also see prices. Like in this picture:
🟩 ALERTS
There are 3 types of alerts:
1. Long signal
2. Short signal
3. Any alert() function call - will be send to you json with these fields
{
"side": "LONG",
"entry": "64.454",
"tp1": "65.099",
"tp2": "65.743",
"tp3": "66.388",
"tp4": "67.032",
"winrate": "35.42%",
"strategy": "MANUAL",
"beTargetTrigger": "1",
"stop": "64.44"
}
🟩 HOW TO SAVE A STRATEGY
First, you need to make sure that the “MANUAL” strategy is selected in the strategy settings.
After this, you can start selecting parameters that will show the largest profit in the statistics panel.
I have highlighted what you need to pay attention to when choosing a strategy
Let's assume you have set up a strategy. The main question is how to preserve it?
Let’s say the strategy turned out with the following parameters:
Next we need to find this section of code:
// STRATS
selector(string strategy_name) =>
strategy_settings = Strategy_settings.new()
switch strategy_name
"MANUAL" =>
strategy_settings.sensitivity := 18
strategy_settings.risk_percent := 1
strategy_settings.break_even_target := "1"
strategy_settings.tp1_percent := 1
strategy_settings.tp1_percent_fix := 40
strategy_settings.tp2_percent := 2
strategy_settings.tp2_percent_fix := 30
strategy_settings.tp3_percent := 3
strategy_settings.tp3_percent_fix := 20
strategy_settings.tp4_percent := 4
strategy_settings.tp4_percent_fix := 10
strategy_settings.fixed_stop := false
strategy_settings.sl_percent := 0.0
"UNIVERSAL" =>
strategy_settings.sensitivity := 20
strategy_settings.risk_percent := 1
strategy_settings.break_even_target := "1"
strategy_settings.tp1_percent := 1
strategy_settings.tp1_percent_fix := 40
strategy_settings.tp2_percent := 2
strategy_settings.tp2_percent_fix := 30
strategy_settings.tp3_percent := 3
strategy_settings.tp3_percent_fix := 20
strategy_settings.tp4_percent := 4
strategy_settings.tp4_percent_fix := 10
strategy_settings.fixed_stop := false
strategy_settings.sl_percent := 0.0
// "NEW STRATEGY" =>
// strategy_settings.sensitivity := 20
// strategy_settings.risk_percent := 1
// strategy_settings.break_even_target := "1"
// strategy_settings.tp1_percent := 1
// strategy_settings.tp1_percent_fix := 40
// strategy_settings.tp2_percent := 2
// strategy_settings.tp2_percent_fix := 30
// strategy_settings.tp3_percent := 3
// strategy_settings.tp3_percent_fix := 20
// strategy_settings.tp4_percent := 4
// strategy_settings.tp4_percent_fix := 10
// strategy_settings.fixed_stop := false
// strategy_settings.sl_percent := 0.0
strategy_settings
// STRATS
Let's uncomment on the latest strategy called "NEW STRATEGY" rename it to "SOL 5m" and change the sensitivity:
// STRATS
selector(string strategy_name) =>
strategy_settings = Strategy_settings.new()
switch strategy_name
"MANUAL" =>
strategy_settings.sensitivity := 18
strategy_settings.risk_percent := 1
strategy_settings.break_even_target := "1"
strategy_settings.tp1_percent := 1
strategy_settings.tp1_percent_fix := 40
strategy_settings.tp2_percent := 2
strategy_settings.tp2_percent_fix := 30
strategy_settings.tp3_percent := 3
strategy_settings.tp3_percent_fix := 20
strategy_settings.tp4_percent := 4
strategy_settings.tp4_percent_fix := 10
strategy_settings.fixed_stop := false
strategy_settings.sl_percent := 0.0
"UNIVERSAL" =>
strategy_settings.sensitivity := 20
strategy_settings.risk_percent := 1
strategy_settings.break_even_target := "1"
strategy_settings.tp1_percent := 1
strategy_settings.tp1_percent_fix := 40
strategy_settings.tp2_percent := 2
strategy_settings.tp2_percent_fix := 30
strategy_settings.tp3_percent := 3
strategy_settings.tp3_percent_fix := 20
strategy_settings.tp4_percent := 4
strategy_settings.tp4_percent_fix := 10
strategy_settings.fixed_stop := false
strategy_settings.sl_percent := 0.0
"SOL 5m" =>
strategy_settings.sensitivity := 15
strategy_settings.risk_percent := 1
strategy_settings.break_even_target := "1"
strategy_settings.tp1_percent := 1
strategy_settings.tp1_percent_fix := 40
strategy_settings.tp2_percent := 2
strategy_settings.tp2_percent_fix := 30
strategy_settings.tp3_percent := 3
strategy_settings.tp3_percent_fix := 20
strategy_settings.tp4_percent := 4
strategy_settings.tp4_percent_fix := 10
strategy_settings.fixed_stop := false
strategy_settings.sl_percent := 0.0
strategy_settings
// STRATS
Now let's find this code:
strategy_input = input.string(title = "STRATEGY", options = , defval = "MANUAL", tooltip = "EN:\nTo manually configure the strategy, select MANUAL otherwise, changing the settings won't have any effect\nRU:\nЧтобы настроить стратегию вручную, выберите MANUAL в противном случае изменение настроек не будет иметь никакого эффекта")
And let's add our new strategy there, it turned out like this:
strategy_input = input.string(title = "STRATEGY", options = , defval = "MANUAL", tooltip = "EN:\nTo manually configure the strategy, select MANUAL otherwise, changing the settings won't have any effect\nRU:\nЧтобы настроить стратегию вручную, выберите MANUAL в противном случае изменение настроек не будет иметь никакого эффекта")
That's all. Our new strategy is now saved! It's simple! Now we can select it in the list of strategies:

PlurexSignalStrategyLibrary "PlurexSignalStrategy"
Provides functions that wrap the built in TradingView strategy functions so you can seemlessly integrate with Plurex Signal automation.
NOTE: Be sure to:
- set your strategy default_qty_value to the default entry percentage of your signal
- set your strategy default_qty_type to strategy.percent_of_equity
- set your strategy pyramiding to some value greater than 1 or something appropriate to your strategy in order to have multiple entries.
long(secret, budgetPercentage, priceLimit, marketOverride)
Open a new long entry. Wraps strategy function and sends plurex message as an alert.
Parameters:
secret : The secret for your Signal on plurex
budgetPercentage : Optional, The percentage of budget to use in the entry.
priceLimit : Optional, The worst price to accept for the entry.
marketOverride : Optional, defaults to the syminfo for the ticker. Use the `plurexMarket` function to build your own.
longAndFixedStopLoss(secret, stop, budgetPercentage, priceLimit, marketOverride)
Open a new long entry. Wraps strategy function and sends plurex message as an alert. Also sets a gobal stop loss for full open position
Parameters:
secret : The secret for your Signal on plurex
stop : The trigger price for the stop loss. See strategy.exit documentation
budgetPercentage : Optional, The percentage of budget to use in the entry.
priceLimit : Optional, The worst price to accept for the entry.
marketOverride : Optional, defaults to the syminfo for the ticker. Use the `plurexMarket` function to build your own.
longAndTrailingStopLoss(secret, trail_offset, trail_price, trail_points, budgetPercentage, priceLimit, marketOverride)
Open a new long entry. Wraps strategy function and sends plurex message as an alert. Also sets a gobal trailing stop loss for full open position. You must set one of trail_price or trail_points.
Parameters:
secret : The secret for your Signal on plurex
trail_offset : See strategy.exit documentation
trail_price : See strategy.exit documentation
trail_points : See strategy.exit documentation
budgetPercentage : Optional, The percentage of budget to use in the entry.
priceLimit : Optional, The worst price to accept for the entry.
marketOverride : Optional, defaults to the syminfo for the ticker. Use the `plurexMarket` function to build your own.
short(secret, budgetPercentage, priceLimit, marketOverride)
Open a new short entry. Wraps strategy function and sends plurex message as an alert.
Parameters:
secret : The secret for your Signal on plurex
budgetPercentage : Optional, The percentage of budget to use in the entry.
priceLimit : Optional, The worst price to accept for the entry.
marketOverride : Optional, defaults to the syminfo for the ticker. Use the `plurexMarket` function to build your own.
shortAndFixedStopLoss(secret, stop, budgetPercentage, priceLimit, marketOverride)
Open a new short entry. Wraps strategy function and sends plurex message as an alert. Also sets a gobal stop loss for full open position
Parameters:
secret : The secret for your Signal on plurex
stop : The trigger price for the stop loss. See strategy.exit documentation
budgetPercentage : Optional, The percentage of budget to use in the entry.
priceLimit : Optional, The worst price to accept for the entry.
marketOverride : Optional, defaults to the syminfo for the ticker. Use the `plurexMarket` function to build your own.
shortAndTrailingStopLoss(secret, trail_offset, trail_price, trail_points, budgetPercentage, priceLimit, marketOverride)
Open a new short entry. Wraps strategy function and sends plurex message as an alert. Also sets a gobal trailing stop loss for full open position. You must set one of trail_price or trail_points.
Parameters:
secret : The secret for your Signal on plurex
trail_offset : See strategy.exit documentation
trail_price : See strategy.exit documentation
trail_points : See strategy.exit documentation
budgetPercentage : Optional, The percentage of budget to use in the entry.
priceLimit : Optional, The worst price to accept for the entry.
marketOverride : Optional, defaults to the syminfo for the ticker. Use the `plurexMarket` function to build your own.
closeAll(secret, marketOverride)
Close all positions. Wraps strategy function and sends plurex message as an alert.
Parameters:
secret : The secret for your Signal on plurex
marketOverride : Optional, defaults to the syminfo for the ticker. Use the `plurexMarket` function to build your own.
closeLongs(secret, marketOverride)
close all longs. Wraps strategy function and sends plurex message as an alert.
Parameters:
secret : The secret for your Signal on plurex
marketOverride : Optional, defaults to the syminfo for the ticker. Use the `plurexMarket` function to build your own.
closeShorts(secret, marketOverride)
close all shorts. Wraps strategy function and sends plurex message as an alert.
Parameters:
secret : The secret for your Signal on plurex
marketOverride : Optional, defaults to the syminfo for the ticker. Use the `plurexMarket` function to build your own.
closeLastLong(secret, marketOverride)
Close last long entry. Wraps strategy function and sends plurex message as an alert.
Parameters:
secret : The secret for your Signal on plurex
marketOverride : Optional, defaults to the syminfo for the ticker. Use the `plurexMarket` function to build your own.
closeLastShort(secret, marketOverride)
Close last short entry. Wraps strategy function and sends plurex message as an alert.
Parameters:
secret : The secret for your Signal on plurex
marketOverride : Optional, defaults to the syminfo for the ticker. Use the `plurexMarket` function to build your own.
closeFirstLong(secret, marketOverride)
Close first long entry. Wraps strategy function and sends plurex message as an alert.
Parameters:
secret : The secret for your Signal on plurex
marketOverride : Optional, defaults to the syminfo for the ticker. Use the `plurexMarket` function to build your own.
closeFirstShort(secret, marketOverride)
Close first short entry. Wraps strategy function and sends plurex message as an alert.
Parameters:
secret : The secret for your Signal on plurex
marketOverride : Optional, defaults to the syminfo for the ticker. Use the `plurexMarket` function to build your own.
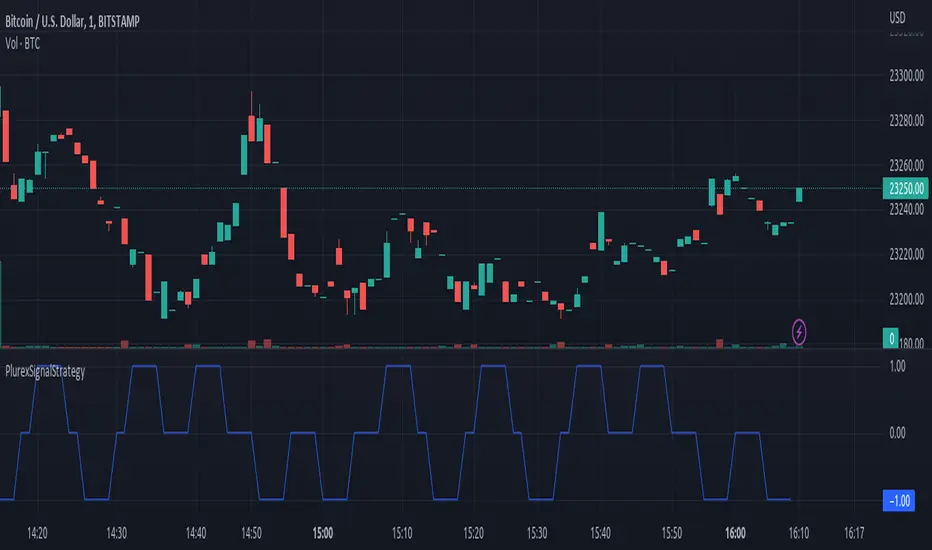
Simple and Profitable Scalping Strategy (ForexSignals TV)Strategy is based on the "SIMPLE and PROFITABLE Forex Scalping Strategy" taken from YouTube channel ForexSignals TV.
See video for a detailed explaination of the whole strategy.
I'm not entirely happy with the performance of this strategy yet however I do believe it has potential as the concept makes a lot of sense.
I'm open to any ideas people have on how it could be improved.
Strategy incorporates the following features:
Risk management:
Configurable X% loss per stop (default to 1%)
Configurable R:R ratio
Trade entry:
Based on stratgey conditions outlined below
Trade exit:
Based on stratgey conditions outlined below
Backtesting:
Configurable backtesting range by date
Trade drawings:
Each entry condition indicator can be turned on and off
TP/SL boxes drawn for all trades. Can be turned on and off
Trade exit information labels. Can be turned on and off
NOTE: Trade drawings will only be applicable when using overlay strategies
Debugging:
Includes section with useful debugging techniques
Strategy conditions
Trade entry:
LONG
C1: On higher timeframe trend EMAs, Fast EMA must be above Slow EMA
C2: On higher timeframe trend EMAs, price must be above Fast EMA
C3: On current timeframe entry EMAs, Fast EMA must be above Medium EMA and Medium EMA must be above Slow EMA
C4: On current timeframe entry EMAs, all 3 EMA lines must have fanned out in upward direction for previous X candles (configurable)
C5: On current timeframe entry EMAs, previous candle must have closed above and not touched any EMA lines
C6: On current timeframe entry EMAs, current candle must have pulled back to touch the EMA line(s)
C7: Price must break through the high of the last X candles (plus price buffer) to trigger entry (stop order entry)
SHORT
C1: On higher timeframe trend EMAs, Fast EMA must be below Slow EMA
C2: On higher timeframe trend EMAs, price must be below Fast EMA
C3: On current timeframe entry EMAs, Fast EMA must be below Medium EMA and Medium EMA must be below Slow EMA
C4: On current timeframe entry EMAs, all 3 EMA lines must have fanned out in downward direction for previous X candles (configurable)
C5: On current timeframe entry EMAs, previous candle must have closed above and not touched any EMA lines
C6: On current timeframe entry EMAs, current candle must have pulled back to touch the EMA line(s)
C7: Price must break through the low of the last X candles (plus price buffer) to trigger entry (stop order entry)
Trade entry:
Calculated position size based on risk tolerance
Entry price is a stop order set just above (buffer configurable) the recent swing high/low (long/short)
Trade exit:
Stop Loss is set just below (buffer configurable) trigger candle's low/high (long/short)
Take Profit calculated from Stop Loss using R:R ratio
Credits
"SIMPLE and PROFITABLE Forex Scalping Strategy" taken from YouTube channel ForexSignals TV

Price Pivots for NASDQ 100 StocksPrice Pivots for NASDQ 100 Stocks
What is this Indicator?
• This indicator calculates the price range a Stock can move in a Day.
Advantages of this Indicator
• This is a Leading indicator, not Dynamic or Repaint.
• Helps to identify the tight range of price movement.
• Can easily identify the Options strike price.
• Develops a discipline in placing Targets.
Disadvantages of this Indicator
• The indicator is specifically made for NASDQ 100 stocks. The levels won't work for other stocks.
• The indicator shows nothing for other indexes and stocks other than above mentioned.
• The data need to be entered manually.
Who to use?
Highly beneficial for Day Traders, it can be used for Swing and Positions as well.
What timeframe to use?
• Any timeframe.
• The highlighted levels in Red and Green will not show correct levels in 1 minute timeframe.
• 5min is recommended for Day Traders.
When to use?
• Wait for proper swing to form.
• Recommended to avoid 1st 1 hour or market open, that is 9.15am to 10.15 or 10.30am.
• Within this time a proper swing will be formed.
What are the Lines?
• The concept is the price will move from one pivot to another.
• Entry and Exit can be these levels as Reversal or Retracement.
Gray Lines:
• Every lines with price labels are the Strike Prices in the Option Chain.
• Price moves from 1 Strike Price level to another.
• The dashed lines are average levels of 2 Strike Prices.
Red & Green Lines:
• The Red and Green Lines will appear only after the first 1 hour.
• The levels are calculated based on the 1st 1 hour.
• Red Lines are important Resistance levels, these are strong Bearish reversal points. It is also a breakout level, this need to be figured out from the past levels, trend, percentage change and consolidation.
• Green Lines are important Support levels, these are strong Bullish reversal points. It is also a breakdown level, this need to be figured out from the past levels, trend, percentage change and consolidation.
What are the Labels?
• First Number: Price of that level.
• Numbers in (): Percentage change and Change of price from LTP (Last Traded Price) to that Level.
How to use?
Entry:
• Enter when price is closer to the Red or Green lines.
• Enter after considering previous Swing and Trend.
• Note the 50% of previous Swing.
• Enter Short when price reverse from each level.
• If 50% of swing and the pivot level is closer it can be a good entry.
Exit:
• Use the logic of Entry, each level can be a target.
• Exit when price is closer to the Red or Green lines.
Indicator Menu
Source
• Custom: Enter the price manually after choosing the Source as Custom to show the Pivots at that price.
• LTP: Pivot is calculated based on Last Traded Price.
• Day Open: Pivot is calculated based on current day opening price.
• PD Close: Pivot is calculated based on previous day closing price.
• PD HL2: Pivot is calculated based on previous day average of High and Low.
• PD HLC3: Pivot is calculated based on previous day average of High, Low and Close.
"Time (Vertical Lines)"
• This is a marker of every 1 hour.
• Usually major price movement happen between previous day last 1 hour to today first 1 hour.
• Two swings can happen between first 2 hour of current day.
• At the end of the day last 1 hour another important movement will happen.
• Usually rest of the time won't show any interesting movement.
To the Users
• Certain symbols may show the levels as a single line. For such symbols choose a different Source or Timeframe from the indicator menu.
• Please inform if any of the Symbol's price levels don't react to the pivots , include the Symbol a well.
• Also inform if you notice any wrong values, errors or abnormal behavior in the indicator.
• Feel free to suggest or adding new features and options.
General Tips
• It is good if Stock trend is same as that of Index trend.
• Lots of indicators creates lots of confusion.
• Keep the chart simple and clean.
• Buy Low and Sell High.
• Master averages or 50%.
• Previous Swing High and Swing Low are crucial.
Important Note
• Currently the levels are in testing stage.
• Eventually the levels of certain symbols will be corrected after each update and test.

Price Pivots for NSE Index & F&O StocksPrice Pivots for NSE Index & F&O Stocks
What is this Indicator?
• This indicator calculates the price range a Stock or Index can move in a Day, Week or Month.
Advantages of this Indicator
• This is a Leading indicator, not Dynamic or Repaint.
• Helps to identify the tight range of price movement.
• Can easily identify the Options strike price.
• The levels are more reliable and authentic than Gann Square of 9 Levels.
• Develops a discipline in placing Targets.
Disadvantages of this Indicator
• The indicator is specifically made for National Stock Exchange of India (NSE) listed index and stocks.
• The indicator is calculated only for index NIFTY, BANKNIFTY, FINNIFTY, MIDCPNIFTY and Stocks listed in Futures and Options.
• The indicator shows nothing for other indexes and stocks other than above mentioned.
• The data need to be entered manually.
• The data need to be updated manually when the F&O listed stocks are updated.
Who to use?
Highly beneficial for Day Traders, it can be used for Swing and Positions as well.
What timeframe to use?
• Any timeframe.
• The highlighted levels in Red and Green will not show correct levels in 1 minute timeframe.
• 5min is recommended for Day Traders.
When to use?
• Wait for proper swing to form.
• Recommended to avoid 1st 1 hour or market open, that is 9.15am to 10.15 or 10.30am.
• Within this time a proper swing will be formed.
How to use?
Entry
• Enter when the Price reach closer to the Blue line.
• Enter Long when the Price takes a pullback or breakout at the Red lines.
Exit
• Exit position when the Price reach closer to the Red lines in Long positions.
What are the Lines?
Gray Lines:
• Every lines with price labels are the Strike Prices in the Option Chain from NSE website.
• Price moves from 1 Strike Price level to another.
• The dashed lines are average levels of 2 Strike Prices.
Red & Green Lines:
• The Red and Green Lines will appear only after the first 1 hour.
• The levels are calculated based on the 1st 1 hour.
• Red Lines are important Resistance levels, these are strong Bearish reversal points. It is also a breakout level, this need to be figured out from the past levels, trend, percentage change and consolidation.
• Green Lines are important Support levels, these are strong Bullish reversal points. It is also a breakdown level, this need to be figured out from the past levels, trend, percentage change and consolidation.
What are the Labels?
• First Number: Price of that level.
• Numbers in (): Percentage change and Change of price from LTP(Last Traded Price) to that Level.
How to use?
Entry:
• Enter when price is closer to the Red or Green lines.
• Enter after considering previous Swing and Trend.
• Note the 50% of previous Swing.
• Enter Short when price reverse from each level.
• If 50% of swing and the pivot level is closer it can be a good entry.
Exit:
• Use the logic of Entry, each level can be a target.
• Exit when price is closer to the Red or Green lines.
Indicator Menu
Source
• Custom: Enter the price manually after choosing the Source as Custom to show the Pivots at that price.
• LTP: Pivot is calculated based on Last Traded Price.
• Day Open: Pivot is calculated based on current day opening price.
• PD Close: Pivot is calculated based on previous day closing price.
• PD HL2: Pivot is calculated based on previous day average of High and Low.
• PD HLC3: Pivot is calculated based on previous day average of High, Low and Close.
"Time (IST) (Vertical)"
• This is a marker of every 1 hour.
• Usually major price movement happen between previous day last 1 hour (2:15 pm) to today first 1 hour (10:15 pm).
• Two swings can happen between first 2 hour of current day.
• At the end of the day last 1 hour from 2.15 pm another important movement will happen.
• Usually rest of the time won't show any interesting movement.
To the Users
• Certain symbols may show the levels as a single line. For such symbols choose a different Source or Timeframe from the indicator menu.
• Please inform if any of the Symbol's price levels don't react to the pivots, include the Symbol a well.
• Also inform if you notice any wrong values, errors or abnormal behavior in the indicator.
• Feel free to suggest or adding new features and options.
General Tips
• It is good if Stock trend is same as that of NIFTY trend.
• Lots of indicators creates lots of confusion.
• Keep the chart simple and clean.
• Buy Low and Sell High.
• Master averages or 50%.
• Previous Swing High and Swing Low are crucial.

taLibrary "ta"
█ OVERVIEW
This library holds technical analysis functions calculating values for which no Pine built-in exists.
Look first. Then leap.
█ FUNCTIONS
cagr(entryTime, entryPrice, exitTime, exitPrice)
It calculates the "Compound Annual Growth Rate" between two points in time. The CAGR is a notional, annualized growth rate that assumes all profits are reinvested. It only takes into account the prices of the two end points — not drawdowns, so it does not calculate risk. It can be used as a yardstick to compare the performance of two instruments. Because it annualizes values, the function requires a minimum of one day between the two end points (annualizing returns over smaller periods of times doesn't produce very meaningful figures).
Parameters:
entryTime : The starting timestamp.
entryPrice : The starting point's price.
exitTime : The ending timestamp.
exitPrice : The ending point's price.
Returns: CAGR in % (50 is 50%). Returns `na` if there is not >=1D between `entryTime` and `exitTime`, or until the two time points have not been reached by the script.
█ v2, Mar. 8, 2022
Added functions `allTimeHigh()` and `allTimeLow()` to find the highest or lowest value of a source from the first historical bar to the current bar. These functions will not look ahead; they will only return new highs/lows on the bar where they occur.
allTimeHigh(src)
Tracks the highest value of `src` from the first historical bar to the current bar.
Parameters:
src : (series int/float) Series to track. Optional. The default is `high`.
Returns: (float) The highest value tracked.
allTimeLow(src)
Tracks the lowest value of `src` from the first historical bar to the current bar.
Parameters:
src : (series int/float) Series to track. Optional. The default is `low`.
Returns: (float) The lowest value tracked.
█ v3, Sept. 27, 2022
This version includes the following new functions:
aroon(length)
Calculates the values of the Aroon indicator.
Parameters:
length (simple int) : (simple int) Number of bars (length).
Returns: ( [float, float ]) A tuple of the Aroon-Up and Aroon-Down values.
coppock(source, longLength, shortLength, smoothLength)
Calculates the value of the Coppock Curve indicator.
Parameters:
source (float) : (series int/float) Series of values to process.
longLength (simple int) : (simple int) Number of bars for the fast ROC value (length).
shortLength (simple int) : (simple int) Number of bars for the slow ROC value (length).
smoothLength (simple int) : (simple int) Number of bars for the weigted moving average value (length).
Returns: (float) The oscillator value.
dema(source, length)
Calculates the value of the Double Exponential Moving Average (DEMA).
Parameters:
source (float) : (series int/float) Series of values to process.
length (simple int) : (simple int) Length for the smoothing parameter calculation.
Returns: (float) The double exponentially weighted moving average of the `source`.
dema2(src, length)
An alternate Double Exponential Moving Average (Dema) function to `dema()`, which allows a "series float" length argument.
Parameters:
src : (series int/float) Series of values to process.
length : (series int/float) Length for the smoothing parameter calculation.
Returns: (float) The double exponentially weighted moving average of the `src`.
dm(length)
Calculates the value of the "Demarker" indicator.
Parameters:
length (simple int) : (simple int) Number of bars (length).
Returns: (float) The oscillator value.
donchian(length)
Calculates the values of a Donchian Channel using `high` and `low` over a given `length`.
Parameters:
length (int) : (series int) Number of bars (length).
Returns: ( [float, float, float ]) A tuple containing the channel high, low, and median, respectively.
ema2(src, length)
An alternate ema function to the `ta.ema()` built-in, which allows a "series float" length argument.
Parameters:
src : (series int/float) Series of values to process.
length : (series int/float) Number of bars (length).
Returns: (float) The exponentially weighted moving average of the `src`.
eom(length, div)
Calculates the value of the Ease of Movement indicator.
Parameters:
length (simple int) : (simple int) Number of bars (length).
div (simple int) : (simple int) Divisor used for normalzing values. Optional. The default is 10000.
Returns: (float) The oscillator value.
frama(source, length)
The Fractal Adaptive Moving Average (FRAMA), developed by John Ehlers, is an adaptive moving average that dynamically adjusts its lookback period based on fractal geometry.
Parameters:
source (float) : (series int/float) Series of values to process.
length (int) : (series int) Number of bars (length).
Returns: (float) The fractal adaptive moving average of the `source`.
ft(source, length)
Calculates the value of the Fisher Transform indicator.
Parameters:
source (float) : (series int/float) Series of values to process.
length (simple int) : (simple int) Number of bars (length).
Returns: (float) The oscillator value.
ht(source)
Calculates the value of the Hilbert Transform indicator.
Parameters:
source (float) : (series int/float) Series of values to process.
Returns: (float) The oscillator value.
ichimoku(conLength, baseLength, senkouLength)
Calculates values of the Ichimoku Cloud indicator, including tenkan, kijun, senkouSpan1, senkouSpan2, and chikou. NOTE: offsets forward or backward can be done using the `offset` argument in `plot()`.
Parameters:
conLength (int) : (series int) Length for the Conversion Line (Tenkan). The default is 9 periods, which returns the mid-point of the 9 period Donchian Channel.
baseLength (int) : (series int) Length for the Base Line (Kijun-sen). The default is 26 periods, which returns the mid-point of the 26 period Donchian Channel.
senkouLength (int) : (series int) Length for the Senkou Span 2 (Leading Span B). The default is 52 periods, which returns the mid-point of the 52 period Donchian Channel.
Returns: ( [float, float, float, float, float ]) A tuple of the Tenkan, Kijun, Senkou Span 1, Senkou Span 2, and Chikou Span values. NOTE: by default, the senkouSpan1 and senkouSpan2 should be plotted 26 periods in the future, and the Chikou Span plotted 26 days in the past.
ift(source)
Calculates the value of the Inverse Fisher Transform indicator.
Parameters:
source (float) : (series int/float) Series of values to process.
Returns: (float) The oscillator value.
kvo(fastLen, slowLen, trigLen)
Calculates the values of the Klinger Volume Oscillator.
Parameters:
fastLen (simple int) : (simple int) Length for the fast moving average smoothing parameter calculation.
slowLen (simple int) : (simple int) Length for the slow moving average smoothing parameter calculation.
trigLen (simple int) : (simple int) Length for the trigger moving average smoothing parameter calculation.
Returns: ( [float, float ]) A tuple of the KVO value, and the trigger value.
pzo(length)
Calculates the value of the Price Zone Oscillator.
Parameters:
length (simple int) : (simple int) Length for the smoothing parameter calculation.
Returns: (float) The oscillator value.
rms(source, length)
Calculates the Root Mean Square of the `source` over the `length`.
Parameters:
source (float) : (series int/float) Series of values to process.
length (int) : (series int) Number of bars (length).
Returns: (float) The RMS value.
rwi(length)
Calculates the values of the Random Walk Index.
Parameters:
length (simple int) : (simple int) Lookback and ATR smoothing parameter length.
Returns: ( [float, float ]) A tuple of the `rwiHigh` and `rwiLow` values.
stc(source, fast, slow, cycle, d1, d2)
Calculates the value of the Schaff Trend Cycle indicator.
Parameters:
source (float) : (series int/float) Series of values to process.
fast (simple int) : (simple int) Length for the MACD fast smoothing parameter calculation.
slow (simple int) : (simple int) Length for the MACD slow smoothing parameter calculation.
cycle (simple int) : (simple int) Number of bars for the Stochastic values (length).
d1 (simple int) : (simple int) Length for the initial %D smoothing parameter calculation.
d2 (simple int) : (simple int) Length for the final %D smoothing parameter calculation.
Returns: (float) The oscillator value.
stochFull(periodK, smoothK, periodD)
Calculates the %K and %D values of the Full Stochastic indicator.
Parameters:
periodK (simple int) : (simple int) Number of bars for Stochastic calculation. (length).
smoothK (simple int) : (simple int) Number of bars for smoothing of the %K value (length).
periodD (simple int) : (simple int) Number of bars for smoothing of the %D value (length).
Returns: ( [float, float ]) A tuple of the slow %K and the %D moving average values.
stochRsi(lengthRsi, periodK, smoothK, periodD, source)
Calculates the %K and %D values of the Stochastic RSI indicator.
Parameters:
lengthRsi (simple int) : (simple int) Length for the RSI smoothing parameter calculation.
periodK (simple int) : (simple int) Number of bars for Stochastic calculation. (length).
smoothK (simple int) : (simple int) Number of bars for smoothing of the %K value (length).
periodD (simple int) : (simple int) Number of bars for smoothing of the %D value (length).
source (float) : (series int/float) Series of values to process. Optional. The default is `close`.
Returns: ( [float, float ]) A tuple of the slow %K and the %D moving average values.
supertrend(factor, atrLength, wicks)
Calculates the values of the SuperTrend indicator with the ability to take candle wicks into account, rather than only the closing price.
Parameters:
factor (float) : (series int/float) Multiplier for the ATR value.
atrLength (simple int) : (simple int) Length for the ATR smoothing parameter calculation.
wicks (simple bool) : (simple bool) Condition to determine whether to take candle wicks into account when reversing trend, or to use the close price. Optional. Default is false.
Returns: ( [float, int ]) A tuple of the superTrend value and trend direction.
szo(source, length)
Calculates the value of the Sentiment Zone Oscillator.
Parameters:
source (float) : (series int/float) Series of values to process.
length (simple int) : (simple int) Length for the smoothing parameter calculation.
Returns: (float) The oscillator value.
t3(source, length, vf)
Calculates the value of the Tilson Moving Average (T3).
Parameters:
source (float) : (series int/float) Series of values to process.
length (simple int) : (simple int) Length for the smoothing parameter calculation.
vf (simple float) : (simple float) Volume factor. Affects the responsiveness.
Returns: (float) The Tilson moving average of the `source`.
t3Alt(source, length, vf)
An alternate Tilson Moving Average (T3) function to `t3()`, which allows a "series float" `length` argument.
Parameters:
source (float) : (series int/float) Series of values to process.
length (float) : (series int/float) Length for the smoothing parameter calculation.
vf (simple float) : (simple float) Volume factor. Affects the responsiveness.
Returns: (float) The Tilson moving average of the `source`.
tema(source, length)
Calculates the value of the Triple Exponential Moving Average (TEMA).
Parameters:
source (float) : (series int/float) Series of values to process.
length (simple int) : (simple int) Length for the smoothing parameter calculation.
Returns: (float) The triple exponentially weighted moving average of the `source`.
tema2(source, length)
An alternate Triple Exponential Moving Average (TEMA) function to `tema()`, which allows a "series float" `length` argument.
Parameters:
source (float) : (series int/float) Series of values to process.
length (float) : (series int/float) Length for the smoothing parameter calculation.
Returns: (float) The triple exponentially weighted moving average of the `source`.
trima(source, length)
Calculates the value of the Triangular Moving Average (TRIMA).
Parameters:
source (float) : (series int/float) Series of values to process.
length (int) : (series int) Number of bars (length).
Returns: (float) The triangular moving average of the `source`.
trima2(src, length)
An alternate Triangular Moving Average (TRIMA) function to `trima()`, which allows a "series int" length argument.
Parameters:
src : (series int/float) Series of values to process.
length : (series int) Number of bars (length).
Returns: (float) The triangular moving average of the `src`.
trix(source, length, signalLength, exponential)
Calculates the values of the TRIX indicator.
Parameters:
source (float) : (series int/float) Series of values to process.
length (simple int) : (simple int) Length for the smoothing parameter calculation.
signalLength (simple int) : (simple int) Length for smoothing the signal line.
exponential (simple bool) : (simple bool) Condition to determine whether exponential or simple smoothing is used. Optional. The default is `true` (exponential smoothing).
Returns: ( [float, float, float ]) A tuple of the TRIX value, the signal value, and the histogram.
uo(fastLen, midLen, slowLen)
Calculates the value of the Ultimate Oscillator.
Parameters:
fastLen (simple int) : (series int) Number of bars for the fast smoothing average (length).
midLen (simple int) : (series int) Number of bars for the middle smoothing average (length).
slowLen (simple int) : (series int) Number of bars for the slow smoothing average (length).
Returns: (float) The oscillator value.
vhf(source, length)
Calculates the value of the Vertical Horizontal Filter.
Parameters:
source (float) : (series int/float) Series of values to process.
length (simple int) : (simple int) Number of bars (length).
Returns: (float) The oscillator value.
vi(length)
Calculates the values of the Vortex Indicator.
Parameters:
length (simple int) : (simple int) Number of bars (length).
Returns: ( [float, float ]) A tuple of the viPlus and viMinus values.
vzo(length)
Calculates the value of the Volume Zone Oscillator.
Parameters:
length (simple int) : (simple int) Length for the smoothing parameter calculation.
Returns: (float) The oscillator value.
williamsFractal(period)
Detects Williams Fractals.
Parameters:
period (int) : (series int) Number of bars (length).
Returns: ( [bool, bool ]) A tuple of an up fractal and down fractal. Variables are true when detected.
wpo(length)
Calculates the value of the Wave Period Oscillator.
Parameters:
length (simple int) : (simple int) Length for the smoothing parameter calculation.
Returns: (float) The oscillator value.
█ v7, Nov. 2, 2023
This version includes the following new and updated functions:
atr2(length)
An alternate ATR function to the `ta.atr()` built-in, which allows a "series float" `length` argument.
Parameters:
length (float) : (series int/float) Length for the smoothing parameter calculation.
Returns: (float) The ATR value.
changePercent(newValue, oldValue)
Calculates the percentage difference between two distinct values.
Parameters:
newValue (float) : (series int/float) The current value.
oldValue (float) : (series int/float) The previous value.
Returns: (float) The percentage change from the `oldValue` to the `newValue`.
donchian(length)
Calculates the values of a Donchian Channel using `high` and `low` over a given `length`.
Parameters:
length (int) : (series int) Number of bars (length).
Returns: ( [float, float, float ]) A tuple containing the channel high, low, and median, respectively.
highestSince(cond, source)
Tracks the highest value of a series since the last occurrence of a condition.
Parameters:
cond (bool) : (series bool) A condition which, when `true`, resets the tracking of the highest `source`.
source (float) : (series int/float) Series of values to process. Optional. The default is `high`.
Returns: (float) The highest `source` value since the last time the `cond` was `true`.
lowestSince(cond, source)
Tracks the lowest value of a series since the last occurrence of a condition.
Parameters:
cond (bool) : (series bool) A condition which, when `true`, resets the tracking of the lowest `source`.
source (float) : (series int/float) Series of values to process. Optional. The default is `low`.
Returns: (float) The lowest `source` value since the last time the `cond` was `true`.
relativeVolume(length, anchorTimeframe, isCumulative, adjustRealtime)
Calculates the volume since the last change in the time value from the `anchorTimeframe`, the historical average volume using bars from past periods that have the same relative time offset as the current bar from the start of its period, and the ratio of these volumes. The volume values are cumulative by default, but can be adjusted to non-accumulated with the `isCumulative` parameter.
Parameters:
length (simple int) : (simple int) The number of periods to use for the historical average calculation.
anchorTimeframe (simple string) : (simple string) The anchor timeframe used in the calculation. Optional. Default is "D".
isCumulative (simple bool) : (simple bool) If `true`, the volume values will be accumulated since the start of the last `anchorTimeframe`. If `false`, values will be used without accumulation. Optional. The default is `true`.
adjustRealtime (simple bool) : (simple bool) If `true`, estimates the cumulative value on unclosed bars based on the data since the last `anchor` condition. Optional. The default is `false`.
Returns: ( [float, float, float ]) A tuple of three float values. The first element is the current volume. The second is the average of volumes at equivalent time offsets from past anchors over the specified number of periods. The third is the ratio of the current volume to the historical average volume.
rma2(source, length)
An alternate RMA function to the `ta.rma()` built-in, which allows a "series float" `length` argument.
Parameters:
source (float) : (series int/float) Series of values to process.
length (float) : (series int/float) Length for the smoothing parameter calculation.
Returns: (float) The rolling moving average of the `source`.
supertrend2(factor, atrLength, wicks)
An alternate SuperTrend function to `supertrend()`, which allows a "series float" `atrLength` argument.
Parameters:
factor (float) : (series int/float) Multiplier for the ATR value.
atrLength (float) : (series int/float) Length for the ATR smoothing parameter calculation.
wicks (simple bool) : (simple bool) Condition to determine whether to take candle wicks into account when reversing trend, or to use the close price. Optional. Default is `false`.
Returns: ( [float, int ]) A tuple of the superTrend value and trend direction.
vStop(source, atrLength, atrFactor)
Calculates an ATR-based stop value that trails behind the `source`. Can serve as a possible stop-loss guide and trend identifier.
Parameters:
source (float) : (series int/float) Series of values that the stop trails behind.
atrLength (simple int) : (simple int) Length for the ATR smoothing parameter calculation.
atrFactor (float) : (series int/float) The multiplier of the ATR value. Affects the maximum distance between the stop and the `source` value. A value of 1 means the maximum distance is 100% of the ATR value. Optional. The default is 1.
Returns: ( [float, bool ]) A tuple of the volatility stop value and the trend direction as a "bool".
vStop2(source, atrLength, atrFactor)
An alternate Volatility Stop function to `vStop()`, which allows a "series float" `atrLength` argument.
Parameters:
source (float) : (series int/float) Series of values that the stop trails behind.
atrLength (float) : (series int/float) Length for the ATR smoothing parameter calculation.
atrFactor (float) : (series int/float) The multiplier of the ATR value. Affects the maximum distance between the stop and the `source` value. A value of 1 means the maximum distance is 100% of the ATR value. Optional. The default is 1.
Returns: ( [float, bool ]) A tuple of the volatility stop value and the trend direction as a "bool".
Removed Functions:
allTimeHigh(src)
Tracks the highest value of `src` from the first historical bar to the current bar.
allTimeLow(src)
Tracks the lowest value of `src` from the first historical bar to the current bar.
trima2(src, length)
An alternate Triangular Moving Average (TRIMA) function to `trima()`, which allows a
"series int" length argument.

ColorSchemeLibrary "ColorScheme"
A color scheme generator.
init() Initiate the array data registry that will hold the color profile. Returns: tuple with 2 arrays (string array, color array)
check_registry_integrity(key_registry, color_registry) Checks the integrity of the registers.
Parameters:
key_registry : string array, key data holder array.
color_registry : color array, color value data holder array.
Returns: void.
add(key_registry, color_registry, key, value) Add new (key, color) entry to the registry.
Parameters:
key_registry : string array, key data holder array.
color_registry : color array, color value data array.
key : string, the unique key to reference the value.
value : color, the color value of the specified key.
Returns: void.
get_color(key_registry, color_registry, key) Get a (key, color) entry from the registry.
Parameters:
key_registry : string array, key data holder array.
color_registry : color array, color value data array.
key : string, the unique key to reference the value.
Returns: void.
edit_key(key_registry, color_registry, key, new_key) Edit a (key, color) entry in the registry.
Parameters:
key_registry : string array, key data holder array.
color_registry : color array, color value data array.
key : string, the unique key to reference the value.
new_key : string, the unique key to reference the value.
Returns: void.
edit_color(key_registry, color_registry, key, new_value) Edit a (key, color) entry in the registry.
Parameters:
key_registry : string array, key data holder array.
color_registry : color array, color value data array.
key : string, the unique key to reference the value.
new_value : color, the color value of the specified key.
Returns: void.
delete(key_registry, color_registry, key) Delete a (key, color) entry from the registry.
Parameters:
key_registry : string array, key data holder array.
color_registry : color array, color value data array.
key : string, the unique key to reference the value.
Returns: void.
delete_all(key_registry, color_registry) Delete all (key, color) entrys from the registry.
Parameters:
key_registry : string array, key data holder array.
color_registry : color array, color value data array.
Returns: void.
model(index) Enumerate models available to profile colors.
Parameters:
index : int, index of model. (1:'monochromatic', 2:'analog', 3:'triadic', 4:'tetradic', 5:'square', anything else:'monochromatic')
Returns: string.
generate_scheme(key_registry, color_registry, primary, model) Generate a multi color scheme.
Parameters:
key_registry : string array, key data holder array.
color_registry : color array, color value data array.
primary : color, the origin color to base the profile.
model : string, default='monochromatic', options=('monochromatic', 'triadic near', 'triadic far', 'tetradic')
Returns: void.

Bullish Divergent Bar DCA Strategy [Skyrexio]Overview
Bullish Divergent Bar DCA Strategy is a long-only, multi-layer Dollar-Cost Averaging (DCA) strategy that builds positions around bullish divergent bars formed below the Williams Alligator. It detects potential local bottoms and then scales into the move using up to four pyramiding entries, each with its own size and price threshold. The strategy optionally incorporates Market Facilitation Index (MFI) and Awesome Oscillator (AO) momentum to strengthen reversal confirmation and uses ATR-based take profit on the averaged entry price.
Unique Features
Layered DCA entries with equity-based sizing . It supports up to four DCA layers, where each additional layer is opened only after a configurable percentage drawdown from the first entry and position size is computed as a fraction of current equity via a geometric weighting scheme.
Optional AO and MFI confirmation . Users can require Awesome Oscillator momentum divergence, MFI/volume “squat” bars, or both to confirm that the reversal bar is accompanied by capitulation and weakening downside momentum.
ATR-based dynamic take profit . Take profit is defined as a multiple of ATR added to the current average entry price, automatically adjusting exits to prevailing volatility.
Built-in DCA visualization . The script can plot the initial entry level and all DCA thresholds to make the averaging structure and risk visually transparent on the chart.
Methodology
The core entry logic starts from a bullish divergent bar definition: the bar must close above its midpoint (close > hl2) and be the lowest low within the user-defined lookback window, flagging a local swing low. On top of this, the bar must form entirely below all three Alligator lines, ensuring that the pattern appears after a sustained downside move rather than inside noise.
If enabled, AO adds a momentum filter by requiring the Awesome Oscillator difference to be negative (descending bar on AO histogram), signaling fading downside momentum at the potential bottom. If the MFI filter is enabled, the bar (or one of the last two bars) must be a “squat” bar where spread narrows while volume increases, approximating effort vs. result exhaustion.
Once a valid bullish reversal bar is detected and the time is within the configured trading window, the strategy opens the first DCA layer using a stop entry at the bar’s high (confirmation level), only entering if price actually breaks the bar high. Additional layers (second, third, and fourth entries) are only allowed if price trades below percentage thresholds from the first entry price and a new valid bullish reversal bar forms, thereby averaging down into deep pullbacks while still requiring fresh reversal evidence.
While any DCA position is open, the strategy continuously recalculates the take profit as the current volume-weighted average entry price plus ATR multiplied by a user-defined factor. All individual entries share the same take profit level through separate strategy exit calls, so the entire stacked position exits together once price has moved sufficiently above the averaged entry.
Strategy settings
In the inputs window, users can configure the following strategy settings:
sourceUuid / secretToken: Identifiers used to format JSON alerts for automated execution through webhooks.
Trade Start Date/Time: Beginning of the backtest/live-trading window.
Trade Stop Date/Time: End of the backtest/live-trading window.
Show DCA Levels (default = false): Toggles plotting of the initial entry level and all three DCA thresholds on the chart.
Enable MFI (default = false): Enables the MFI-style volume/spread filter.
Enable AO (default = false): Enables Awesome Oscillator confirmation.
Number Of Bar For Lowest Bar (default = 7): Lookback window used to identify the lowest low bar for the bullish reversal bar condition.
Layer 2 Threshold Percent (default = 4.0): Percentage drop from the first layer price that must be reached to allow the second DCA entry.
Layer 3 Threshold Percent (default = 10.0): Percentage drop from the first layer price required to unlock the third DCA layer.
Layer 4 Threshold Percent (default = 22.0): Percentage drop from the first layer price required to unlock the fourth DCA layer.
Position Size Multiplier (default = 2.0): Multiplier used in the geometric weighting scheme to determine how much equity is allocated to each additional DCA layer.
Number Of ATR For Take Profit (default = 2.0): ATR multiple added to the current average entry price to calculate the shared take profit for all open layers.
Users can refine these parameters during backtesting to fit the volatility profile and structure of the specific asset and timeframe.
Justification of Methodology
Before understanding why this particular combination of indicator has been chosen let's briefly explain what is Williams Alligator, MFI and AO.
let’s start with the Williams Alligator. Developed by Bill Williams, the Alligator is a technical indicator that identifies trends and potential market reversals. It consists of three smoothed moving averages:
Jaw (Blue Line): The slowest of the three, based on a 13-period smoothed moving average shifted 8 bars ahead.
Teeth (Red Line): The medium-speed line, derived from an 8-period smoothed moving average shifted 5 bars forward.
Lips (Green Line): The fastest line, calculated using a 5-period smoothed moving average shifted 3 bars forward.
When the lines diverge and align in order, the "Alligator" is "awake," signaling a strong trend. When the lines overlap or intertwine, the "Alligator" is "asleep," indicating a range-bound or sideways market. This indicator helps traders determine when to enter or avoid trades.
The Awesome Oscillator (AO), developed by Bill Williams, is a momentum indicator designed to measure market momentum by contrasting recent price movements with a longer-term historical perspective. It helps traders detect potential trend reversals and assess the strength of ongoing trends.
The formula for AO is as follows:
AO = SMA5(Median Price) − SMA34(Median Price)
where:
Median Price = (High + Low) / 2
SMA5 = 5-period Simple Moving Average of the Median Price
SMA 34 = 34-period Simple Moving Average of the Median Price
The Market Facilitation Index (MFI) is a technical indicator that measures the price movement per unit of volume, helping traders gauge the efficiency of price movement in relation to trading volume. Here's how you can calculate it:
MFI = (High−Low)/Volume
MFI can be used in combination with volume, so we can divide 4 states. Bill Williams introduced these to help traders interpret the interaction between volume and price movement. Here’s a quick summary:
Green Window (Increased MFI & Increased Volume): Indicates strong momentum with both price and volume increasing. Often a sign of trend continuation, as both buying and selling interest are rising.
Fake Window (Increased MFI & Decreased Volume): Shows that price is moving but with lower volume, suggesting weak support for the trend. This can signal a potential end of the current trend.
Squat Window (Decreased MFI & Increased Volume): Shows high volume but little price movement, indicating a tug-of-war between buyers and sellers. This often precedes a breakout as the pressure builds.
Fade Window (Decreased MFI & Decreased Volume): Indicates a lack of interest from both buyers and sellers, leading to lower momentum. This typically happens in range-bound markets and may signal consolidation before a new move.
For our purposes we are interested in squat bars. This is the sign that volume cannot move the price easily. This type of bar increases the probability of trend reversal. In this indicator we added to enable the MFI filter of reversal bars. If potential divergent bar or two preceding bars have squat state this bar can be interpret as a reversal one.
The strategy intentionally focuses on bullish divergent bars forming at local lows and below the Alligator to catch potential exhaustion points in downtrends where risk/reward becomes asymmetric. The Alligator (Jaw, Teeth, Lips) acts as a dynamic structure filter: requiring price to be below all three lines before reversal helps avoid chasing minor pullbacks inside an ongoing uptrend and instead concentrates entries on deeper corrections where mean reversion potential is higher.
The custom bullish divergent bar rule (close above midpoint and being the lowest low over N bars) approximates a local capitulation candle, which often precedes short squeezes or at least strong reactions. By combining this with AO and MFI-style filters, the strategy further increases the likelihood that the pattern coincides with downside momentum(as a confirmation that current trend is downward, AO difference < 0) and effort vs. result anomalies (squat bars), which is common signatures of trend exhaustion.
The DCA structure is designed to deploy capital progressively rather than all at once: the first entry is triggered only if price confirms the reversal by breaking above the bar’s high, while subsequent layers require both a deeper discount relative to the initial entry and a new bullish reversal signal. Percentage thresholds from the first entry ensure that each additional allocation is made at meaningfully better prices, improving the blended entry level and reducing the break-even distance.
Finally, using ATR as the basis for take profit aligns exits with current volatility. A fixed-percentage target can be too tight in volatile regimes or too loose in quiet markets, whereas ATR-based targets scale with average bar range. Applying ATR to the evolving average entry price of all open layers keeps the risk/reward framework consistent across different volatility regimes and DCA configurations.
Backtest Results
Operating window: Date range of backtests is 2025.01.01 - 2026.01.01. It is chosen to let the strategy to close all opened positions.
Commission and Slippage: Includes a standard Binance commission of 0.1% and accounts for possible slippage over 5 ticks.
Initial capital: 10000 USDT
Maximum Single Position Loss: -6.56%
Maximum Single Profit: +4.92%
Net Profit: +934.08 USDT (+9.34%)
Total Trades: 121 (82.64% win rate)
Profit Factor: 2.948
Maximum Accumulated Loss: 624.72 USDT (-6.15%)
Average Profit per Trade: 7.72 USDT (+0.37%)
Average Trade Duration: 60 hours
These results are obtained with realistic parameters representing trading conditions observed at major exchanges such as Binance and with realistic trading portfolio usage parameters.
You should run your own backtests on the target asset and timeframe (for example, BTC/USDT on intraday charts) and adjust threshold percentages, layer sizing, and ATR take profit factor to match your risk tolerance and market conditions.
How to Use
Add the script to favorites for easy access.
Apply to the desired timeframe and chart.
Configure settings using the dropdown choice list in the built-in menu.
Set up alerts to automate strategy positions through web hook with the text: {{strategy.order.alert_message}}
Disclaimer:
Educational and informational tool reflecting Skyrex commitment to informed trading. Past performance does not guarantee future results. Test strategies in a simulated environment before live implementation

Neeson Vegas ChannelVegas Channel Indicator: A Comprehensive Multi-Timeframe Trend-Following System
Originality and Conceptual Foundation
This script implements an enhanced version of the classic "Vegas Tunnel" or "Vegas Channel" methodology, popularized by traders who follow the work associated with the "Vegas" technique. Its primary original contribution lies in its specific, rule-based multi-layered trend identification and visualization system. While the core uses well-known Exponential Moving Averages (EMAs), the originality is in the precise combination of periods and the strict, hierarchical logic for defining trend states and generating signals.
Unlike simpler moving average crossovers or single-tunnel systems, this script employs three distinct EMA pairs, each serving a unique purpose within the trend hierarchy:
Short-Term Momentum Pair (EMA 12 & 24): Acts as the primary signal trigger and momentum gauge.
Core Trend Tunnel (EMA 144 & 169): Serves as the central "channel" or "tunnel." A key visual and logical component is the shading between these two lines, which thickens and changes color with the trend, creating a dynamic channel.
Long-Term Foundation Pair (EMA 580 & 670): Represents the underlying, slower-moving trend foundation, providing context for the higher-timeframe bias.
The system's true innovation is its binary and exclusive trend definition logic. It does not rely on a single crossover. Instead, it defines a confirmed Uptrend only when both the short-term EMAs (12 and 24) are established above both lines of the core tunnel (144 and 169). Conversely, a Downtrend is confirmed only when both short-term EMAs are established below both core tunnel lines. This creates a high-confidence filter, reducing whipsaw signals that can occur when price oscillates around a single moving average.
Functionality, Implementation, and Usage
What It Does:
This indicator is a multi-timeframe trend identification and signal-generation tool. It visually condenses trend information from short, medium, and long-term perspectives onto a single chart. Its primary functions are:
Trend State Classification: It dynamically classifies the market into one of three states: Bull Trend (Blue), Bear Trend (Orange), or Sideways/Congestion (Gray). This is reflected in the chart's background color, the color of all EMA lines, and the fill of the central 144/169 channel.
Signal Generation: It plots discrete buy and sell arrows. A Buy Signal (blue upward triangle) appears the first bar the market transitions into the defined "Uptrend" state from a non-uptrend state. A Sell Signal (orange downward triangle) appears the first bar the market transitions into the defined "Downtrend" state.
Visual Structuring: It plots all six EMAs and prominently highlights the interaction zone between the 144 and 169 EMAs with a colored fill, making the "tunnel" a focal point for support/resistance and trend quality assessment.
How It's Implemented:
The logic is implemented through a clear sequence of conditional checks:
Calculation: All six EMAs are calculated based on user-definable periods (defaults as listed).
Trend Logic: The script continuously evaluates the position of EMA12 and EMA24 relative to EMA144 and EMA169 using strict AND conditions to define the uptrend and downtrend Boolean variables.
Signal Logic: A signal (buy or sell) is generated only on the change of the trend state. It uses a check of the form current_trend_state AND (NOT previous_bar_trend_state) to pinpoint the exact bar of transition.
Visual Feedback: All plot colors, the channel fill color, and the background color are unified and determined by the current trend state variable. Labels for the trend and each EMA line are drawn on the last bar for clarity.
How to Use It:
Traders employ this indicator primarily for trend-following and breakout confirmation. It is suited for swing trading or higher-timeframe positional trades rather than scalping, due to the lag inherent in its longer EMAs and its focus on confirmed states.
Trend Bias: The overall color scheme (blue/orange/gray background) provides an immediate, at-a-glance assessment of the dominant trend force. Trading in the direction of the colored background is considered aligned with the system's trend.
Signal Entry: The arrow signals are not meant for blind entry. They mark the point of a confirmed trend state transition.
A Buy Signal suggests the short-term momentum (12,24) has decisively broken above and established itself over the medium-term trend framework (144,169). This could be used as a trigger for long entries, preferably with the long-term EMAs (580,670) sloping upwards or flat, adding confluence.
A Sell Signal suggests the opposite breakdown.
Channel as Dynamic S/R: The filled area between EMA144 and EMA169 acts as a dynamic support zone in an uptrend and a resistance zone in a downtrend. Pullbacks into this "tunnel" that hold without triggering a sell signal (i.e., without both EMA12 & 24 closing back below both tunnel lines) can be viewed as potential continuation opportunities.
Filter for Other Systems: The clear trend state (uptrend/downtrend) can be exported or used as a filter for other trading systems or discretionary decisions, ensuring actions are only taken in the direction of the script's defined trend.
Core Computational Philosophy and Strategic Rationale
The script's logic is rooted in the philosophy of trend hierarchy and confirmation. It belongs to the category of Multi-Moving Average Convergence/Divergence Systems with State-Based Rules.
The 144/169 Tunnel: These numbers are derived from Fibonacci sequences (144, 169 is 12^2 and 13^2). They are believed by proponents to represent a natural rhythm or "heartbeat" of the market, defining a robust intermediate-term trend framework.
The 12/24 Pair: A standard fast-moving average pair commonly used to gauge short-term momentum and trigger entries.
The Strategic Innovation (Dual-Condition Crossover): The core idea is that a crossover of a single fast MA above a single slow MA can be false and noisy. By requiring both members of a fast pair to establish position relative to both members of a slower "tunnel" pair, the system demands a broader, more concerted move. This seeks to filter out weak, unsustainable breaks and only capture shifts in momentum strong enough to flip the entire short-term structure's position relative to the medium-term structure.
The 580/670 Pair: These very slow EMAs represent the "secular" trend. While not part of the direct signal logic, they provide critical context. A buy signal that occurs while price is above the 580/670 pair (which would be sloping up in a healthy bull market) carries more weight than one that occurs while price is below this long-term foundation, which might indicate a counter-trend rally.
In essence, this script is more than just moving averages on a chart. It is a systematic, rule-based framework for identifying when the market's short-term energy (12,24) has converged sufficiently to overcome and reposition itself against its medium-term equilibrium (144/169 tunnel), thereby signaling a high-probability phase change in trend, all while considering the backdrop of a long-term trend (580/670).

able bigtrades dom + liquidity sweep This Pine Script is a sophisticated **Order Flow and Liquidity analysis tool** designed for TradingView. It combines volume analysis, multi-exchange data, and price action to identify where institutional "whales" are entering the market.
Below is a detailed guide on how to interpret and use the **BigTrades DOM** indicator.
---
## 1. Core Concept: Big Trades Detection
Instead of looking at raw volume, this indicator uses **Z-Scores** (Standard Deviations). It compares current volume to the average of the last 30 bars (customizable).
* **Tier 1 (Small Circles):** Significant volume, slightly above average.
* **Tier 2 (Medium Circles):** High volume ( by default). These often act as local support/resistance.
* **Tier 3 (Large Circles):** Extreme volume. These represent institutional "Big Trades" that usually lead to trend reversals or major continuations.
---
## 2. Initiative (INIT) vs. Absorbed (ABS)
This is a powerful feature located in the **Confirmation** settings. It looks at what happens *after* a Tier 3 big trade occurs:
* **Initiative (Purple Circle `●`):** High volume occurs, and price **moves strongly** in that direction within bars. This confirms aggressive "Initiative" buying or selling.
* **Absorbed (Yellow Cross `✕`):** High volume occurs, but price **fails to move**. This indicates "Absorption"—where a large limit order (passive seller) is soaking up all the aggressive market buys, often leading to a reversal.
---
## 3. Liquidity Sweep Detection
The script tracks "Pivots" (old highs and lows) and watches for **Stop Runs**.
* **Bullish Sweep (LTL-SWEEP):** Price dips below a previous Low (Liquidity) but immediately closes back above it, usually accompanied by a Big Trade. This is a classic "Stop Hunt" before a move up.
* **Bearish Sweep (LTH-SWEEP):** Price spikes above a previous High but closes below it. This indicates "trapped longs" and potential downside.
* **Visuals:** The script draws a **Dotted Box** and a **Horizontal Line** to mark the swept liquidity zone.
---
## 4. The Mini DOM & Volume Profile
On the right side of your chart, you will see a real-time table:
* **Profile:** A visual histogram of volume distributed at specific price levels.
* **Bid/Ask:** Shows the estimated volume of sellers (Bid) and buyers (Ask) at those specific levels.
* **Delta (Δ):** The net difference. Green means more aggressive buyers; Red means more aggressive sellers.
* **Current Price:** Highlighted in Green to help you see where the "Value" is currently sitting.
---
## 5. Multi-Exchange Aggregation (Crypto Only)
If you are trading a crypto pair (e.g., BTCUSD), the script can fetch volume data from **Binance, Bybit, OKX, Coinbase, and Kraken** simultaneously.
> **Why it matters:** It gives you a "Global" view of volume. If you see a Big Trade on your chart, but the Multi-Exchange data shows high volume across all 5 exchanges, the signal is much more reliable.
---
## 6. How to Trade with this Indicator
### **Strategy A: The Liquidity Reversal**
1. Look for a **Liquidity Sweep** (LTL-SWEEP).
2. Wait for a **Big Trade (Tier 2 or 3)** to appear at the bottom of the sweep.
3. **Entry:** Long when the bar closes back above the sweep level.
4. **Target:** The opposite Liquidity High.
### **Strategy B: Following Initiative**
1. Wait for an **INIT (Purple Circle)** signal.
2. This confirms that the "Big Trade" has successfully pushed the market.
3. **Entry:** Enter in the direction of the INIT signal on the next pullback.
### **Strategy C: Fading Absorption**
1. Price reaches a resistance level.
2. An **ABS (Yellow Cross)** appears.
3. This means buyers are exhausted and being "absorbed" by a large seller.
4. **Entry:** Short on the break of the Absorption candle's low.
---
## 7. Recommended Settings
* **Sensitivity (Sigma):** Set to `2.5` for volatile markets (Crypto) or `2.0` for slower markets (Forex/Stocks).
* **Normalize by ATR:** Keep this **ON**. it ensures that "Big Trades" are calculated relative to current market volatility.
* **Require Big Trade (Sweep):** Keep this **ON** to filter out "fake" sweeps that don't have institutional backing.

Wave Dynamics - Neural Adaptive Engine🌊 WAVE DYNAMICS - NEURAL ADAPTIVE ENGINE
The Official Reference Manual & Trading Protocol
═════════════════════════════════════════════════════════════
📖 PREFACE: THE END OF STATIC ANALYSIS
The financial markets are not linear; they are fractal. They do not move in straight lines; they breathe. They expand in trending volatility and contract in chopping noise.
The fundamental failure of traditional technical analysis is Static Sensitivity .
• A 14-period RSI works beautifully in a range but fails in a trend.
• A 12,26 MACD captures trends but destroys capital in chop.
Wave Dynamics solves this by treating the market as a living organism. At its core is a Neural Adaptive Engine that calculates the Hurst Exponent (Fractal Dimension) in real-time. It measures the "roughness" of price action and automatically adjusts the lookback periods of every subsystem—Waves, Ribbons, and Oscillators—to match the current market regime.
This manual is your guide to navigating this adaptive framework.
PART 1: THEOLOGY & MARKET PHYSICS
To use this tool, you must understand the three pillars of its logic:
1. The Hurst Exponent (Chaos Theory)
The engine continuously calculates H (Hurst) on a rolling window.
• Persistent Regime (H > 0.5): "What is happening now is likely to continue." The market is trending. The Engine Tightens sensitivity to catch fast pullbacks.
• Anti-Persistent Regime (H < 0.5): "What is happening now is likely to reverse." The market is chopping/ranging. The Engine Widens sensitivity to filter out noise and stop runs.
2. The Elliott Wave Cycle (Crowd Psychology)
Price moves in 5-wave motive sequences followed by corrections.
• Waves 1 & 3: Institutional Accumulation/Mark-up.
• Waves 2 & 4: Profit Taking (The Pullback). These are the only safe entry points.
• Wave 5: Retail FOMO (The Trap). Identified by Momentum Divergence .
3. Smart Money Concepts (Liquidity)
Price moves from liquidity to liquidity.
• Order Blocks: Where institutions initiated the move.
• Breakers: Where institutions trapped traders (Support flips to Resistance).
• Fair Value Gaps: Where price moved too fast, leaving inefficiency.
PART 2: VISUAL INTELLIGENCE (COLOR THEORY)
The chart communicates instantly through a strict color-coded language.
🎨 THE RIBBON (Adaptive Equilibrium)
The background "Cloud" is an Adaptive EMA ribbon.
• Neon Green (#00FF88): Bullish Trend. Only look for Longs. Price is above the equilibrium mean.
• Neon Red (#FF3366): Bearish Trend. Only look for Shorts. Price is below the equilibrium mean.
• Grey/Narrow: Compression. The market is deciding. Do not trade inside a grey ribbon.
🎨 INSTITUTIONAL ZONES
• Green/Red Boxes (Order Blocks): Standard Support/Resistance. Valid entry zones, but lower probability.
• Vivid Purple Boxes (#9C27B0) - THE BREAKER: CRITICAL. This appears when a Green Order Block is smashed through by price. It turns Purple to signify it has flipped from Support to Resistance (or vice versa). A retest of a Purple Zone is the highest probability setup in the system.
• Dotted Outlines (FVG): Magnets. Do not place stops inside these; price will likely travel through them.
🎨 WAVE ANATOMY
• Cyan Lines: Valid Impulse Waves (1, 3, 5).
• Orange Lines/Dots: EXHAUSTION. If a wave line turns Orange, Angular Momentum is decaying. The trend is dying.
• Diamonds (◆): DIVERGENCE. Price made a Higher High, but the internal oscillator (MPI) made a Lower Low. Immediate reversal warning.
🎨 SIGNALS
• Triangles: Confirmed Entries. (Green = Long, Red = Short).
• Labels (e.g., A+): The Grade of the trade based on Confluence.
• A+: Perfect Confluence (Trend + Structure + Zone + Momentum).
• C: Counter-trend or Weak.
PART 3: THE DASHBOARD ECOSYSTEM
Three panels provide Total Situational Awareness. You must read them in order: Top Right → Bottom Left → Bottom Right.
1. MISSION CONTROL (Top Right)
This panel tells you the "Weather Report."
• Neural Status:
• 🧠 TREND: Safe to trade breakout and trend-following strategies.
• 🧠 CHOP: Danger. Use mean-reversion or stay out.
• 🧠 RND (Random): No clear edge.
• Phase: Displays the Bias (Bull/Bear) and Strength. "WEAK BEARISH" usually signals a bottom is forming.
• Score Bar: A live visual meter of the Confluence Score (0-100%).
2. THE ASSISTANT (Bottom Left)
This panel acts as your co-pilot, translating data into English.
• Situation:
• "💎 BULL GEM": You are in a range, at the bottom, showing exhaustion. Buy immediately.
• "🔥 COMPRESSION": Volatility squeeze. A violent move is imminent.
• Action: Tells you exactly what to do (e.g., "Wait for confluence," "Trail Stop," "Let it develop").
• Pro Metrics (Simulated):
• Win Rate: The percentage of signals on the current visible chart that hit Target 1.
• Profit Factor: Gross Win / Gross Loss. If this is < 1.0, stop trading this asset immediately.
• Buckets: Shows the win rate of A-Grade signals vs. C-Grade signals.
3. WAVE INTELLIGENCE (Bottom Right)
This panel provides structural context.
• Channel Gauge (0-100%):
• 0-20%: Oversold / Channel Bottom.
• 80-100%: Overbought / Channel Top.
• 50%: Equilibrium.
• W3/W1 Ratio: The "Health Check" of the trend.
• < 1.0: Weak. Wave 3 is shorter than Wave 1. The trend is struggling.
• > 1.618: Extended. The move is parabolic. Expect a snap-back.
• Trend Health (0-100): Composite score of sub-wave physics. If Health < 30, the trend is effectively dead.
PART 4: PARAMETER OPTIMIZATION (THE INPUTS)
Every input allows you to tune the engine. Here is the deep dive:
🧠 NEURAL ADAPTIVE ENGINE
• Enable Neural Adaptive Engine: Master switch for the Hurst calculation.
• Hurst Period (100):
• Adjustment: Increase to 200 for Crypto/Alts (too much noise). Decrease to 50 for
Forex/Indices (need speed).
• How to tell: If the dashboard says "TREND" but the chart is sideways, INCREASE this value.
• Min/Max Lookback: Defines the constraints. Only adjust if you are an advanced user creating a custom scalping setup (e.g., Min 3 / Max 10).
🌊 WAVE & STRUCTURE
• Base Swing Detection (8): The "Anchor."
• Scalpers (1m-5m): Set to 5-8.
• Swing Traders (1H-4H): Set to 15-20.
• Min Wave Size (ATR): Prevents the script from labeling tiny wicks as waves. Increase this during high-volatility news events.
🔗 MTF STRUCTURE MAPPING
• Require Macro Align: Strict Mode. If enabled, the script checks the Higher Timeframe (e.g., 4H). If 4H is Bearish, it BLOCKS all Long signals on the 5m chart. Use this to prevent counter-trend losses.
🏦 SMART MONEY CONCEPTS
• Enable Breakers: ALWAYS ON. This turns failed Order Blocks into Breaker Zones (Purple).
• Institutional Mode: ULTRA STRICT. If enabled, signals will ONLY fire if price is physically touching an Order Block, FVG, or Breaker. This creates very few, very high-quality signals.
🎯 SIGNAL ENGINE
• Signal Mode:
• Strict: Grades A+ and A only.
• Balanced: Grades B and above.
• Aggressive: Includes counter-trend scalps (Grade C).
• Min Confluence Score (5-35): The raw points needed to trigger. 5 is standard. 10 is conservative.
PART 5: TRADE EXECUTION PLAYBOOKS
PLAYBOOK A: THE "BREAKER RETEST" (Highest Probability)
1. Context: Ribbon is Green.
2. Event: Price creates a Red Order Block, then smashes upward through it.
3. Change: The Red Block turns Purple (Bullish Breaker).
4. Trigger: Price pulls back down to touch the top of the Purple Box.
5. Signal: Green Triangle appears.
6. Action: Max Size Entry. Stop Loss below the Purple Box. Target Wave 3 Projection.
PLAYBOOK B: THE "WAVE 4 DIP" (Trend Following)
1. Context: Wave count shows "3". Ribbon is Green.
2. Event: Price pulls back towards the Ribbon.
3. Wave Panel: Wave count flips to "4".
4. Trigger: Price touches Ribbon, prints Green Triangle.
5. Action: Standard Size Entry. Stop Loss at Swing Low. Target New High (Wave 5).
PLAYBOOK C: THE "HIDDEN GEM" (Range Reversal)
1. Context: Ribbon is Grey (Consolidation). Neural Status is CHOP.
2. Wave Panel: Channel Gauge is < 10% (Extreme Bottom).
3. Visuals: Orange Exhaustion Dot + Divergence Diamond (◆).
4. Assistant: Reads "💎 BULL GEM".
5. Action: Half Size Entry. This is a counter-trend trade. Target the middle of the range (50% Channel).
PLAYBOOK D: THE "BULL TRAP" (When to Fold)
1. Context: Wave Count is "5".
2. Wave Panel: Trend Health < 30. W3/W1 Ratio > 1.618 (Extended).
3. Visuals: Orange Line appears on price high.
4. Signal: Green Triangle appears (Grade C).
5. Action: NO TRADE. The system is warning you that even though a signal fired, the structural physics indicate exhaustion.
PART 6: GRADING & SCORING MATRIX
Every signal is graded on a 35-point scale. Know what you are buying.
• Trend Alignment (5 pts): Ribbon & HTF agreement.
• Structure (5 pts): BOS (Break of Structure) & Higher Highs.
• Physics (5 pts): MPI (Volume Flow) & Angular Velocity.
• Institutional Location (10 pts):
• Inside Order Block: +3 pts
• Inside Breaker: +4 pts
• Wave 2/4 Pullback: +3 pts
• Penalty: Wave 5 Extension (-3 pts).
Grade Scale:
• A+ (Score ≥ 70%): "All In" Setup.
• A (Score 55-69%): Strong Setup.
• B (Score 40-54%): Standard Setup.
• C (Score < 40%): Dangerous.
PART 7: RISK DISCLOSURE & LIMITATIONS
1. The Reality of Adaptation (Redrawing):
The Neural Engine is dynamic. As new data arrives, the calculation of "Chaos" changes. This means historical channel lines or wave labels may shift to fit the matured trend. HOWEVER: Entry Signals (Triangles) NEVER repaint once the bar is closed.
2. Simulation vs. Reality:
The Dashboard metrics (Win Rate, Profit Factor) are Simulations run on the historical data visible on your chart. They do not account for spread, slippage, or liquidity. They are a tool to gauge the current market personality, not a promise of future returns.
3. No Financial Advice:
Wave Dynamics is a tool for structural analysis. It helps you see the market, but it cannot trade for you. You are responsible for your own risk management.
CLOSING THOUGHTS
Wave Dynamics is not just an indicator; it is a lens. It allows you to see the market not as a random walk of candles, but as a structured, breathing entity.
Trust the Neural Status. Respect the Breakers. Fear the Exhaustion.
Taking you to school. — Dskyz, Trade with insight. Trade with anticipation.
