ค้นหาในสคริปต์สำหรับ "ema"

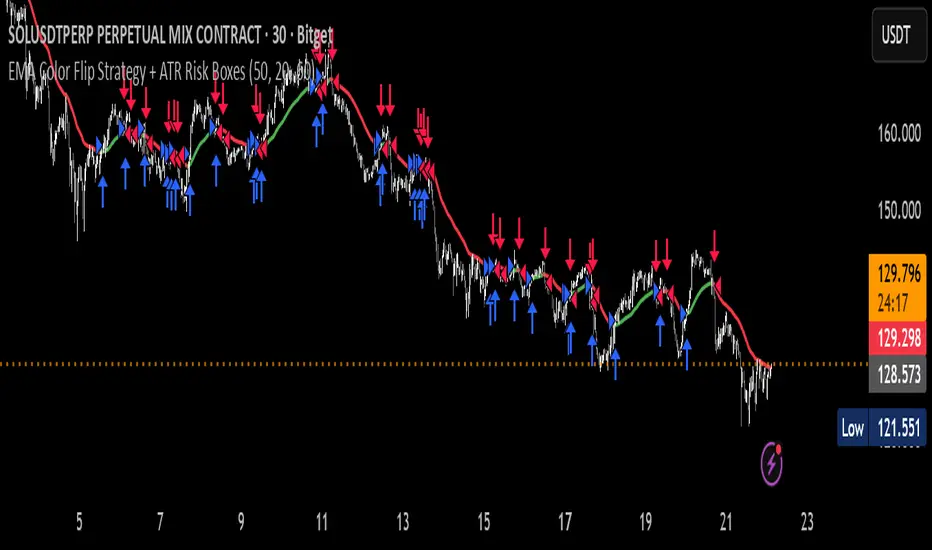
EMA Color Flip Strategy Experimenting on SOL 30 min chart, it seems good!
Let me know what you think!
EMA 9/50 News Confirmation Strategy v3 (Trend Aligned 3 bMin) “EMA 9/50 crossover strategy with trend filter and ATR-based targets”)

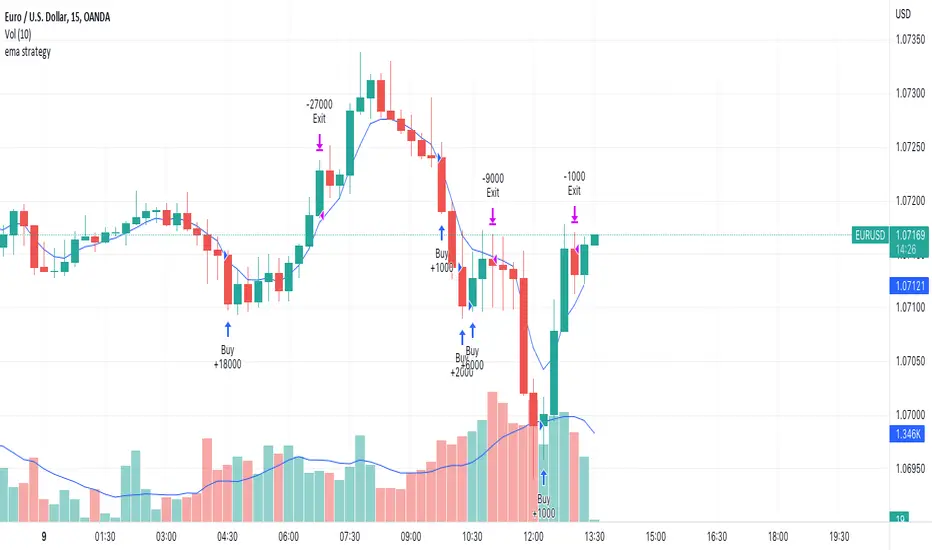
ema strategyEMA STRATEGY Scalping with staggered buy and profit Booking
try and like if you get profitable
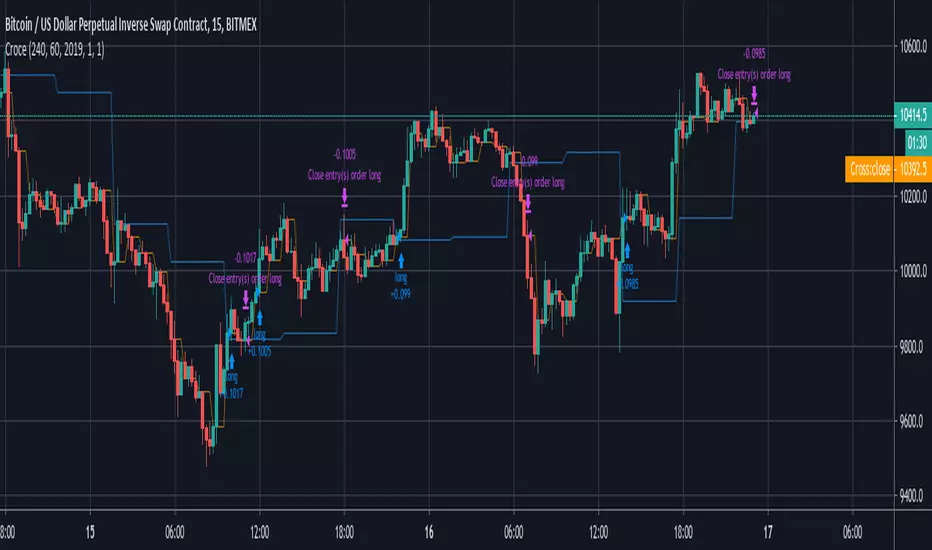

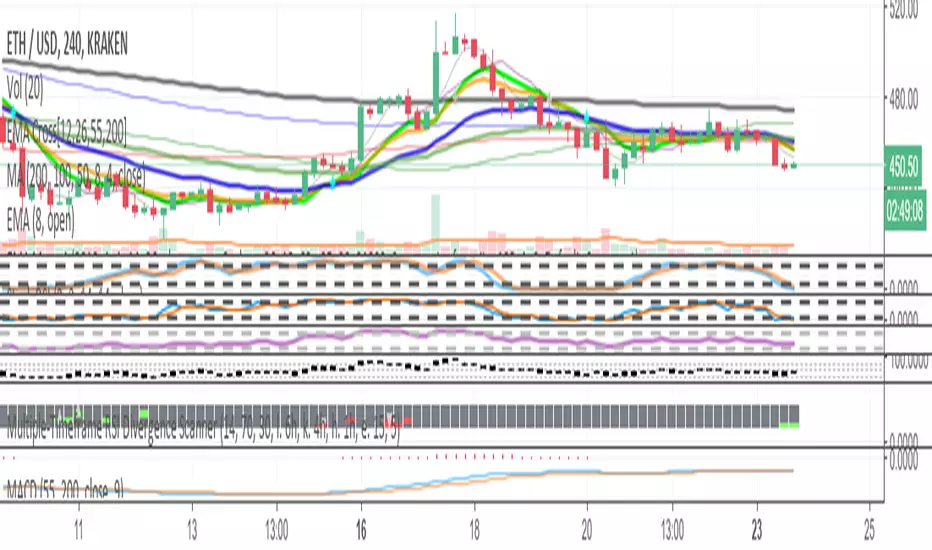
EMA Mega Cross Strategy v2vastly improved and tuned. Million+% return from 2016. 2000+% return from 2018.


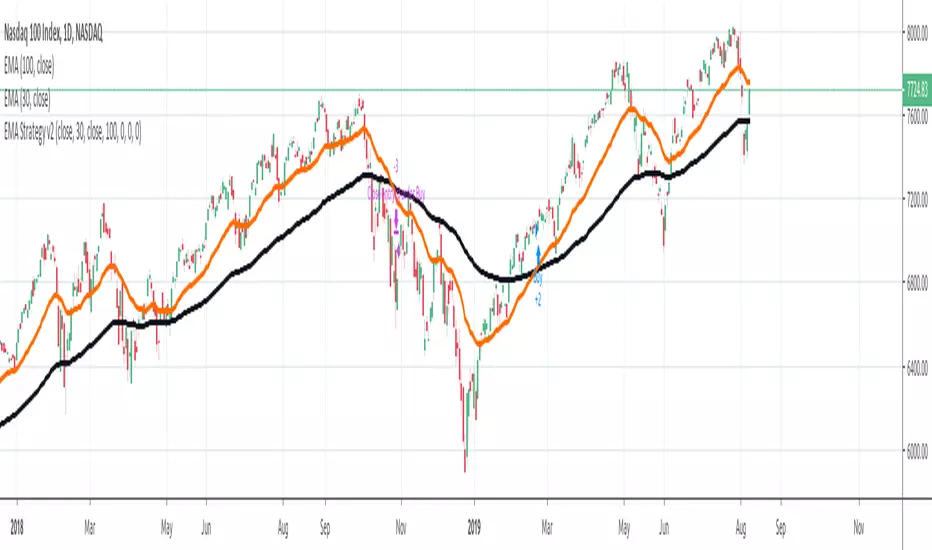
AMRS_LongOnly_PartTimerThis Script is created to back-test the data starting 01/01/2000 based on AMRS strategy.
AMRS is long only strategy. It is based on unique calculation around moving averages and 2 year high price.
There are few strategies for moving average crossovers but AMRS strategy is unique compared to other moving averages strategies as it has very specific below mentioned calculations evolving around moving average and stock price.
AMRS strategy is unique one to generate buying signals when stock price creates new 2 year high and retraces back to 13 day EMA value.
AMRS strategy is unique one having specific calculation for entry signal and exit signal as mentioned below. This strategy gives back testing results to help build conviction on entry/exits if trades were taken in past as per the AMRS rules.
As per AMRS strategy this script generates green arrow on each time when new 2 year high is made and also generates long signal indicated by white arrow when stock price retraces back to 13 day EMA value and price is within 10% range from 2 year high.
This strategy will generate white arrow on the chart for each buy signal when stock price reaches 13 day EMA after first Long signal is generated. These subsequent buy signals can be used for pyramiding.
Entry Signal Logic : 1. Stock should be trading near 2 year high.
2. Stock price should be within 10% range from 2 year high
3. Stock price should be less than or equal to 13 day EMA and grater than equal to 21 day EMA
This AMRS strategy also generates exit signal for already generated buy signal (open position).
Exit signal generated when stock price closes 5% below 21 day EMA or when stock price closes below 20% from most recent 2 year high price.
Exit Signal Logic : 1. Stock price closes 5% below 21 day EMA or stock price closes below 20% from most recent 2 year high price.
2. Since exit logic is based on closing price it is plotted on the chart next day.
3. So when exit signal is plotted on the chart, previous days stock price is either closed below 5% of 21 day EMA or corrected 20% from recent 2 year high.
Note : To Calculate last entry positions % return, by default all positions are getting closed on mentioned end date.
Script parameters :
start date as 01/01/2000 - Constructed from Start Year - 2000, Start Month - 1 Start Date - 1
End date (mostly current date) Constructed from Values in End Year, End Month, End Date.
Initial Capital - Defaulted to 100000
Order Size - 5% of Equity
Pyramiding - 3 orders
Commission - 0.2%
Slippage - 1 tick (Since this strategy exit is on close basis mostly there wont be any slippages)

[Shoshi] Better Than UCTS StrategyThe Strategy is a versatile trading strategy designed to work across various timeframes and assets, with customizable presets tailored for different market conditions. This strategy leverages a combination of Exponential Moving Averages (EMAs) to identify trend directions and entry points. It includes the following key features:
**EMA Crossovers:**
Utilizes short-term and long-term EMAs to generate buy and sell signals when a crossover occurs.
**Customizable Take Profits (TP1, TP2):**
Define up to two take-profit levels to lock in gains. These can be activated or deactivated as needed.
**Stop Loss and Break-Even:**
Implements a dynamic stop loss that can adjust to break-even after hitting the first take-profit level, providing additional risk management.
**Time and Volume Filters:**
Optional filters to avoid signals in low-volume or unfavorable time periods, enhancing the reliability of the signals.
**Risk Management Tools:**
Includes maximum drawdown, losing streak, and intraday loss limits to safeguard your capital.
This strategy is fully configurable, allowing traders to adjust settings to suit their specific needs and market conditions, making it a powerful tool for both beginner and experienced traders.
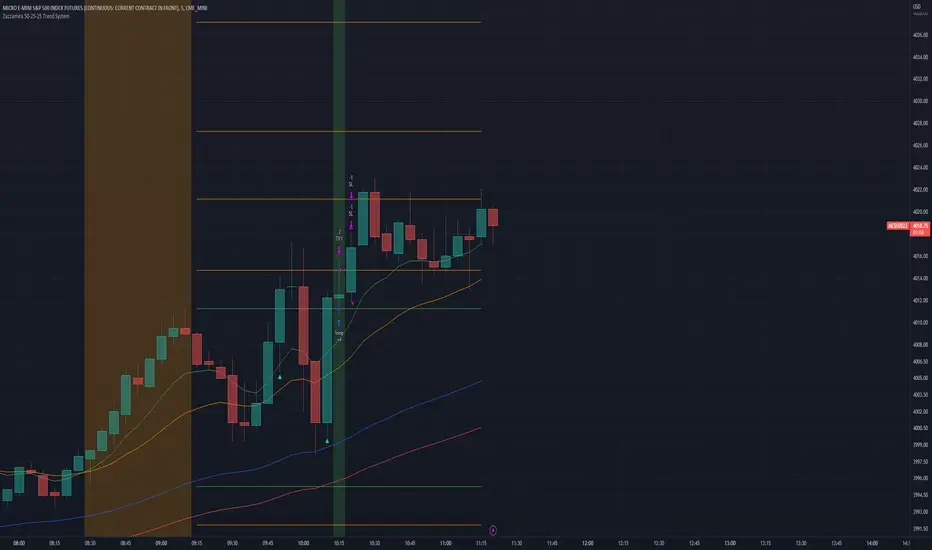
Zazzamira 50-25-25 Trend SystemPublishing my trading system script. It consist of several conditions to happen in order to open a trade. Work best on ES/MES 5 minute timeframe.
I like to use it with this settings:
- UTC -6 (don't tick Exchange Timezone)
and rest as default
To enter a trade, the following conditions must be met: Entry 1: the opening range (8:30AM - 9:15AM UTC-6) must be defined and the price must close above or below the opening range on the 5-minute timeframe. This entry condition defines the trade direction (above = long / below = short). Once the opening range is defined, the Trend-Based Fib Extension is applied from the range high to the range low (and vice versa). Fib levels are required for Exit conditions. Entry 2: the 8 - 27 - 67 - 97 EMAs must be defined. If the EMAs value order is 8 > 27 > 67 > 97, long-only trades are allowed. If the EMAs value order is 8 < 27 < 67 < 97, short-only trades are allowed. This entry condition filters fake breakouts of Entry 1. Entry 3: no trades are allowed after 12:59 UTC-6 (2PM EST). Entry 4: if Entry 1, Entry 2, and Entry 3 conditions are valid and the price hasn't reached the 23.6% Fib line, an entry order can be set at the range high/long with 4 contracts. To exit a trade, the following conditions must be met: Exit 1 (Stop loss): set a trailing stop based on 2.1x ATR (14) from entry. Exit 2: take 50% profits at the 23.6% Fib and leave trailing stop untouched. Exit 3: if Exit 2 triggers, take 50% (25% of total entry) off at 61.8% Fib, leaving Exit 2 trailing stop values valid. Exit 4: exit the full position at the FIB 100% value. Exit 5: all trades must be closed at 3pm UTC-6 (4PM EST). So basically Take Profit are 50%-25%-25% of position.
Code has been written by © Hiubris_Indicators who has been an amazing coder and gave me the possibility to make this script public so a really big shoutout to him.
sachin5986using EMA 3 and 21 moving average and showing buy and sell signal to on chart with selected time frame

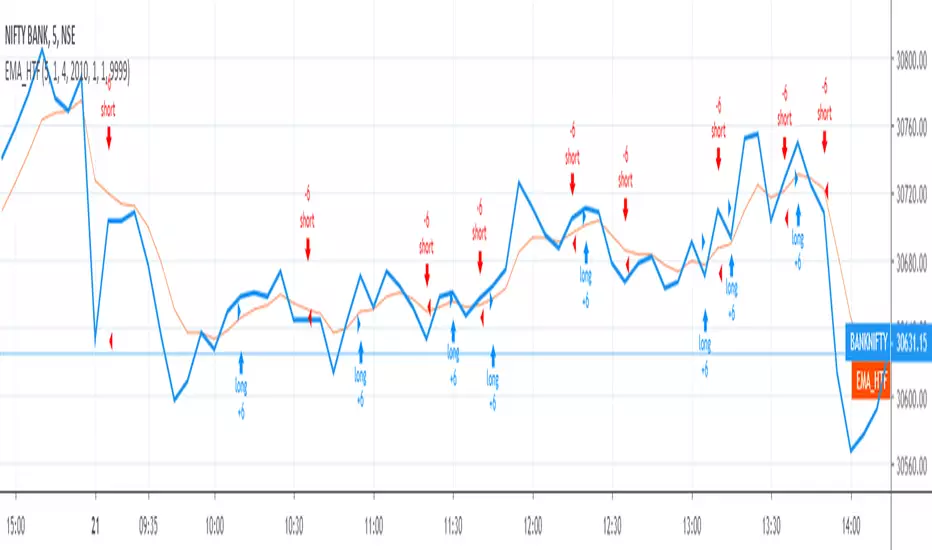
TradersVenue_EMA_StrategyHere long and shorts calls are triggered basis 9/21 EMA crossover. You can keep the nearest swing point high as stoploss for short trades and nearest swing point low for long trades.


EMA 1 & SALMA Intersection StrategyTrading Strategy: EMA 1 & SALMA Crossover System
This strategy is a Trend-Following system that focuses on the direct interaction between the price (represented by EMA 1) and a smoothed trendline (SALMA). Instead of relying on the color changes of the indicator, it uses mechanical crossover signals to enter and exit trades.
1. Indicators Used
EMA 1 (Exponential Moving Average): Since the period is 1, it effectively represents the Current Price. It reacts instantly to every market move.
SALMA v3.0 (Smoothed Adaptive Lattice Moving Average): A double-smoothed moving average that acts as the "Base Line" or "Trend Support/Resistance."
RSI (Relative Strength Index): Used as a Momentum Filter to ensure we don't trade against the market's strength.
2. Buy (Long) Entry Rules
You enter a Long position when the following conditions are met:
The Crossover: The EMA 1 (Price) crosses ABOVE the SALMA line. This indicates that the short-term momentum is shifting higher than the average trend.
The Filter (RSI): The RSI must be above 50. This confirms that the buyers are in control and the upward move has enough strength.
3. Sell (Short) Entry Rules
You enter a Short position when the following conditions are met:
The Crossunder: The EMA 1 (Price) crosses BELOW the SALMA line. This indicates a breakdown in price action.
The Filter (RSI): The RSI must be below 50. This confirms that the sellers are dominating and the downward momentum is real.
4. Key Advantages of This System
Objectivity: You don't guess based on the color of the line; you wait for a clear physical break (cross) of the line.
Precision: By using EMA 1, you get the earliest possible entry signal compared to slower moving averages.
False Signal Protection: The RSI 50 filter prevents you from entering "weak" trades where the price crosses the line but lacks the volume or momentum to continue.
