Double BB & Double EMA by IKINThis is the combination of code to detect the cross over between EMA 7 & EMA 21.
By using the double Bollinger Bands will help traders to make the decision by exit the counter just incase buy at the highest price.
Create for FREE TRADING VIEW USER
ค้นหาในสคริปต์สำหรับ "ema"

Bollinger Band+ Multi EMA, SMAHello Everyone.
I make Bollinger band , 3 ema and 3 sma combined.
I think this indicator can use all timeframe.
--------------------------------------------------------------
Indicator will show you
1. Trend follow
2. Pullback catch
2. Market bounce.
1. Trend Follow
- Trend Follow for I used 3 terms. They are short, Mid and Long Trend.
2. Pullback Catch
- EMA for Save, take care, alert Zones.
- Mid Term Trend can be catch also.
3. Market Bounce
- Bollinger Band will show you market re-bounce point.
Final Notes
Indicator will show Trend, Pullback, Market bounce and some support and resistant level.

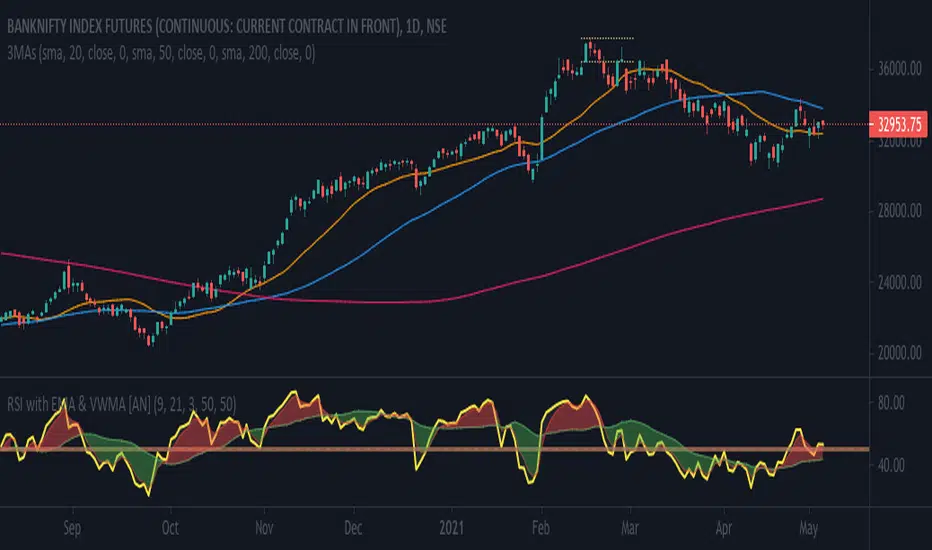
RSI with WMA & EMA [AN]Key Factors traced
- Price: EMA (Exponential Moving Average)
- Volume: WMA (Weighted Moving Avg.)
- Strength (Momentum): RSI (Relative Strength Indicator)
Default parameters
1. RSI at 9. Over brought & Under sold to 50 to be used as a median. This can be altered to the traditional 70:30 or 60:40
2. WMA at 21
3. EMA at 3, Exponential for Intraday trades
SMA 9/50/180 | EMA 20 | BUY/SELLAllows for 3 SMAs and One EMA, Combined with Buy/Sell Indicator
Defaults to following settings:
9 SMA - Red
50 SMA - Blue
180 SMA - White
20 EMA - Yellow
Input Values and Colors can be modified
Recommend changes to the Style default
-uncheck SMA2
-uncheck Buy/Sell Chart Line

All EMA & MA in onDas Script zeigt EMA sowie MA 21, 50 ,100, 200
Es sind alle Farben einstellbar sowie die bereiche zwischen EMA und MA als Zone einfärbbar.
TESLA: EMAS and Bollinger BandsThis script is supposed to be used as part of the "TESLA" strategy in which the default values for the EMAs will serve as a trend indicator and dynamic support and resistance. Moreover, the bollinger bands will signal an overbought or oversold condition stating statistically the price will go up or down. This script features are:
- 3 EMAs which will response quicker than SMA to the new prices and will serve as dynamic support and resistance as well as trend indicators.
- 1 Bollinger band which will signal overbought and oversold conditions.

Fibonacci EMA TrendlinesSimple EMAs based on the Fibs plus the 200 EMA - Default inputs are 8,13, 21, 55, 200. Inspired by Philakones EMAs.

ck - EMA Cross with AlertsDisplays 5 popular EMAs (you can hide any you don’t want to see from the “Styles” screen when editing the config).
Set the values for your EMAs by clicking the cog after adding this indicator to your chart.
A Long or Short signal is fired when EMA1 crosses EMA2 - a cross up is a Long signal, a cross down is a Short signal.
Connect to your Bots (3commas / 3C.exchange recommended) to automate buys and sells!


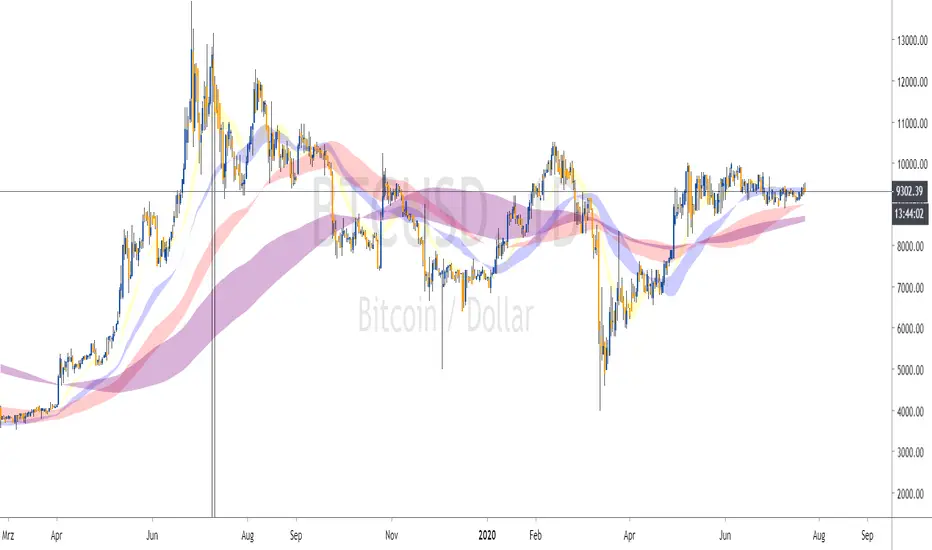
Bollinger Channels / EMA and SMAThis is written as a system to replace the BB strategy.
I think it will work well.
It looks pretty stylish.
Description / Usage:
Adjust the length and multiplier based on your location with Bollinger Bands.
The multiplier of 1 provides you with a basic channel with high and low-source EMA (or SMA).
And with the 8-day exponential moving average, you can observe short entries and exits.
I wish good luck to the friends who will use it.
You can support and track new indicators.
Bu, BB stratejisinin yerini alacak bir sistem olarak yazılmıştır.
Oldukça şık görünüyor.
Kullanım
Bollinger Bantları ile bulunduğunuz yere göre uzunluk ve çarpanı ayarlayın.
1 çarpanı size yüksek ve düşük kaynaklı EMA (veya SMA) içeren temel bir kanal sağlar.
Ve 8 günlük üstel hareketli ortalama ile kısa giriş ve çıkışları gözlemleyebilirsiniz.
Kullanacak arkadaşlara bol kazançlar diliyorum.
Yeni indikatör için destek olabilir ve takip edebilirsiniz.

Triple SMA/EMAThis indicator displays the 50, 100 and 200 period SMA and EMA and shades the area between the corresponding SMAs and EMAs

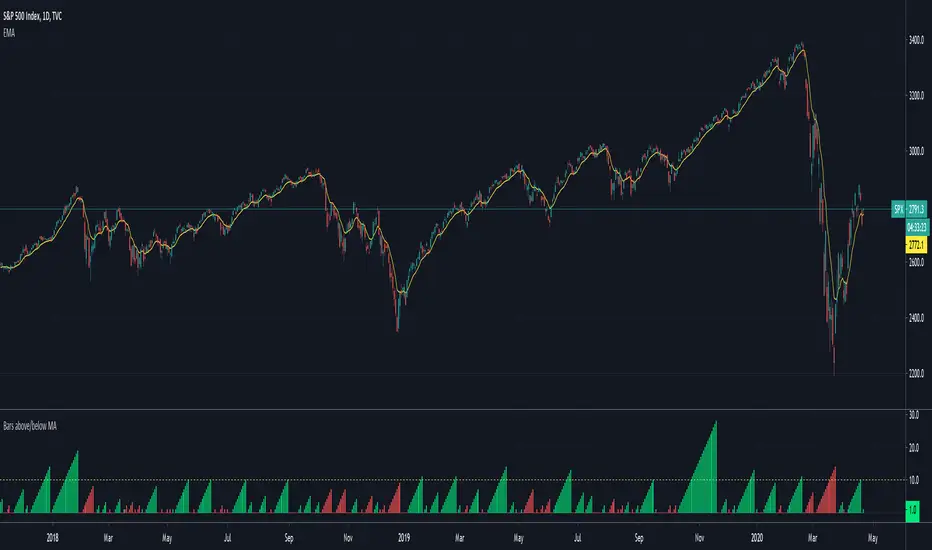
Bars above/below EMACount of previous bars above or below a chosen Exponential Moving Average. Typically price reconnects with well defined EMAs regularly. If the price has been above/below an EMA for too long, you can expect a reconnect in a short order and bet on mean reversion strategies.
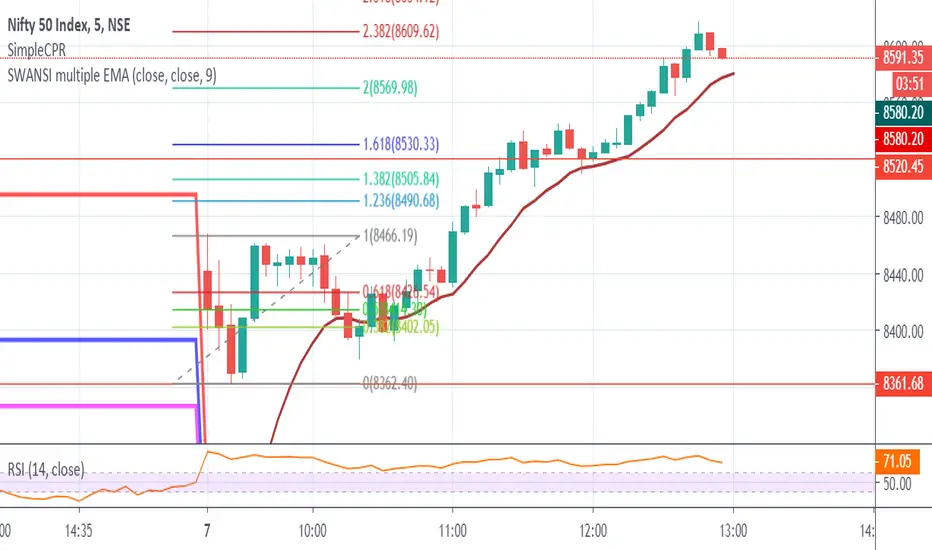
SWANSI multiple EMAI always wondered there should be an EMA (Exponential Moving Average) indicator for multiple periods.
Hence i have created an EMA channel default value of 48 period for High and low
Request you to all the trader and analysis to try it out! and give a feedback
Also more indicators coming in future from my end hence pls follow to get the updates
Thank you
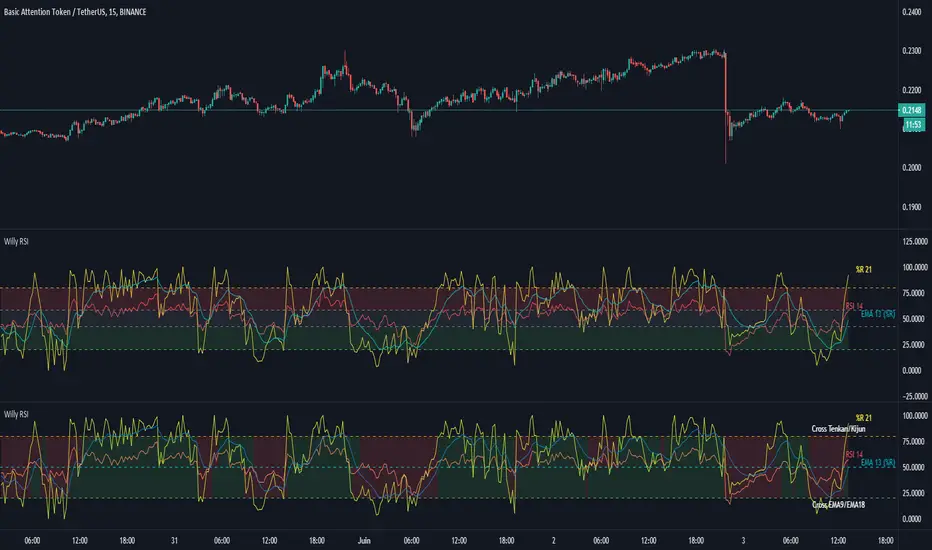
Williams %R + RSI + EMA - [Silver-Wong]
Williams %R + EMA + RSI
Un seul indicateur avec :
- William %R
- RSI
- EMA
- Une ligne médiane
- Les étiquettes des indicateurs
Hashem OBV+EMA/MAThe On Balance Volume indicator (OBV) is used to measure buying and selling pressure.
It is a cumulative indicator meaning that on days where price went up, that day's volume is added to the cumulative OBV total. If price went down, then that day's volume is subtracted from the OBV total.
The OBV value is then plotted as a line for easy interpretation. OBV is primarily used to confirm or identify overall price Trends or to anticipate price movements after Divergences .
In addition to OBV, EMA and SMA are included. the EMA is used for Support and Resistances for the OBV. and the SMA is used by its Slope (can be S/R as well).

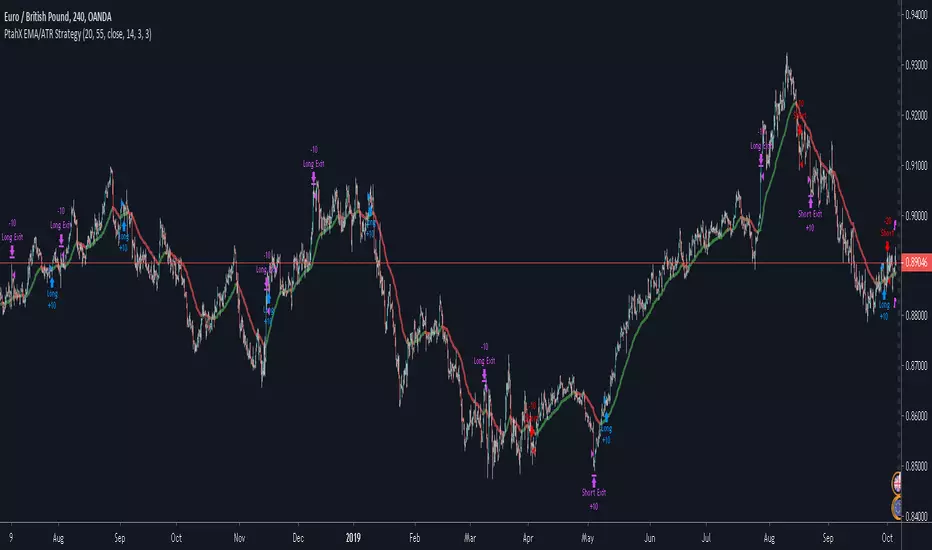
PtahX EMA/ATR StrategyPtahX EMA/ATR Strategy Public Release
written October 2019
EMA Strategy with ATR & "Fear Factor" built in
* modifications welcome
* please let me know if you improve it so I can continue to learn :)
* use at your own risk - I'm a new programmer and still learning
* Best of luck on your trades!!
// Take Profit (TP) option based on ATR or MA Crossover
Triple eMA cross trackerTracks 3 emas, colorizing background:
Green - 1 on top of 2 on top of 3;
Blue - 1 on top of 3, but 2 below 3;
Red - 1 below 2 below 3;
Orange - 1 below 3, 2 above 3.
Nutshell: allows a quick and always apparent check for strategies like the old 8e, 13e, 21e strategy you see online, customizeable by any emas of your choosing.
Double EMA + ATR Trend FollowerThis indicator consists of a fast and slow EMA (default lengths are 50 and 9 periods) and an upper and lower ATR band. When combined, this combination gives traders an accurate picture of both trend strength and direction.
Users can modify the lengths of the fast and slow EMA , as well as the multipliers and length for the upper and lower ATR bands.

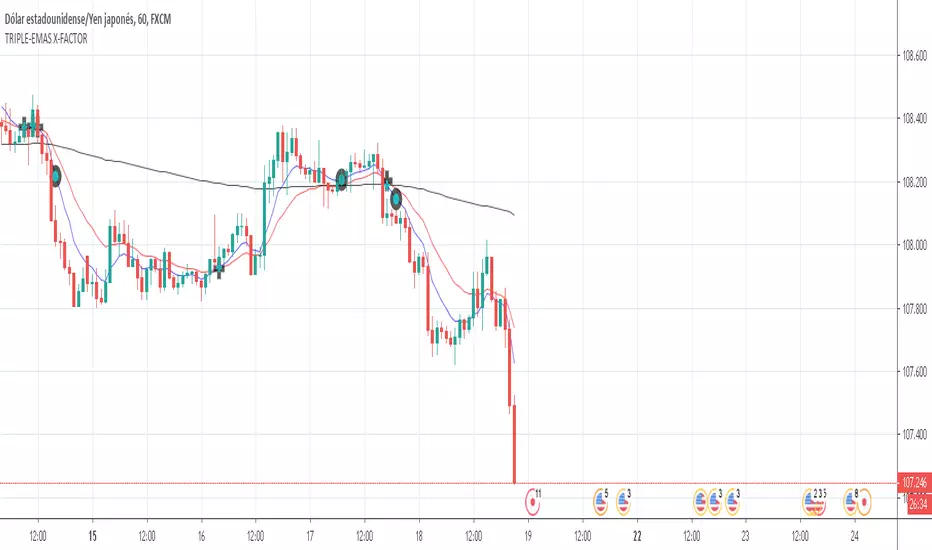
TRIPLE-EMAS X-FACTORindicador que nos simplifica la utilización de las EMAS 8,18 y 200 que utilizaremos para confirmar las entradas de las operaciones. Las EMAS o Medias Móviles Exponenciales nos muestra el valor medio del precio de un instrumento durante un determinado período de tiempo, es decir nos marcan la tendencia momentánea y la tendencia larga.
Crypto Investidor EMA e MA Crypto Investidor EMA e MA consiste em um conjunto de 4 EMAs de 21 / 50 / 100 / 200 períodos e também 4 MAs de 21 / 50 / 100 / 200, criado para facilitar o entendimento dos nossos seguidores, a ponto de poder verificar no gráfico tanto as Medias Móveis Exponenciais, quanto as Medias Móveis Simples. Um excelente indicador para quem utiliza o tradingview free.

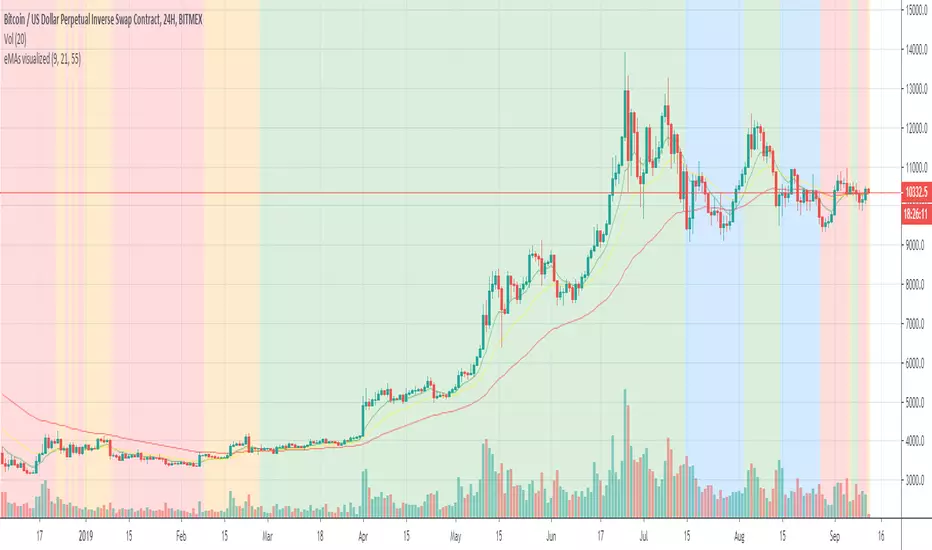
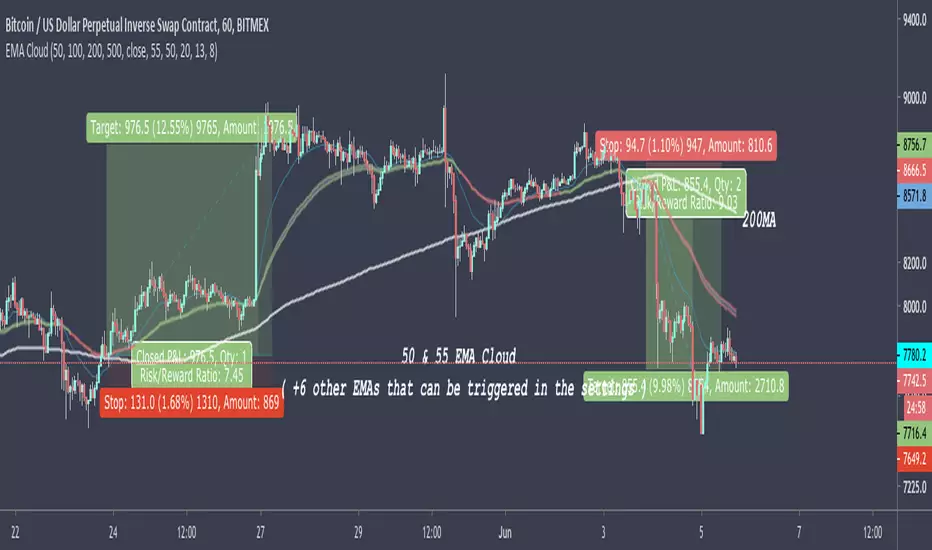
50 & 55 EMA CloudAfter testing thousands of indicators over the years, this simple EMA cloud indicator that I built is still my main weapon. It's always the first one I add to a blank charts and that is not going to change anytime soon.
I find EMAs and MAs are such underrated tools, By observing the price action surrounding these, I can see straight away if it's a good time to get into a trade or not.
As seen here, I also use the 200MA along with the 50/55EMA cloud to find extra strong support and resistances. If price starts to reject both the cloud and the 200MA at the same time/level, then it's a very good indication the price is going to make a big move in that direction as seen here in this chart.
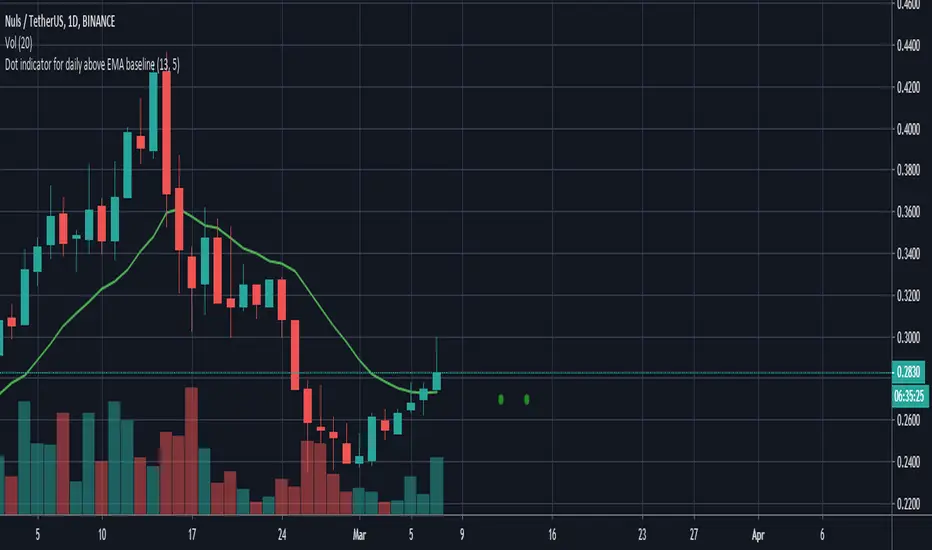
Dot indicator - Daily candle opened above the daily EMA baseline
//@version=3
//Written by David Carruthers
//Objective
//This is to support scanning the market to check if the daily candle opened above the daily EMA baseline for a selected pair
//This can be done in some measure by using trading view's screening tools
//However it would be useful, if someone references a pair, to instantly see if that pair opened above the daily baseline regardless of what resolution you are in
//This script, works out a green dot if the pairs daily candle opened above the daily EMA baseline, and a red dot if it didn't
//It then displays a green or red dot on the open for the last candle you are looking at regardless of resolution
//This saves jumping back and forth between the daily resolution and current resolution
Note please excuse my Pine scripting I am new to it :-)
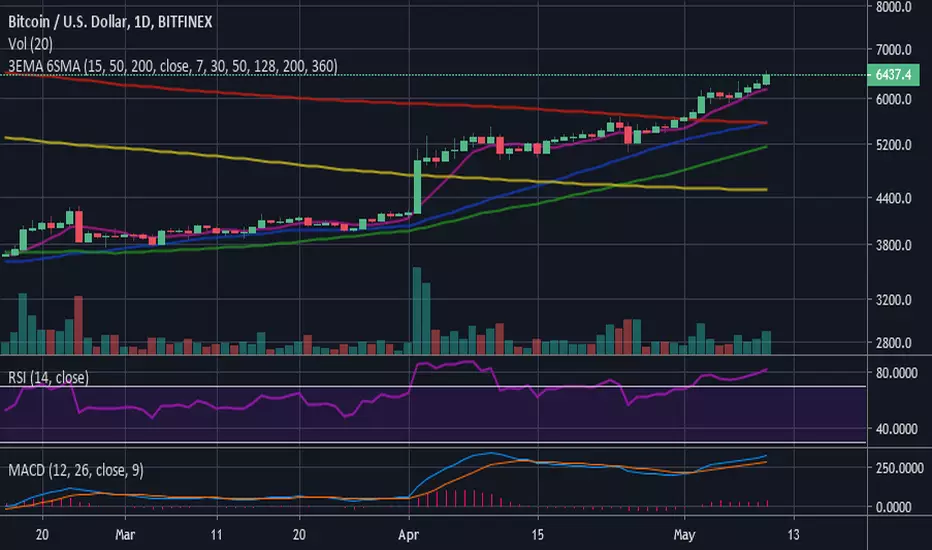
3 EMA (15-50-200) - 6 SMA (7-30-50-128-200-360)3 Moving Average Exponential - 6 Simple Moving Average . Crypto EMA - MA . 7 is a fast support or resistance, 15 confirmation support or resistance. 30 Important support and resistance . 50 institutional support or resistance. 200 institutional general trend, support and resistance , 360 general trend, support and resistance . The use of EMA or MA is according to your liking/trading plan