Ultimate Moving Averages (SMA & EMA)Welcome to the Ultimate Moving Average indicator.
Never again spend time looking for EMA / SMA indicators when you can have them all in this single indicator.
Options include :
Daily Chart: Classic Golden / Death Cross - 50/D and 200/D SMA
Daily Chart: 3-day Golden / Death Cross - 150/D and 600/D SMA
Daily Chart: 140/D SMA
Daily Chart: 700/D SMA
Daily Chart: 1458/D SMA
Daily Chart: Golden Ratio Multiplier
Any Chart: Scalping
9 SMA
10 SMA
20 SMA
21 SMA
30 SMA
34 SMA
50 SMA
80 SMA
100 SMA
200 SMA
8 EMA
10 EMA
13 EMA
20 EMA
21 EMA
26 EMA
30 EMA
34 EMA
50 EMA
55 EMA
80 EMA
89 EMA
100 EMA
200 EMA
ค้นหาในสคริปต์สำหรับ "ema"

MTF EMA Trend Table (50/100/200)Using the MTF EMA Trend Table for Supply & Demand Trading
This document explains how to use the Multi‑Timeframe EMA Trend Table as part of a supply and demand trading strategy.
The indicator displays the trend direction (Bullish or Bearish) for EMA 50, 100, and 200 across the following timeframes: 5m, 15m, 30m, 1h, 4h, 1d, and 1w.
---------------------------------------------
1. What the Indicator Shows
---------------------------------------------
The EMA Trend Table instantly reveals whether price is trading above or below the EMA 50/100/200 on multiple timeframes.
• Price above EMA = Bullish trend
• Price below EMA = Bearish trend
This allows you to identify trend alignment across all key timeframes.
---------------------------------------------
2. Why EMAs Matter in Supply & Demand Trading
---------------------------------------------
Supply & Demand zones show where institutions previously bought or sold aggressively. To trade these zones effectively, you must confirm higher‑timeframe trend direction.
The EMA table prevents low‑probability trades by keeping you aligned with institutional flow.
---------------------------------------------
3. How to Use the Indicator for Supply & Demand Trading
---------------------------------------------
Step 1 — Identify Higher‑Timeframe Bias (4H, 1D, 1W)
• Bullish alignment (all green) → Trade demand zones only.
• Bearish alignment (all red) → Trade supply zones only.
Step 2 — Use 1H, 30M, 15M for Setup Timing
These mid‑timeframes help you determine when a pullback is nearing completion.
Step 3 — Trigger Entry on the 5M EMA Flip
Once price enters a supply or demand zone, wait for the 5m EMA trend to flip in your direction before entering.
---------------------------------------------
4. How to Judge Zone Strength Using EMAs
---------------------------------------------
Strong Demand Zone Characteristics:
• Price above EMA200 on 1H+
• Zone forms above EMA200
• Pullback touches EMA50 or EMA100
Strong Supply Zone Characteristics:
• Price below EMA200 on 1H+
• Zone forms below EMA200
• Pullback touches EMA50 or EMA100
---------------------------------------------
5. Full Trade Example
---------------------------------------------
Higher timeframes are bullish: 1W, 1D, 4H all green.
Price pulls back into a 15m demand zone.
5m flips from Bearish → Bullish.
This is the entry confirmation.
---------------------------------------------
6. Why This Indicator Improves Your Trading
---------------------------------------------
• Confirms trend direction
• Shows alignment across timeframes
• Helps avoid counter‑trend traps
• Improves zone accuracy and confidence
• Enhances timing using the 5m EMA flip
This combination is ideal for institutional‑style supply and demand trading.

EMA Cross By Crypto collective Xეს ინდიკატორი გაძლევთ საშუალებას ნახოთ ყველაზე პოპულარული EMA წყვილები ერთ გრაფიკზე:
EMA 9/21
EMA 20/50
EMA 50/200
EMA 100/200
და საკუთარი, მომხმარებლის მიერ შერჩეული Custom წყვილი.
👉 თითოეულ წყვილს შეგიძლია ჩართო/გამორთო ინდიკატორის პარამეტრებიდან.
👉 შესაძლებელია ფერების შეცვლა, ასევე სურვილის შემთხვევაში EMA-ების higher timeframe-ზე გამოტანა (მაგ. 1D EMA 4H გრაფიკზე).
ეს ინსტრუმენტი განსაკუთრებით გამოსადეგია:
ტრენდების დადგენისთვის
გრძელვადიანი და მოკლევადიანი გადაკვეთების შესადარებლად
საკუთარი სტრატეგიის ტესტირებისთვის
This indicator lets you plot and compare the most commonly used EMA pairs on a single chart:
EMA 9/21
EMA 20/50
EMA 50/200
EMA 100/200
plus a fully customizable user-defined EMA pair.
👉 Each pair can be toggled on/off from the settings.
👉 Colors are customizable, and you can optionally display EMAs from a higher timeframe (e.g., show Daily EMAs on a 4H chart).
This tool is especially useful for:
Trend confirmation
Comparing short-term vs. long-term crosses
Backtesting your own strategies

Multi-EMAMulti-EMA Indicator
This script plots five commonly used Exponential Moving Averages (EMAs) on your chart for trend identification and trade timing.
Included EMAs & Colors:
EMA 8 — Red
EMA 20 — Orange
EMA 50 — Yellow
EMA 100 — Cyan
EMA 200 — Blue
How to use:
Shorter EMAs (8 & 20) help identify short-term momentum and potential entry/exit points.
Mid-range EMA (50) gives a broader view of intermediate trends.
Longer EMAs (100 & 200) are used to confirm long-term trend direction and key support/resistance zones.
Crossovers between EMAs can signal potential trend changes.
Price trading above most EMAs often signals bullish conditions, while trading below suggests bearish momentum.
Designed to work on any timeframe or market.

Normalized EMA Cycle (NEC)Normalized EMA Cycle (NEC)
The Normalized EMA Cycle (NEC) is a versatile momentum and trend reversal tool designed to detect high-probability turning points and gauge the strength of price cycles.
It combines fast and slow Exponential Moving Averages (EMAs), dynamic normalization, and adaptive transparency to create clear, intuitive reversal signals on the chart.
🔹 How It Works
EMA Differencing
The NEC calculates the difference between a fast EMA and a slower EMA:
Fast EMA Length (default 6) captures short-term momentum.
Slow EMA Length (default 16) tracks broader trends.
The slope of this difference identifies accelerating or decelerating momentum.
Normalization to 0–100 Scale
The raw EMA difference is scaled relative to the recent Alpha Period range (default 6 bars).
This transforms the value into a normalized oscillator ranging between 0 and 100.
A 3-period Hull Moving Average (HMA) smooths this series to reduce noise.
Overbought and Oversold Thresholds
By default:
Overbought Level: 75
Oversold Level: 25
Crossovers of these levels are used to detect potential reversals.
Adaptive Alpha Adjustment
The normalized value is transformed into an “Alpha Schaff” line, dynamically shifting between price and normalized cycles.
This helps the model adjust to different volatility regimes.
Trend Reversal Logic
Bullish Reversal:
Normalized oscillator crosses above the Oversold Level.
EMA difference slope is positive.
Bearish Reversal:
Normalized oscillator crosses below the Overbought Level.
EMA difference slope is negative.
Additional confirmation comes when price crosses the Alpha Schaff line in the direction of momentum.
Dynamic Confidence Visualization
The indicator calculates a trend confidence score based on the normalized separation of the EMAs.
The transparency of reversal markers dynamically adjusts:
Strong trends = more opaque signals
Weak trends = more transparent signals
🔹 How to Use
✅ Entries
Long Signal: Aqua upward label appears below a bar.
Conditions:
Bullish reversal or price crossing above Alpha Schaff
Normalized slope is rising
Short Signal: Fuchsia downward label appears above a bar.
Conditions:
Bearish reversal or price crossing below Alpha Schaff
Normalized slope is falling
✅ Trend Strength
The less transparent the signal marker, the more significant the trend.
✅ Customization
Use the inputs to fine-tune sensitivity:
Shorter EMAs: Faster signals
Longer EMAs: Smoother trends
Alpha Period: Adjusts the lookback range for normalization
🟢 Best Practices
NEC is best used in combination with other trend confirmation tools (e.g., price structure, volume, or higher timeframe EMAs).
Avoid relying on signals in extremely low-volume or choppy ranges.
⚠️ Disclaimer
This script is intended for educational purposes only and does not constitute financial advice. Trading involves substantial risk, and you should consult your financial advisor before making any investment decisions.

Moneyball EMA-MACD indicator [VinnieTheFish]Summary of the Moneyball EMA-MACD Indicator Script
Author: VinnieTheFish
Purpose:
This indicator helps traders identify trend direction, momentum shifts, and potential trade signals based on EMA and MACD crossovers.
This Pine Script is a custom indicator that combines Exponential Moving Averages (EMAs) and MACD (Moving Average Convergence Divergence) to analyze price trends and momentum. The script uses a custom 9/50 MACD with a 16 smoothing period. The script is written in a way that you can create your own custom MACD settings and create alerts based on those parameters. The chart bars are color coded based on the relative position of the MACD and Signal line primarily for bullish long trade setups.
Bar color coding helps the trader spot potential reversals based on where the price currently resides in relation to the custom 9/50 EMA based MACD and the 16 period smoothing period for the signal line. Indicator also has custom alerts to notify the trader when a potential trade setup exists that correspond with the bar color change.
Question: So why is this called the Moneywell EMA-MACD Indicator?
Answer: In the movie Moneyball the Oakland A's broke down how to win a championship based on data. To make the playoffs you needed so many wins, then broken down by runs and then broken down to base hits. A base hit was good as a walk. With trading often times we look too often for home runs and ignore the importance of getting on base with small wins. This indicator was designed on shorter timeframes to identify those base hits, but can also be adapted to higher timeframes for swing trading.
Key Features:
User Inputs:
Configurable fast and slow lengths for MACD calculation.
Choice between SMA and EMA for oscillator and signal line smoothing.
Customizable signal smoothing length.
EMA Calculation:
Computes 3 EMA, 9 EMA, 20 EMA, and 50 EMA to track short-term and long-term trends.
MACD Calculation:
Computes MACD using either SMA or EMA based on user selection.
Generates the MACD signal line for comparison.
Crossover Conditions:
Detects MACD and Signal line crossovers above and below the zero line.
Identifies price momentum shifts.
Bar Coloring Logic:
Green: MACD is above 0 and above the signal line.
White: MACD is below the signal line.
Orange: MACD is below 0 but above the signal line.
Fuchsia: Bullish EMA 3/9 cross but price is still below the 20/50 EMA.
Alerts for Key Trading Signals:
MACD crossing above/below the zero line.
Signal line crossing above/below the zero line.
MACD reaching new highs/lows.
Alerts for colored bar conditions.

Turtle Trade Channels Indicator with EMATurtle Trade Channels Indicator with EMA (TuTCI + EMA)
This custom indicator combines the classic Turtle Trading Channel strategy with an Exponential Moving Average (EMA) filter to provide clear entry and exit signals, as well as trend direction guidance.
Features:
Turtle Channels: The indicator calculates the upper and lower Turtle Trading Channels based on the highest and lowest values over a user-defined period ( Entry Length for the channel).
Entry/Exit Signals: Alerts you to potential buy and sell opportunities with visual signals on the chart.
Long Entry: When the price crosses above the upper channel.
Short Entry: When the price crosses below the lower channel.
Long Exit: When the price breaks below the exit line.
Short Exit: When the price breaks above the exit line.
EMA Filter: A 50-period Exponential Moving Average (EMA) is included to identify the overall trend. The background color turns green when the price is above the EMA (bullish trend) and red when the price is below the EMA (bearish trend).
Highlighter: Optional background highlighting for the most relevant signals, such as when the price crosses the upper or lower Turtle Channel. This feature helps to easily identify key market movements.
Visual Customization: Customize the EMA length, Entry/Exit lengths, and toggle signals and highlighting to suit your preferences.
How It Works:
The Turtle Trade Channels are designed to capture breakouts by identifying key price levels (highest high and lowest low) over a specified period. By combining this strategy with an EMA, the indicator ensures trades are aligned with the broader trend, increasing the probability of successful trades.
Uptrend: When the price is above the EMA, the indicator considers the trend to be bullish, and it highlights long entry signals.
Downtrend: When the price is below the EMA, the trend is considered bearish, and short entries are emphasized.
Customization:
Entry Length: Adjusts the period for calculating the Turtle Channel's entry levels.
Exit Length: Defines the period for calculating the exit levels.
EMA Length: The period for the Exponential Moving Average (default is set to 50).
Show Entry/Exit Signals: Toggle the visibility of entry/exit signals on the chart.
Highlighter On/Off: Toggle background highlighting for key signals.
This indicator is suitable for traders who follow trend-following strategies, particularly those influenced by the Turtle Trading methodology, and wish to use an EMA filter for better trend confirmation.
Use Cases:
Trend-following traders looking for clear entry/exit signals.
Breakout traders using the Turtle Trading concept to identify price breakouts.
Swing traders who want to incorporate trend analysis with price levels.

EMA Trend Arrows Indicator### EMA Trend Arrows Indicator
**Description:**
The "EMA Trend Arrows Indicator" is designed to help traders identify bullish and bearish trends based on the Exponential Moving Average (EMA). This indicator plots arrows and lines on the chart, signaling potential trend changes, making it easier for users to spot entry and exit points in their trades.
**Indicator Features:**
1. **EMA Calculation:**
- The indicator calculates the Exponential Moving Average (EMA) over a user-defined period (`Length`).
- The default length is set to 50 periods but can be adjusted to suit different trading strategies.
2. **Trend Detection:**
- The indicator detects bullish trends when the EMA is falling for a specified duration (`Trend Duration`) and then starts rising.
- Conversely, it detects bearish trends when the EMA is rising for a specified duration and then starts falling.
- The default trend duration is set to 20 periods.
3. **Visual Signals:**
- **Bullish Signal:** When a bullish trend is detected, the indicator plots a blue upward arrow (▲) above the bar where the trend change is identified.
- **Bearish Signal:** When a bearish trend is detected, the indicator plots a red downward arrow (▼) below the bar where the trend change is identified.
- Additionally, lines are drawn to indicate the strength and duration of the trends. Blue lines represent bullish trends, while red lines represent bearish trends.
4. **Average True Range (ATR):**
- The indicator utilizes the Average True Range (ATR) to determine the placement of the lines and arrows, ensuring they are appropriately scaled to the price movements.
5. **EMA Plotting:**
- The EMA line is plotted on the chart in a grey color, allowing users to visualize the moving average alongside the trend signals.
6. **Chart Clarity:**
- To maintain a clear and uncluttered chart, the indicator automatically deletes past trend direction signals once a new trend is detected. This ensures that only the most relevant and current trend signals are displayed.
**User Inputs:**
- `Length`: Defines the period for EMA calculation. Default is 50.
- `Trend Duration`: Sets the duration to consider for trend changes. Default is 20.
- `Bullish`: Sets the color for bullish signals. Default is blue (#2962ff).
- `Bearish`: Sets the color for bearish signals. Default is red (#f23645).
- `MA`: Sets the color for the EMA line. Default is grey (#787b86).
**How to Use:**
- Add the "EMA Trend Arrows Indicator" to your chart.
- Configure the `Length` and `Trend Duration` based on your trading strategy.
- Observe the chart for blue upward arrows indicating potential buy signals and red downward arrows indicating potential sell signals.
- Use the plotted EMA line to gauge the overall market trend and make more informed trading decisions.
**Benefits:**
- Simplifies trend detection by providing clear visual signals.
- Helps traders identify potential entry and exit points.
- Customizable settings to fit various trading strategies.
- Maintains a clean chart by automatically removing outdated trend direction signals.
**Example:**
When applied to a daily chart, the indicator can help identify major trend reversals, providing traders with timely buy and sell signals. For instance, a blue arrow appearing after a period of EMA decline signals a potential buying opportunity as the trend shifts to bullish.
Add this indicator to your TradingView chart today to enhance your trend analysis and improve your trading performance.
Best regards Chervolino

Ichimoku + EMA + RSI [Enhanced]# **Ichimoku + EMA + RSI Strategy - User Instructions**
---
## **📋 TABLE OF CONTENTS**
1. (#installation)
2. (#strategy-overview)
3. (#parameter-configuration)
4. (#understanding-the-dashboard)
5. (#entry--exit-rules)
6. (#best-practices)
7. (#optimization-guide)
8. (#troubleshooting)
---
## **🚀 INSTALLATION**
### **Step 1: Add to TradingView**
1. Open TradingView.com
2. Click **Pine Editor** (bottom of screen)
3. Click **"New"** → Select **"Blank indicator"**
4. Delete all default code
5. **Copy and paste** the complete script
6. Click **"Save"** (give it a name: "Ichimoku EMA RSI Strategy")
7. Click **"Add to Chart"**
### **Step 2: Verify Installation**
✅ You should see:
- Orange **200 EMA** line
- Blue **Tenkan** line
- Red **Kijun** line
- Green/Red **Cloud** (Ichimoku cloud)
- **Dashboard** in top-right corner
- **Strategy Tester** tab at bottom
---
## **📊 STRATEGY OVERVIEW**
### **What This Strategy Does**
Combines three powerful technical indicators to identify high-probability trades:
| Component | Purpose |
|-----------|---------|
| **200 EMA** | Determines overall trend direction |
| **Ichimoku Cloud** | Provides support/resistance and momentum |
| **RSI** | Filters momentum strength |
| **Dashboard** | Real-time signal analysis |
### **Trading Logic**
- **LONG**: Enter when all bullish conditions align
- **SHORT**: Enter when all bearish conditions align
- **EXITS**: Automatic via trailing stops, cloud breach, or TK cross reversal
---
## **⚙️ PARAMETER CONFIGURATION**
### **🔵 Trend Filter Settings**
```
EMA Length: 200 (default)
```
- **Lower (100-150)**: More sensitive, faster signals
- **Higher (250-300)**: More stable, slower signals
- **Recommendation**: Keep at 200 for most timeframes
---
### **🟢 RSI Settings**
```
RSI Length: 14 (default)
RSI Long Minimum: 55
RSI Short Maximum: 45
```
**Adjustment Guide:**
- **Aggressive** (more signals): Long=50, Short=50
- **Balanced** (default): Long=55, Short=45
- **Conservative** (fewer signals): Long=60, Short=40
---
### **🟡 Ichimoku Settings**
```
Tenkan Period: 9
Kijun Period: 26
Senkou B Period: 52
Displacement: 26
```
**Standard Configurations:**
| Timeframe | Tenkan | Kijun | Senkou B |
|-----------|--------|-------|----------|
| **1H - 4H** | 9 | 26 | 52 |
| **15m - 1H** | 7 | 22 | 44 |
| **Daily** | 9 | 26 | 52 |
**Filters:**
- ✅ **Require Chikou Confirmation**: Adds extra validation (recommended)
- ✅ **Require Cloud Position**: Price must be above/below cloud (recommended)
---
### **🔴 Risk Management**
```
ATR Length: 14
ATR Stop Loss Multiplier: 2.0
ATR Take Profit Multiplier: 3.0
Min Bars Between Trades: 3
```
**Risk/Reward Profiles:**
| Profile | SL Multiplier | TP Multiplier | Description |
|---------|---------------|---------------|-------------|
| **Conservative** | 2.5 | 4.0 | Wider stops, higher R:R |
| **Balanced** | 2.0 | 3.0 | Default settings |
| **Aggressive** | 1.5 | 2.5 | Tighter stops, faster exits |
---
### **🎨 Display Settings**
```
Show Dashboard: ON
Show Entry Signals: ON
```
- **Dashboard**: Shows real-time analysis
- **Entry Signals**: Green/Red arrows on chart
---
## **📈 UNDERSTANDING THE DASHBOARD**
### **Dashboard Components**
```
┌─────────────────────┬──────────┐
│ Component │ Status │
├─────────────────────┼──────────┤
│ EMA Trend │ BULL/BEAR│
│ Cloud │ ABOVE/BELOW/INSIDE│
│ TK Cross │ BULL/BEAR│
│ RSI │ 55.3 │
│ Chikou │ BULL/BEAR│
│ Signal │ STRONG LONG│
└─────────────────────┴──────────┘
```
### **Signal Interpretation**
| Signal | Score | Meaning | Action |
|--------|-------|---------|--------|
| **STRONG LONG** | 7+ | All conditions aligned | High confidence LONG |
| **LONG** | 4-6 | Most conditions met | Moderate confidence |
| **NEUTRAL** | <4 | Mixed signals | Wait for clarity |
| **SHORT** | 4-6 | Bearish bias | Moderate SHORT |
| **STRONG SHORT** | 7+ | All bearish conditions | High confidence SHORT |
---
## **📍 ENTRY & EXIT RULES**
### **✅ LONG ENTRY CONDITIONS**
All must be TRUE:
1. ✅ Price **above** 200 EMA
2. ✅ Price **above** Ichimoku Cloud
3. ✅ Tenkan **crosses above** Kijun (TK Bull Cross)
4. ✅ RSI **above** 55
5. ✅ Chikou **above** price 26 bars ago
6. ✅ Minimum bars since last trade met
**Visual Confirmation:**
- 🟢 Green triangle **below** candle
- Dashboard shows **"STRONG LONG"**
---
### **❌ LONG EXIT CONDITIONS**
Any ONE triggers exit:
1. ❌ Price closes **below** cloud bottom
2. ❌ Tenkan **crosses below** Kijun
3. ❌ ATR trailing stop hit (2.0 × ATR)
4. ❌ Take profit hit (3.0 × ATR)
---
### **✅ SHORT ENTRY CONDITIONS**
All must be TRUE:
1. ✅ Price **below** 200 EMA
2. ✅ Price **below** Ichimoku Cloud
3. ✅ Tenkan **crosses below** Kijun (TK Bear Cross)
4. ✅ RSI **below** 45
5. ✅ Chikou **below** price 26 bars ago
6. ✅ Minimum bars since last trade met
**Visual Confirmation:**
- 🔴 Red triangle **above** candle
- Dashboard shows **"STRONG SHORT"**
---
### **❌ SHORT EXIT CONDITIONS**
Any ONE triggers exit:
1. ❌ Price closes **above** cloud top
2. ❌ Tenkan **crosses above** Kijun
3. ❌ ATR trailing stop hit (2.0 × ATR)
4. ❌ Take profit hit (3.0 × ATR)
---
## **💡 BEST PRACTICES**
### **Recommended Timeframes**
| Timeframe | Trading Style | Signals/Week |
|-----------|---------------|--------------|
| **15m** | Scalping | 20-30 |
| **1H** | Day Trading | 10-15 |
| **4H** | Swing Trading | 5-10 |
| **Daily** | Position Trading | 2-5 |
---
### **Asset Classes**
✅ **Best Performance:**
- Major Forex pairs (EUR/USD, GBP/USD)
- Crypto (BTC/USD, ETH/USD)
- Major indices (SPX, NAS100)
⚠️ **Use Caution:**
- Low liquidity pairs
- Highly volatile altcoins
- Stocks with gaps
---
### **Risk Management Rules**
```
1. Never risk more than 2% per trade
2. Use the built-in ATR stops (don't override)
3. Respect the "Min Bars Between Trades" cooldown
4. Don't trade during major news events
5. Monitor dashboard - only trade STRONG signals
```
---
## **🔧 OPTIMIZATION GUIDE**
### **Step 1: Run Initial Backtest**
1. Open **Strategy Tester** tab (bottom of screen)
2. Set date range (minimum 6 months)
3. Review:
- **Net Profit**
- **Win Rate** (target: >50%)
- **Profit Factor** (target: >1.5)
- **Max Drawdown** (target: <20%)
---
### **Step 2: Optimize Parameters**
**If Win Rate is Low (<45%):**
- Increase RSI thresholds (Long=60, Short=40)
- Enable both Chikou + Cloud filters
- Increase "Min Bars Between Trades" to 5
**If Too Few Signals:**
- Decrease RSI thresholds (Long=50, Short=50)
- Reduce EMA to 150
- Adjust Ichimoku to faster settings (7/22/44)
**If Drawdown is High (>25%):**
- Increase ATR Stop Loss Multiplier to 2.5
- Add longer cooldown period (5+ bars)
- Trade only STRONG signals
---
### **Step 3: Forward Test**
```
1. Paper trade for 2-4 weeks
2. Compare results to backtest
3. Adjust if live results differ significantly
4. Only go live after consistent paper trading success
```
---
## **🛠️ TROUBLESHOOTING**
### **Problem: No Signals Appearing**
**Solutions:**
- Check RSI levels aren't too restrictive
- Verify timeframe is appropriate (try 1H or 4H)
- Ensure both filters aren't enabled on ranging markets
- Review dashboard - components may be conflicting
---
### **Problem: Too Many Losing Trades**
**Solutions:**
- Enable **both** Chikou + Cloud filters
- Increase RSI thresholds (more conservative)
- Only trade when dashboard shows "STRONG" signals
- Increase cooldown period to avoid overtrading
---
### **Problem: Dashboard Not Showing**
**Solutions:**
- Verify "Show Dashboard" is enabled in settings
- Check chart isn't zoomed out too far
- Refresh chart (F5)
- Re-add indicator to chart
---
### **Problem: Stops Too Tight/Wide**
**Solutions:**
- **Too Tight**: Increase ATR Stop Loss Multiplier to 2.5-3.0
- **Too Wide**: Decrease to 1.5-1.8
- Verify ATR Length is appropriate for timeframe
- Consider asset volatility (crypto needs wider stops)
---
## **📞 QUICK REFERENCE CARD**
```
═══════════════════════════════════════════════════
STRATEGY QUICK REFERENCE
═══════════════════════════════════════════════════
BEST TIMEFRAMES: 1H, 4H, Daily
BEST ASSETS: Major Forex, BTC, ETH, Indices
RISK PER TRADE: 1-2% of capital
LONG ENTRY:
✓ Price > 200 EMA
✓ Price > Cloud
✓ TK Bull Cross
✓ RSI > 55
✓ Dashboard = STRONG LONG
SHORT ENTRY:
✓ Price < 200 EMA
✓ Price < Cloud
✓ TK Bear Cross
✓ RSI < 45
✓ Dashboard = STRONG SHORT
EXITS:
× Cloud breach
× TK reverse cross
× ATR trailing stop
× Take profit (3:1 R:R)
═══════════════════════════════════════════════════
```
---
## **⚠️ DISCLAIMER**
This strategy is for **educational purposes only**. Always:
- Backtest thoroughly on your specific assets
- Paper trade before going live
- Never risk more than you can afford to lose
- Past performance ≠ future results
- Consider market conditions and your risk tolerance
---
**Happy Trading! 📈**
TradingView — Track All Markets
Where the world charts, chats, and trades markets. We're a supercharged super-charting platform and social network for traders and investors. Free to sign up.

Triple EMA + Stochastic/ADX# Triple EMA + Stochastic/ADX Breakout Indicator
A professional TradingView indicator designed for trend-following and momentum breakout trading. This system uses a hierarchical confirmation process to ensure high-probability entries and robust trend maintenance.
## 🚀 Core Trading Logic: "The Setup Cycle"
This indicator operates on a **Cycle-Based Logic** rather than simple crossovers. A trade cycle is defined as:
1. **The Setup (Priming)**: A Stochastic crossover (K > D for Long, D > K for Short) initiates a "Setup Mode." This is marked by a small dot (Blue for Long, Orange for Short).
2. **The Confirmation (Trend)**: The systems checks for hierarchical EMA alignment (Fast > Medium > Slow for Longs).
3. **The Trigger (Breakout)**: Once the Setup is active and EMAs are aligned, every **Price Breakout** above the previous high (X-period) triggers a continuous **BUY/SELL mark**.
4. **The Exit (Take Profit/Stop)**: The cycle and trade only end when the Fast EMA crosses back over the Medium EMA (EMA 9/21 crossover).
---
## 🛠 Features
### 1. Triple EMA System
* **Hierarchical Alignment**: Requires Fast > Medium > Slow (9, 21, 50 by default) for a confirmed trend direction.
* **Dynamic Trend Background**: Chart background changes color when a full EMA trend is established.
### 2. Dual Filter System (Stochastic & ADX)
* **Stochastic Setup**: Uses smoothed %K and %D to identify the start of momentum cycles.
* **ADX Filter**: Provides a trend-strength baseline. Default threshold is set to 20 to filter out choppy markets.
### 3. Price Breakout Confirmation
* Requires price to break above/below the previous High/Low of the last X bars (default 10).
* Allows for **continuous entries** within a single trend cycle.
### 4. Robust Exit Strategy
* **EMA Crossover Exit**: The primary exit method. Triggers an "EXIT" flag when the trend momentum shifts.
* **ATR Trailing Stop**: A secondary volatility-based stop that moves with the price. Can be set as the absolute exit or used for visual reference.
### 5. Mean Reversion Mode (Optional)
* Identifies overextended price action (percent deviation from EMA2).
* Signals potential "bounce" or "rejection" trades against the trend.
---
## 📊 Dashboard & Visuals
* **🟢 BUY / 🔴 SELL**: Trend continuation breakout signals.
* **🟠 EXIT / 🟣 EXIT**: Trend reversal/exit signals.
* **🔵/🟠 Small Dots**: Setup priming moments.
* **Real-time Dashboard**: Displays current Setup Status, EMA Alignment, Breakout status, ADX strength, and calculated Stop levels.
---
## ⚙️ How to Customize
| Parameter | Recommended Use |
| :--- | :--- |
| **Breakout Lookback** | Lower (3-5) for aggressive scalping, Higher (10-20) for conservative trends. |
| **Filter Mode** | Choose "Stochastic" for momentum or "ADX" for trend strength preference. |
| **ATR Multiplier** | Reduce (1.5) for tighter stops, Increase (3.0) for wider trend following. |
| **Exit ONLY on EMA** | Enable to stay in trades longer; Disable to exit immediately on ATR stop hits. |
---
## 📥 Installation
1. Open your **Pine Editor** in TradingView.
2. Create a new "Indicator."
3. Copy the code from `Triple_EMA_Stochastic_ADX.pine`.
4. Click **Save** and **Add to Chart**.
---
*Developed for Dhan/MCX/Futures and general Asset Trading.*

Price % Distance from 52 Weeks High, and EMAs"Stop guessing how far extended the price is—measure it instantly."
As a swing trader, knowing the exact distance between the current price and your key moving averages is critical. It tells you if a stock is overextended (too far) or offering a low-risk pullback entry (near 0%).
This lightweight utility script calculates the real-time percentage distance of the closing price from three critical levels:
10 EMA (Short-term momentum)
20 EMA (Swing trend baseline)
52-Week High (Major structural resistance)
It displays this data in a single, clean Smart Label attached to the latest candle, keeping your chart clutter-free.
Key Features
📊 Instant Calculation: See exactly how far (%) the price is from the 10 EMA, 20 EMA, and 52-Week High without using a measuring tool.
🧠 Intelligent Trend Coloring: The text color changes dynamically based on the immediate trend:
🟢 Green Text: Price is ABOVE both 10 & 20 EMAs (Bullish / Buy-the-dip zone).
🔴 Red Text: Price is BELOW both 10 & 20 EMAs (Bearish / Caution).
⚪ White Text: Price is mixed/choppy (between the EMAs).
👁️ High Contrast Design: Uses a semi-transparent dark background that ensures the data is clearly visible on both Light and Dark mode charts.
How to Use for Swing Trading
Pullback Entries: In a strong uptrend (Green Text), watch for the 10 EMA or 20 EMA % value to drop near 0.0% to 0.5%. This indicates a pullback to the average—often a high-probability entry point.
Overextension Warning: If the % distance becomes unusually large (e.g., Price is +5% above the 10 EMA), the move may be overextended, signaling to tighten stops or take profit.
52-Week Breakouts: Monitor the 52W % distance. As it approaches 0.0%, the stock is challenging its yearly high, alerting you to potential breakout plays.
Settings
EMA Lengths: Fully customizable (Default: 10 & 20).
Lookback: Adjust the high lookback period (Default: 260 bars for 52 Weeks).
Position: Toggle the label to appear Above or Below the candle.

W%R Pullback+EMA Trend [TS_Indie]🔰 Core Concept of the Strategy
The main idea is “Trend-Following with Momentum Pullback.”
This means trading in the direction of the main trend (defined by EMA) while using Williams %R to identify pullback entries (buying the dip or selling the rally) where momentum returns to the trend direction.
📊 Indicators Used
1. EMA Fast – Defines the short-term trend.
2. EMA Slow – Defines the long-term trend (used as a trend filter).
3. Williams %R
• Overbought zone: above -20
• Oversold zone: below -80
⚙️ Entry Rules
🔹 Buy Setup
1. EMA Fast > EMA Slow → Uptrend condition.
2. Williams %R on the previous candle dropped below -80, and on the current candle, it crosses back above -80 → indicates momentum returning to the upside.
3. Current close is above EMA Fast.
4. Entry Buy at the close of the candle where %R crosses above -80.
🎯 Entry, Stop Loss, and Take Profit
1. Entry : At the candle close where the signal occurs.
2. Stop Loss : At the lowest low between the current and previous candles.
3. Take Profit : Calculated based on entry price and stop loss distance multiplied by the Risk/Reward Ratio.
🔹 Sell Setup
1. EMA Fast < EMA Slow → Downtrend condition.
2. Williams %R on the previous candle went above -20, and on the current candle, it crosses back below -20 → indicates renewed selling momentum.
3. Current price is below EMA Fast.
4. Entry Sell at the close of the candle where %R crosses below -20.
🎯 Entry, Stop Loss, and Take Profit
1. Entry : At the candle close where the signal occurs.
2. Stop Loss : At the highest high between the current and previous candles.
3. Take Profit : Calculated based on entry price and stop loss distance multiplied by the Risk/Reward Ratio.
⚙️ Optional Parameters
• Custom Risk/Reward Ratio for Take Profit.
• Option to add ATR buffer to Stop Loss.
• Adjustable EMA Fast period.
• Adjustable EMA Slow period.
• Adjustable Williams %R period.
• Option to enable Long only / Short only positions.
• Customizable Backtest start and end date.
• Customizable trading session time.
⏰ Alert Function
Alerts display:
• Entry price
• Stop Loss price
• Take Profit price
Guys, try adjusting the parameters yourselves!
I’ve been tweaking the settings for several days and managed to get great results on XAU/USD in the 5-minute timeframe.
I think this strategy is quite interesting and could potentially deliver good results on other instruments as well.
⚠️ Disclaimer
This indicator is designed for educational and research purposes only.
It does not guarantee profits and should not be considered financial advice.
Trading in financial markets involves significant risk, including the potential loss of capital.

Stoch PRO + Dynamic EMA (EMA cross)Stoch PRO + Dynamic EMA Documentation
Overview:
- Pine Script v6 overlay indicator combining a trend-colored EMA with a Stochastic oscillator to highlight midline momentum shifts.
- Designed for TradingView charts (Indicators → Import) as a visual aid for timing entries within trend-following setups.
- Crafted and optimized around BTCUSDT on the 4h timeframe; adapt inputs before applying to other markets or intervals.
Inputs:
- EMA Length (default 50): smoothing window for the dynamic EMA; lower values respond faster but whipsaw more.
- Stochastic K Length (20): lookback for the raw %K calculation.
- Stochastic K Smoothing (3): SMA applied to %K to reduce noise.
- Stochastic D Smoothing (3): SMA over %K to produce the companion %D line.
Visual Elements:
- EMA plotted on price with linewidth 3; teal when close > EMA, fuchsia otherwise.
- Background tinted teal/fuchsia at high transparency (≈92) to reinforce the current trend bias without obscuring price bars.
Oscillator Logic:
- %K = ta.stoch(high, low, close, kLength); smoothed with ta.sma(kRaw, kSmooth).
- %D = ta.sma(k, dSmooth).
- Focus is on the midline (50) rather than traditional 20/80 extremes to emphasize rapid momentum flips.
Signals:
- Buy: %K crossing above 50 while close > EMA (teal state). Plots tiny teal circle below the bar.
- Sell: %K crossing below 50 while close < EMA (fuchsia state). Plots tiny purple circle above the bar.
Trading Workflow Tips:
- Use EMA/background color for directional bias, then confirm with %K 50-cross to refine entries.
- Consider higher-timeframe trend filters or price-action confirmation to avoid range chop.
- Stops often sit just beyond the EMA; adjust thresholds (e.g., 55/45) if too many false positives occur.
- Always plan risk/reward upfront—define TP/SL levels that fit your strategy and backtest them thoroughly before trading live.
Alerts & Extensions:
- Wrap crossUp/crossDown in alertcondition() if TradingView alerts are needed.
- For automation/backtesting, convert logic to a strategy() script or add position management rules.

Dual EMA Trend Ribbon (Multi-Timeframe Trend Confirmation) Dual EMA Trend Ribbon (Multi-Timeframe Trend Confirmation)
This Pine Script indicator creates a visually clear representation of trend direction using two overlaid Exponential Moving Average (EMA) Ribbons, which allows traders to assess both short-term and medium-term momentum at a glance.
How It Works:
The indicator plots two separate EMA ribbons, each calculated using a distinct set of periods, simulating a multi-timeframe approach on a single chart:
Inner (Fast) Ribbon (Defaults 10/30): Represents the fast-moving, short-term trend.
Green: Fast EMA 1 > Slow EMA 1 (Short-term Bullish)
Red: Fast EMA 1 < Slow EMA 1 (Short-term Bearish)
Outer (Slow) Ribbon (Defaults 40/50): Represents the slower, medium-term trend.
Darker Green/Red: Indicates the overall, underlying market bias.
How to Use:
Strong Trend Confirmation: A strong signal occurs when both ribbons are aligned (e.g., both are Green). This suggests that short-term momentum aligns with the medium-term bias.
Trend Weakness/Reversal: Pay attention when the two ribbons cross or when the fast ribbon changes color against the slow ribbon's color (e.g., fast ribbon turns Red while the slow ribbon remains Green). This often signals a temporary pullback or potential reversal of the underlying trend.
Settings: Users can easily adjust the four input periods (Fast EMA 1, Slow EMA 1, Fast EMA 2, Slow EMA 2) to customize the sensitivity to any trading style or asset.
Stalonte EMA - Stable Long-Term EMA with AlertsStalonte EMA - The Adaptive & Stable EMA - Almost Eternal
Here's why you will love "Stalonte":
The Stalonte (Stable Long-Term EMA) is a highly versatile trend-following tool. Unlike standard EMAs with fixed periods, it uses a configurable smoothing constant (alpha), allowing traders to dial in the exact level of responsiveness and stability they need. Finding the "sweet spot" (e.g., alpha ~0.03) creates a uniquely effective moving average: it is smooth enough to filter out noise and identify safe, high-probability trends, yet responsive enough to provide actionable signals without extreme lag. It includes alerts for crossovers and retests.
Pros and Cons of the Stalonte EMA
Pros:
Unparalleled Adaptability: This is its greatest strength. The alpha input lets you seamlessly transform the indicator from an ultra-slow "trend-revealer" (low alpha) into a highly effective and "safe" trend-following tool (medium alpha, e.g., 0.03), all the way to a more reactive one.
Optimized for Safety & Signal Quality: As you astutely pointed out, with the proper setting (like 0.03), it finds the perfect balance. It provides a smoother path than a standard 20-50 period EMA, which reduces whipsaws and false breakouts, leading to safer, higher-confidence signals.
Superior Trend Visualization: It gives a cleaner and more intuitive representation of the market's direction than many conventional moving averages, making it easier to "see" the trend and stick with it.
Objective Dynamic Support/Resistance: The line created with a medium alpha setting acts as a powerful dynamic support in uptrends and resistance in downtrends, offering excellent areas for entries on retests with integrated alerts.
Cons:
Requires Calibration: The only "con" is that its performance is not plug-and-play; it requires the user to find their optimal alpha value for their specific trading style and the instrument they are trading. This demands a period of testing and customization, which a standard 50-period EMA does not.
Conceptual Hurdle: For traders only familiar with period-based EMAs, the concept of a "smoothing constant" can be initially confusing compared to simply setting a "length."
In summary:
The Stalonte EMA is not a laggy relic. It is a highly sophisticated and adaptable tool. Its design allows for precise tuning, enabling a trader to discover a setting that offers a superior blend of stability and responsiveness—a "sweet spot" that provides safer and often more effective signals than many traditional moving averages. Thank you for pushing for a more accurate and fair assessment.
Use Case Example:
You can combine it with classical EMAs to find the perfect entry.
Moving Average Exponential (Daily Frozen EMA)This script plots an Exponential Moving Average (EMA) based on the daily timeframe, but with a unique twist:
✅ The EMA value is frozen for the entire current daily session, only updating when a new daily candle begins.
🔍 How it works:
The EMA is calculated using the 1-day timeframe, regardless of the chart's current timeframe.
This EMA value remains fixed throughout the day — it doesn't fluctuate intrabar.
It updates only once the daily candle has closed, providing a stable and reliable reference point during the trading day.
The default is the 5 day EMA but can be changed to any EMA timeframe you desire such as 9, 21, 50, 100. 200, etc.
✨ Additional Features:
✅ Optional smoothing with various moving average types (SMA, EMA, WMA, SMMA, VWMA).
✅ Optional Bollinger Bands on top of the smoothed EMA.
✅ Adjustable settings for EMA length, smoothing type, Bollinger Band deviation, and display options.
🛠️ Use Cases:
Ideal for traders who want a non-reactive EMA during intraday trading.
Helps reduce signal noise by anchoring EMA to higher timeframe structure.
Useful for strategy development where EMA should represent confirmed daily bias only.
Hope this helps, happy trading!

Bollinger Bands + EMA 200 + EMA 50This indicator combines three technical analysis tools: the Bollinger Bands (BB), and two Exponential Moving Averages (EMA) with periods of 200 and 50.
Bollinger Bands (BB): This indicator consists of three lines—the middle line being a simple moving average (SMA), and the upper and lower bands representing two standard deviations above and below the SMA. The width of the bands indicates market volatility, with wider bands signifying higher volatility and narrower bands indicating lower volatility.
Exponential Moving Averages (EMA 200 and EMA 50): The EMA is a type of moving average that gives more weight to recent prices, making it more responsive to price changes than the simple moving average. The EMA 200 is considered a long-term trend indicator, often used to identify the overall direction of the market. The EMA 50 is a medium-term trend indicator, helping to spot more immediate market trends. Crossovers between these two EMAs (such as when EMA 50 crosses above EMA 200) are commonly used as buy or sell signals, with the idea that a short-term trend shift is occurring.
By combining these three indicators, this custom Pine Script aims to give a comprehensive view of the market conditions, helping traders to understand both the volatility (via BB), the long-term market trend (via EMA 200), and the medium-term trend (via EMA 50). The interaction between the price and these indicators, along with crossovers, can be used to identify potential entry and exit points.

200 EMA AlertHow It Works:
The 200 EMA calculates the average price over the last 200 periods, giving more weight to recent price movements for a smoother and more responsive trend line.
It helps traders determine whether the market is in a bullish (above 200 EMA) or bearish (below 200 EMA) phase.
Why Traders Use the 200 EMA:
✅ Trend Confirmation – If the price is above the 200 EMA, the trend is bullish; if below, the trend is bearish.
✅ Dynamic Support & Resistance – Price often reacts around the 200 EMA, making it a key level for entries and exits.
✅ Works on All Timeframes – Whether on the 1-minute chart or the daily timeframe, the 200 EMA is effective for scalping, swing trading, and long-term investing.
✅ Easy to Combine with Other Indicators – Traders pair it with RSI, MACD, or price action for stronger confirmation.
How to Use It in Trading:
📌 Trend Trading – Buy when price pulls back to the 200 EMA in an uptrend; sell when price retests it in a downtrend.
📌 Breakout Strategy – A strong candle breaking above/below the 200 EMA signals a possible trend reversal.
📌 Filtering Trades – Many traders only take long trades above and short trades below the 200 EMA to align with the overall market trend.
Conclusion:
The 200 EMA is an essential indicator for traders of all levels, offering clear trend direction, strong support/resistance zones, and trade filtering for better decision-making. Whether you're trading forex, stocks, or crypto, mastering the 200 EMA can give you a significant edge in the markets. 🚀📈

LRS-Strategy: 200-EMA Buffer & Long/Short Signals LRS-Strategy: 200-EMA Buffer & Long/Short Signals
This indicator is designed to help traders implement the Leveraged Return Strategy (LRS) using the 200-day Exponential Moving Average (EMA) as a key trend-following signal. The indicator offers clear long and short signals by analyzing the price movements relative to the 200-day EMA, enhanced by customizable buffer zones for increased precision.
Key Features:
200-Day EMA: The main trend indicator. When the price is above the 200-day EMA, the market is considered in an uptrend, and when it is below, it indicates a downtrend.
Customizable Buffer Zones: Users can define a percentage buffer around the 200-day EMA (default is 3%). The upper and lower buffer zones help filter out noise and prevent premature signals.
Precise Long/Short Signals:
Long Signal: Triggered when the price moves from below the lower buffer zone, crosses the 200-day EMA, and then breaks above the upper buffer zone.
Short Signal: Triggered when the price moves from above the upper buffer zone, crosses the 200-day EMA, and then breaks below the lower buffer zone.
Alternating Signals: Ensures that a new signal (long or short) is only generated after the opposite signal has been triggered, preventing multiple signals of the same type without a reversal.
Clear Visual Aids: The indicator displays the 200-day EMA and buffer zones on the chart, along with buy (long) and sell (short) signals. This makes it easy to track trends and time entries/exits.
How to Use:
Long Entry: Look for the price to move below the lower buffer, cross the 200-day EMA from below, and then break out of the upper buffer to confirm a long signal.
Short Entry: Look for the price to move above the upper buffer, cross below the 200-day EMA, and then break below the lower buffer to confirm a short signal.
This indicator is perfect for traders who prefer a structured, trend-following approach, using clear rules to minimize noise and identify meaningful long or short opportunities.

HTF Dynamic EMA Smoothing Indicator [CHE] with Kernel SelectionThe Dynamic EMA Smoothing Indicator with Kernel Selection is a powerful Pine Script indicator for TradingView designed to smooth moving averages and identify market trends more clearly. Here is a detailed description of its functionalities and settings:
Main Functions:
1. Time Period Display:
- Option to show or hide an info box displaying the current time period.
- Customizable info box: Users can adjust the size, position, and colors of the info box to suit their preferences.
2. Timeframe Type Selection:
- Auto Timeframe: Automatically calculates the best timeframe based on the current resolution.
- Multiplier: Allows using an alternate timeframe as a multiple of the current resolution.
- Manual Resolution: Users can manually set a specific timeframe.
3. Colors:
- Custom colors for various graphical elements, including EMA lines and signals.
4. Basic Settings:
- EMA and Signal Periods: Defines the periods for the exponential moving averages (EMA) and signal lines.
- Smoothing Length and Kernel Type: Allows selecting the smoothing length and the type of kernel used for weighting the EMAs.
- ATR Multiplier: Defines the multiplier for the ATR (Average True Range) to identify relevant price ranges.
5. EMA Calculations:
- The indicator calculates a weighted EMA using several methods like Linear, Exponential, Epanechnikov, Triangular, and Cosine kernels.
- Smoothing is achieved by adding and removing values in a float array that stores the EMA values.
6. Plotting EMA and Signal Lines:
- The indicator plots the smoothed EMA and signal lines on the chart. The line colors change according to the trend direction (green for uptrend, red for downtrend).
7. Trading Signals:
- Long Signals: An upward arrow is displayed when the smoothed EMA indicates an uptrend.
- Short Signals: A downward arrow is displayed when the smoothed EMA indicates a downtrend.
- Alert Conditions: Alerts are triggered when long or short signals are detected.
8. ATR Bands:
- The indicator shows upper and lower ATR bands to identify potential support and resistance zones.
9. Time Period Display on Chart:
- A table is used to display the selected time period on the chart when the corresponding option is enabled.
This indicator offers extensive customization and allows traders to conduct complex market analyses using smoothed EMAs and custom timeframes. The integration of various kernels for smoothing makes it a versatile tool adaptable to different trading strategies.

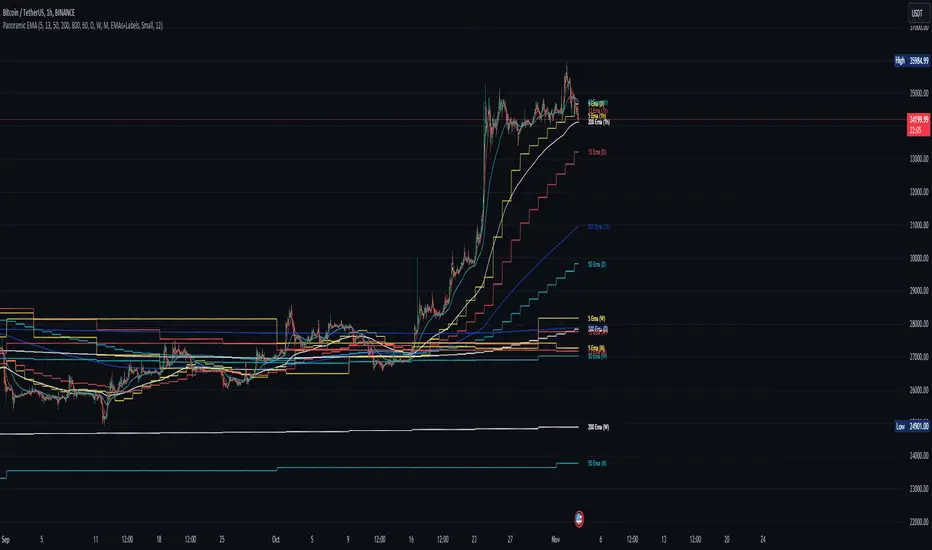
Panoramic EMA - Multi TimeframePanoramic EMA - Multi Timeframe
This indicator provides a straightforward visualization of Exponential Moving Averages (EMAs) from multiple timeframes simultaneously. This indicator allows traders to customize the display of EMAs, making it easier to identify and analyze trends and potential support or resistance levels across different periods.
Settings:
EMA Lengths: Customize up to five EMA lengths. Activating a length will display its EMA line on the chart for the selected timeframes.
Timeframes Selection: Choose up to four different timeframes to display the EMAs. This lets you observe how EMAs behave on various scales from a single chart.
Interpretation:
Utilize the EMAs as potential zones of dynamic support or resistance.
Observe the relationship between price action and EMAs across different timeframes to gauge market sentiment and identify trend consistency or potential shifts.
This tool is designed to offer visual clues about the market state through the behavior of EMAs. It does not generate direct buy or sell signals. It is recommended to understand how the assets you are trading interact with EMAs. For instance, in our example below, Bitcoin demonstrates a tendency to interact with the 800 and 200-length EMAs on the 4-hour timeframe, providing areas where price rejections may occur:
Note: This is a utility-focused indicator meant to supplement your market analysis and should be used in conjunction with other analysis methods or indicators for the best results.
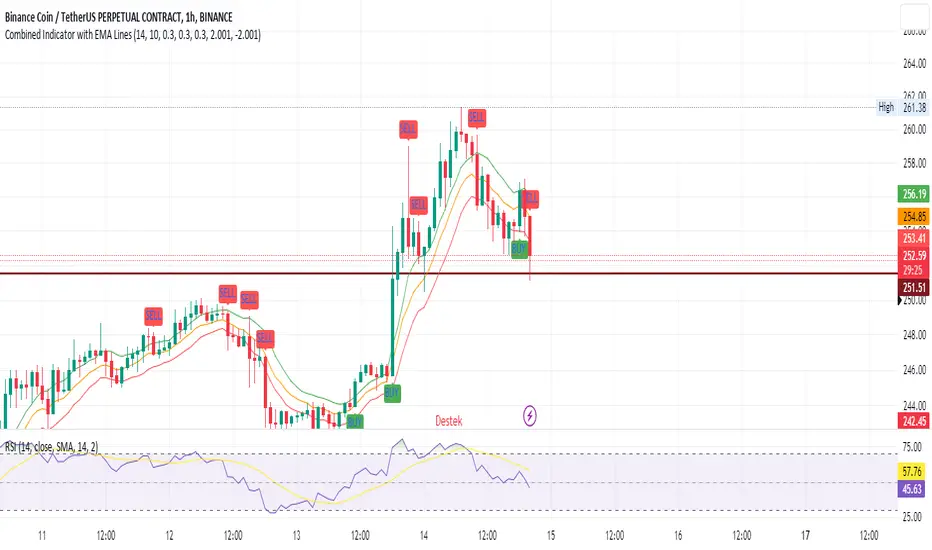
SEC-Combined Indicator with EMA LinesTitle: Combined Indicator with EMA Lines
Description:
The Combined Indicator with EMA Lines is a technical analysis tool that combines multiple indicators to provide insights into the market's strength and potential buying or selling opportunities. It incorporates the Relative Strength Index (RSI), Exponential Moving Average (EMA) lines, and the trend over the past three days to generate signals.
The indicator calculates a combined data value by assigning weights to the RSI, EMA, and past trend. The RSI measures the strength of price movements, while the EMA lines provide an indication of the average price over a specific period. The past trend considers the price behavior over the last three days. By combining these factors, the indicator offers a comprehensive view of market conditions.
Buy and sell signals are generated based on the change in the combined data. A buy signal occurs when there is an increase in the combined data above a specified threshold, indicating a potential buying opportunity. Conversely, a sell signal is triggered when there is a decrease in the combined data below a specified threshold, suggesting a potential selling opportunity.
The indicator also plots the EMA lines, which include the EMA High, EMA Average, and EMA Low. These lines provide additional visual cues about the price trend and potential support and resistance levels.
Traders can use the Combined Indicator with EMA Lines to identify potential entry and exit points in the market. It helps in capturing trends, evaluating price strength, and making informed trading decisions. The buy and sell signals, along with the EMA lines, aid in spotting potential reversals, confirming trends, and managing risk.
It's important to note that this indicator should be used in conjunction with other analysis techniques and risk management strategies. Traders should consider combining it with additional indicators, chart patterns, and fundamental analysis to enhance their trading decisions.
Remember to backtest and validate the indicator's performance using historical data before using it in real-time trading. Adjust the input parameters, such as RSI period, EMA period, and threshold values, to suit your trading style and market conditions.
3 Fib EMAs To Scalp Them AllThe "3 Fib EMAs To Scalp Them All" was made in order to clear up when we should look for shorts, longs, or walk away. Also it can alert you when a trend starts, or when there is a possible reversal. I use it for scalping/day trading in 5m-1h timeframes.
1. EMAs: By default, the indicator uses Fibonacci numbers (21, 55, 233), but you can change them.
2. Color Changes: The color of the Micro EMA line changes depending on its relation to the Mid and Macro EMAs.
When Micro EMA < Mid < Macro EMA, it turns red, indicating a potential bearish trend - that's when you should look for shorts
When Micro EMA > Mid > Macro EMA, it turns green, indicating a potential bullish trend - that's when you should look for longs
A white Micro EMA is when you need to take some rest, enjoy your coffee, and avoid overtrading.
3. Signals: The indicator provides visual signals in the form of diamonds and crosses and corresponding alert signals.
A red diamond above the bar signals a potential beginning of a downtrend
A red cross above the bar signals the end of the downtrend and can be used as a signal for a possible reversal up/breakout.
A green diamond below the bar signals a potential beginning of a downtrend,
A green cross below the bar signals the end of the uptrend and can be used as a signal for a possible reversal down/breakout.
4. Alerts: For algo traders and people who prefer to stay away from the monitor... there are alerts for every signal.
Friendly note: Don't blindly follow the signals for your long and short entries. The signals only pop up when the EMA cross value gets a confirmation. A smart move would be to wait for a retracement to the EMA line and use momentum indicators like market cipher B to pinpoint those ideal entry points.
