ค้นหาในสคริปต์สำหรับ "ema"

EMA CloudEMA Cloud
Description
EMA Cloud is a clean, highly customizable indicator that visualizes the relationship between 8-period and 21-period moving averages as a dynamic cloud overlay. Perfect for identifying trends, momentum shifts, and potential entry/exit zones at a glance.
🔑 Key Features
Dual EMA Support – Choose between EMA or SMA for both moving averages
Visual Cloud Overlay – Shaded cloud between EMA 8 and EMA 21 with customizable colors:
🟢 Bullish Cloud (green) when EMA 8 > EMA 21
🔴 Bearish Cloud (red) when EMA 8 < EMA 21
Adjustable Parameters – Customize EMA lengths, line widths, and cloud transparency
Toggle Display Options – Show/hide the cloud or EMA lines independently
Comprehensive Alert System – Get notified on:
EMA 8 crossing above/below EMA 21
Price crossing above/below EMA 8
Price crossing above/below EMA 21
📈 How to Use
Trend Identification – Green cloud indicates bullish momentum; red cloud signals bearish momentum
Entry Signals – Look for cloud color changes (crossovers) as potential entry points
Support/Resistance – The EMA lines within the cloud can act as dynamic support/resistance levels
Confirmation Tool – Combine with price action or other indicators for confluence
⚙️ Settings
Setting Description
EMA Type EMA or SMA
EMA 8 & 21 Length Customizable period lengths
Cloud Transparency Adjust opacity (0-100%)
Line Width Thickness of EMA lines
Colors Fully customizable bullish/bearish colors
Alerts 6 configurable alert conditions
💡 Best Practices
Works on all timeframes and all assets (stocks, forex, crypto, futures)
Lower timeframes: Use for scalping and intraday trades
Higher timeframes: Ideal for swing trading and trend following
Combine with volume analysis for stronger signals

EMA Dynamic Crossover Detector with Real-Time Signal TableDescriptionWhat This Indicator Does:This indicator monitors all possible crossovers between four key exponential moving averages (20, 50, 100, and 200 periods) and displays them both visually on the chart and in an organized data table. Unlike standard EMA indicators that only plot the lines, this tool actively detects every crossover event, marks the exact crossover point with a circle, records the precise price level, and maintains a running log of all crossovers during the trading session. It's designed for traders who want comprehensive EMA crossover analysis without manually watching multiple moving average pairs.Key Features:
Four Essential EMAs: Plots 20, 50, 100, and 200-period exponential moving averages with color-coded thin lines for clean chart presentation
Complete Crossover Detection: Monitors all 6 possible EMA pair combinations (20×50, 20×100, 20×200, 50×100, 50×200, 100×200) in both directions
Precise Price Marking: Places colored circles at the exact average price where crossovers occur (not just at candle close)
Real-Time Signal Table: Displays up to 10 most recent crossovers with timestamp, direction, exact price, and signal type
Session Filtering: Only records crossovers during active trading hours (10:00-18:00 Istanbul time) to avoid noise from low-liquidity periods
Automatic Daily Reset: Clears the signal table at the start of each new trading day for fresh analysis
Built-In Alerts: Two alert conditions (bullish and bearish crossovers) that can be configured to send notifications
How It Works:The indicator calculates four exponential moving averages using the standard EMA formula, then continuously monitors for crossover events using Pine Script's ta.crossover() and ta.crossunder() functions:Bullish Crossovers (Green ▲):
When a faster EMA crosses above a slower EMA, indicating potential upward momentum:
20 crosses above 50, 100, or 200
50 crosses above 100 or 200
100 crosses above 200 (Golden Cross when it's the 50×200)
Bearish Crossovers (Red ▼):
When a faster EMA crosses below a slower EMA, indicating potential downward momentum:
20 crosses below 50, 100, or 200
50 crosses below 100 or 200
100 crosses below 200 (Death Cross when it's the 50×200)
Price Calculation:
Instead of marking crossovers at the candle's close price (which might not be where the actual cross occurred), the indicator calculates the average price between the two crossing EMAs, providing a more accurate representation of the crossover point.Signal Table Structure:The table in the top-right corner displays four columns:
Saat (Time): Exact time of crossover in HH:MM format
Yön (Direction): Arrow indicator (▲ green for bullish, ▼ red for bearish)
Fiyat (Price): Calculated average price at the crossover point
Durum (Status): Signal classification ("ALIŞ" for buy signals, "SATIŞ" for sell signals) with color-coded background
The table shows up to 10 most recent crossovers, automatically updating as new signals appear. If no crossovers have occurred during the session within the time filter, it displays "Henüz kesişim yok" (No crossovers yet).EMA Color Coding:
EMA 20 (Aqua/Turquoise): Fastest-reacting, most sensitive to recent price changes
EMA 50 (Green): Short-term trend indicator
EMA 100 (Yellow): Medium-term trend indicator
EMA 200 (Red): Long-term trend baseline, key support/resistance level
How to Use:For Day Traders:
Monitor 20×50 crossovers for quick entry/exit signals within the day
Use the time filter (10:00-18:00) to focus on high-volume trading hours
Check the signal table throughout the session to track momentum shifts
Look for confirmation: if 20 crosses above 50 and price is above EMA 200, bullish bias is stronger
For Swing Traders:
Focus on 50×200 crossovers (Golden Cross/Death Cross) for major trend changes
Use higher timeframes (4H, Daily) for more reliable signals
Wait for price to close above/below the crossover point before entering
Combine with support/resistance levels for better entry timing
For Position Traders:
Monitor 100×200 crossovers on daily/weekly charts for long-term trend changes
Use as confirmation of major market shifts
Don't react to every crossover—wait for sustained movement after the cross
Consider multiple timeframe analysis (if crossovers align on weekly and daily, signal is stronger)
Understanding EMA Hierarchies:The indicator becomes most powerful when you understand EMA relationships:Bullish Hierarchy (Strongest to Weakest):
All EMAs ascending (20 > 50 > 100 > 200): Strong uptrend
20 crosses above 50 while both are above 200: Pullback ending in uptrend
50 crosses above 200 while 20/50 below: Early trend reversal signal
Bearish Hierarchy (Strongest to Weakest):
All EMAs descending (20 < 50 < 100 < 200): Strong downtrend
20 crosses below 50 while both are below 200: Rally ending in downtrend
50 crosses below 200 while 20/50 above: Early trend reversal signal
Trading Strategy Examples:Pullback Entry Strategy:
Identify major trend using EMA 200 (price above = uptrend, below = downtrend)
Wait for pullback (20 crosses below 50 in uptrend, or above 50 in downtrend)
Enter when 20 re-crosses 50 in the trend direction
Place stop below/above the recent swing point
Exit when 20 crosses 50 against the trend again
Golden Cross/Death Cross Strategy:
Wait for 50×200 crossover (appears in the signal table)
Verify: Check if crossover occurs with increasing volume
Entry: Enter in the direction of the cross after a pullback
Stop: Place stop below/above the 200 EMA
Target: Swing high/low or when opposite crossover occurs
Multi-Crossover Confirmation:
Watch for multiple crossovers in the same direction within a short period
Example: 20×50 crossover followed by 20×100 = strengthening momentum
Enter after the second confirmation crossover
More crossovers = stronger signal but also means you're entering later
Time Filter Benefits:The 10:00-18:00 Istanbul time filter prevents recording crossovers during:
Pre-market volatility and gaps
Low-volume overnight sessions (for 24-hour markets)
After-hours erratic movements

EMA Sniper – Precision Trading with EMA 21/50Title: EMA Sniper – Precision Trading with EMA 21/50
Description:
🚀 EMA Sniper is a powerful trading tool designed to identify trend shifts with precision using the EMA 21/50 crossover, while also displaying Stop Loss (SL) and Take Profit (TP) levels directly on the chart.
🔹 Features:
✅ EMA 21/50 Crossover Signals – Buy signals appear when EMA 21 crosses above EMA 50, and sell signals appear when EMA 21 crosses below EMA 50.
✅ Smart Stop Loss & Take Profit – SL is dynamically placed below/above EMA 50 for optimized risk management, while TP follows a 2:1 risk/reward ratio.
✅ Clear Visual Alerts – The indicator plots SL and TP levels as lines on the chart, along with buy and sell markers for quick decision-making.
✅ Multi-Market & Multi-Timeframe – Works across forex, crypto, stocks, and indices on any timeframe.
🚀 Perfect for traders looking for a structured approach to trend-based trading!
Let me know if you’d like any modifications! 🔥

EMA Envelope - Signal with Stoploss and Takeprofit LevelsDescription:
This Pine Script indicator implements the EMA Envelope strategy, which utilizes Exponential Moving Averages (EMA) to create an envelope around the price chart. The strategy generates buy and sell signals based on the crossing of the price above and below the upper and lower EMA envelopes, respectively. It also incorporates additional features such as stop-loss and take-profit levels for risk management.
Indicator Settings:
EMA Length: Specifies the period for the short-term Exponential Moving Average.
Long Term EMA Length: Defines the period for the long-term Exponential Moving Average used for signal filtering.
Take Profit Ratio: Determines the ratio for calculating the take-profit levels based on the stop-loss.
Filter Signal on Long Term EMA: Enables or disables the filtering of buy/sell signals using the long-term EMA.
Show only recent signal: When enabled, shows only the most recent buy/sell signals.
Buy and Sell Signals:
The indicator generates buy signals when the price crosses above the upper EMA envelope and the previous low was below the upper EMA envelope. Additionally, you can choose to filter buy signals based on whether the closing price is above the long-term EMA.
Conversely, sell signals are generated when the price crosses below the lower EMA envelope, and the previous high was above the lower EMA envelope. Similar to buy signals, sell signals can also be filtered using the long-term EMA.
Note: Signal works well on Higher Timeframes like Daily/8hrs/4hrs/1hr.
Stop-Loss and Take-Profit Levels:
For buy signals, the stop-loss is set at the lower EMA level, while the take-profit level is calculated by adding a specified ratio of the difference between the low and the stop-loss level to the low price.
For sell signals, the stop-loss is set at the upper EMA level, and the take-profit level is calculated by subtracting a specified ratio of the difference between the stop-loss level and the high price from the high price.
Disclaimer:
This indicator is provided for educational and informational purposes only. Trading involves significant risk, and past performance does not guarantee future results. Users are solely responsible for their trading decisions and should conduct their own research and risk management. The author shall not be held liable for any losses or damages arising from the use of this indicator.
Note: Always test the indicator thoroughly on historical data and consider paper trading before applying it to live trading environments.

EMA Trend Buy sell strategyThis strategy is built to help investors get into a trend safely and smartly — without rushing and without getting in and out too often.
When to Buy:
First Signal – Small Step In (50% Buy)
When the short-term trend (EMA 18) turns positive and goes above the medium trend (EMA 33),
👉 we buy half of our planned position.
This is an early warning that a new upward trend might be starting.
Second Signal – Full Confidence (Buy other 50%)
If the medium-term trend (EMA 33) also crosses above the long-term (EMA 50),
👉 we buy the other half of the position.
Now we’re more confident that the trend is real.
When to Sell:
First Warning – Reduce Position (Sell 50%)
If EMA 33 falls below EMA 50,
👉 we sell half of the position to reduce risk.
Trend Reversal – Exit Completely (Sell the rest)
If EMA 18 also falls below EMA 33,
👉 we sell the remaining half and leave the trade fully.
Why This Strategy?
📉 We don’t jump in all at once.
→ We wait for confirmation before going full in.
⏳ We stay in the trade as long as the trend is healthy.
→ No overtrading or reacting to small moves.
📊 We get out slowly, not suddenly.
→ This helps protect profits and avoid emotional decisions.

EMA Crossover PredictionThis indicator predicts potential EMA crossovers by analyzing the rate of change between short and long EMAs. It calculates future EMA values based on current trends and displays predicted crossover points with their estimated timeframe and price level. The script uses customizable periods for both EMAs and forecast length, making it adaptable for different trading timeframes. Green labels indicate predicted bullish crossovers (short EMA crossing above long EMA), while red labels show bearish crossover predictions (short EMA crossing below long EMA).

EMA - Baby WhaleThis script will show you the 8, 13, 21, 55, 100 and 200 EMA .
You can change the colors yourself if you want.
You can use the EMA to define the trend.
A good strategy that traders use is a 55 EMA crossover.
This means that when the 8, 13 and 21 all cross the 55 EMA you place a buy or sell order.
You close your position when the same thing happens on the other side.
Another great way that traders use these EMA's is to spot a Golden or Death cross.
When the 55 and 200 EMA cross and the 200 becomes support it means we're in a uptrend and vice versa.
If you want access, just send a message please.
Much love from Baby Whale!!
🙏❤️🐳

EMA 8/21/50 + VWAP Crossover Alert IndicatorOverview of the Indicator
This is a custom Pine Script v5 indicator for TradingView titled "EMA 8/21/50 + VWAP Crossover Alert Indicator" (short title: "EMA+VWAP Cross Alert"). It's designed as an overlay indicator, meaning it plots directly on your price chart rather than in a separate pane. The primary purpose is to detect and alert on crossovers between the 8-period Exponential Moving Average (EMA) and the 21-period EMA, which can signal potential bullish or bearish momentum shifts. These are classic short-term trend reversal or continuation signals often used in trading strategies like momentum or swing trading.
To enhance analysis, it also includes:
A 50-period EMA for medium-term trend context (e.g., to confirm if the overall trend aligns with the crossover).
A Volume Weighted Average Price (VWAP) line, which provides a benchmark for the average price weighted by volume, useful for identifying intraday value areas or fair price levels.
The indicator works across all timeframes (e.g., Daily, 4H, 1H, 15M, 5M, 3M) because the calculations are based on the chart's current bars and adapt to volatility and data resolution. It's not a trading strategy (no entry/exit logic or backtesting), but an alert tool—signals are visual and can trigger notifications in TradingView. Always combine it with risk management, as crossovers can produce false signals in ranging or choppy markets.

EMA and EMA Spread studyBased on initial setup from rludvik ()
- Focussed on EMA for this script
- Added the ema as input parameters, so updating the pinescript everytime isn't needed
- also added a second ema to it, to make it easier to study/compare 2 sets of emaspread
I will publish this open, if you make your own improved version of it, please let me know :-)

EMA with Adaptive Straight SegmentsThis script transforms a traditional Exponential Moving Average (EMA) into a series of straight-line segments, making trend direction clearer and easier to follow. Instead of plotting every curve of the EMA, it connects key points with angled steps, giving a trend-line style look that removes noise and highlights slope.
What makes this version special is its adaptive segmentation:
Segment length automatically adjusts based on market volatility (ATR%).
In low volatility, segments stretch longer to smooth things out.
In high volatility, segments shorten to stay responsive to price swings.
Features:
Clean, step-style EMA representation.
Adjustable minimum/maximum segment lengths.
Customisable number of historical segments.
Optional display of the original EMA for comparison.
HUD label showing current ATR%, segment length, and segment count.
This tool is especially useful if, like me, you prefer structural analysis over noisy indicators. It keeps your chart tidy while still reflecting the true slope of the EMA. I find 50 and 200 are the most useful.

EMA 4 => 30Min & 1Hi use this script in 1h and 30min chart with this setting:
ema 6, ema 12, ema 18 & ema 24 and use adx and di, macd and cci indicator to get confirmation.
EMA RaaIf you trade index options / futures intraday:
5 EMA → Entry timing
20 EMA → Trend pullback
50 EMA → Regime filter

EMA 10/20 Crossover BackgroundThis script works best on a weekly chart and it taints the background green if the EMA-10 is larger than EMA-20 (EMA lengths can be configured) and red otherwise. I use this script to immediately determine if a market is trending upwards or downwards.

EMA x5A simple script involving exponential moving averages. It draws on 5 customizable lookback periods for the EMA and draws it on the chart. From backtesting, periods of confluence between all of the exponential moving averages lead to trades with an increased probability of working out. I have also taken the liberty and added the feature of including higher timeframe comparisons on the same chart. For example, you can choose to draw a 50-period 4-hour EMA on your 5-minute chart if you are an intraday trader. This might holistically help with your analysis by having the data on a single chart. This indicator also helps traders who are using the free or pro versions of TradingView and want to use 5 EMA's but TradingView's indicator count does not allow that many.
I have also made the script open source for anyone looking to reference code.

EMA Cross Fast/Slow/SignalInspired by EMA CrossOver Bars, this includes a third EMA that we are looking to cross. It also plots the EMA's on the chart.
EMA StrategyThis strategy is in testing and development.
**USE AT YOUR OWN RISK. **
This defaults to a 13/48 EMA using the closing price. When the fast EMA crosses above the slow it triggers a buy. When it crosses below the slow EMA it triggers a sell and potentially a short, but that is not implemented. Stops, trailing stops, and pyramiding to be added. The purpose of this strategy is to signal recommended entry and exit point and back test whether the strategy works. It is not intended to be an automated buy/sell script.
* stop loss added. Not yet configurable from the settings panel. Defaults to 8% from the entry price.
TODO:
Add the ability to configure the stop-loss level in the settings panel
Add trailing stop functionality
Add profit taking, likely configurable sell targets (2:1 risk to reward gain for example)
Add another signal or two to help improve odds of making a winning trade.

EMA+MACD+RSI+StochJust like SMA but EMA!
this EMA base indicator helps you to find the trend.
use pivot point standard for make better decesion on Long and Short
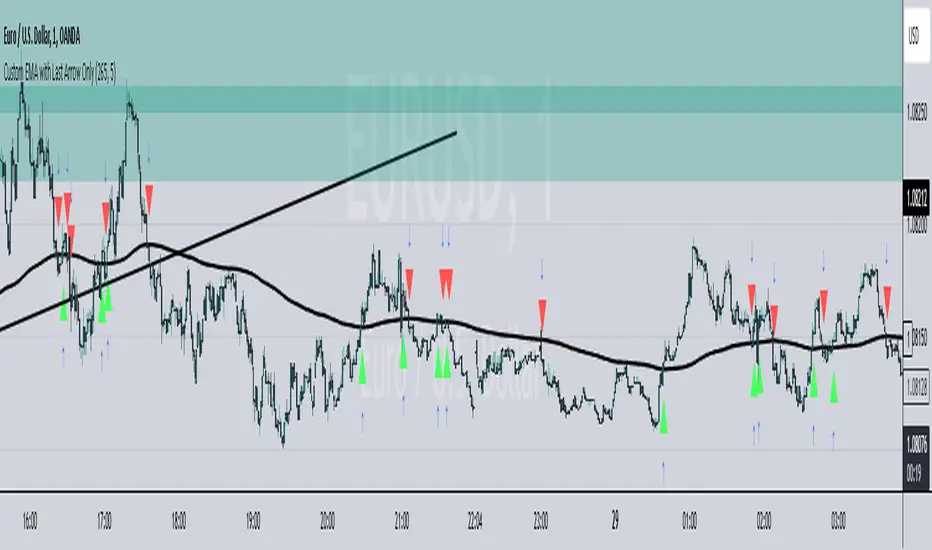
EMA LavtiThis TradingView Pine Script indicator displays a smoothed Exponential Moving Average (EMA) line along with a single arrow to indicate the last confirmed crossing event. The indicator highlights either a "Buy" or "Sell" signal based on price action relative to the smoothed EMA.
How It Works:
The script tracks the index and direction (up or down) of the last crossover event.
When no new crossing event occurs, the script resets to avoid plotting multiple arrows.
The smoothed EMA line is plotted on the chart to give context for the crossover signals.
EMA Bounce StrategySimple strategy that checks for price bounces over an Exponential Moving Average. If the CLOSE of the candle bounces
back from having it's LOW below the EMA then it's a Bull Bounce. If the CLOSE of the candle bounces down from having it's
high above the EMA then it's a Bear Bounce. This logic can be reversed.

EMAS X-FACTORindicador que nos simplifica la utilización de las EMAS 8,18 y 200 que utilizaremos para confirmar las entradas de las operaciones. Las EMAS o Medias Móviles Exponenciales nos muestra el valor medio del precio de un instrumento durante un determinado período de tiempo, es decir nos marcan la tendencia momentánea y la tendencia larga.

EMAs from higher TFPlot EMAs based on the higher timeframe.
Ex. If you're looking at 15 min chart, you'll see EMAs from H1 TF.

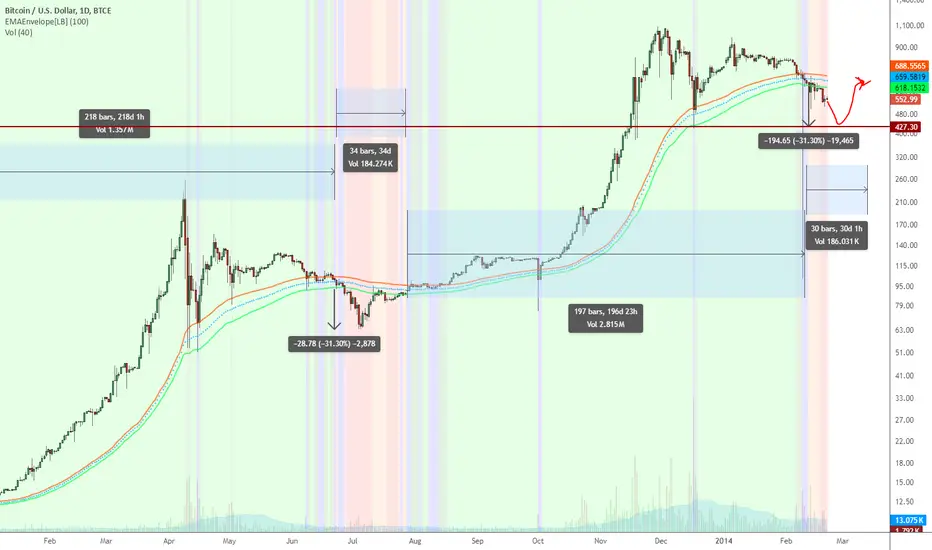
EMA Enveloper Indicator & a crazy predictionEMAEnvelope indicator does just that, draws a nice user-defined period EMA envelope (overlay).
It also can highlight the Bull/Bear breaks using different colors
- Green : High > EMA_HIGH
- Lime : (High > EMA_HIGH) and (Low > EMA_HIGH)
- Orange : Low < EMA_LOW
- Red : (Low < EMA_LOW) and (High < EMA_LOW)
Background highlighting is user-configurable.
Now to the (crazy) prediction: Based on a 100-period EMAEnvelope, we may have to go down to ~427.3 before starting turning Green. Look at the 2 Orange/Red areas highlighted.
EMA 200 tells us a different story, BTW.