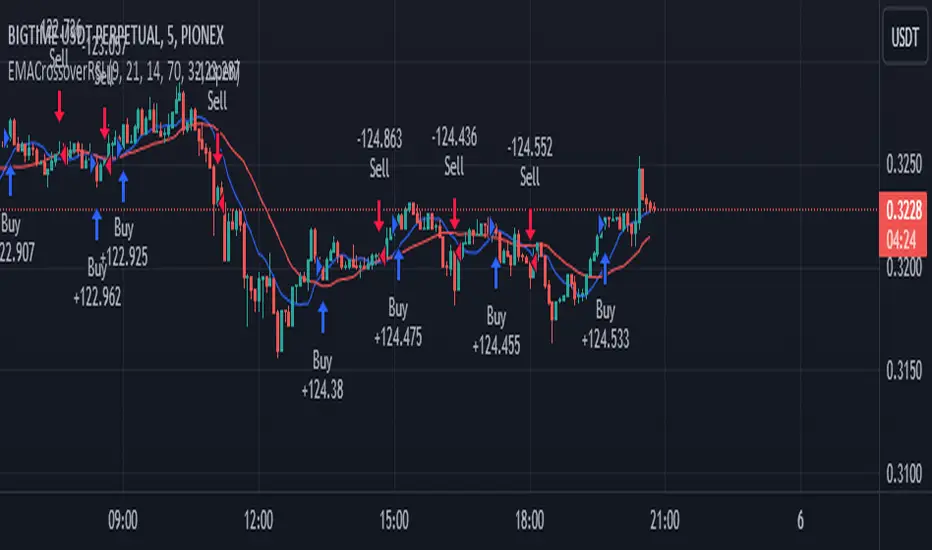
EMA Crossover Strategy with RSI Filter BIGTIME 5mThis script essentially creates a trading strategy that goes long when there is an EMA crossover, but only if the RSI is below a certain overbought level. It goes short when there is an EMA crossunder, but only if the RSI is above a certain oversold level. The moving averages are plotted on the chart for visual reference.
SCALPING 5m
Pairs: BIGTIME/USDT--- API3/USDT---BAKE/USDT--- ZIL/USDT
ค้นหาในสคริปต์สำหรับ "ema"
JS-TechTrading: Supertrend-Strategy_Basic versionAre you looking for a reliable and profitable algorithmic trading strategy for TradingView? If so, you might be interested in our Supertrend basic strategy, which is based on three powerful indicators: Supertrend (ATR), RSI and EMA.
Supertrend is a trend-following indicator that helps you identify the direction and strength of the market. It also gives you clear signals for entry and exit points based on price movements.
RSI is a momentum indicator that measures the speed and change of price movements. It helps you filter out false signals and avoid overbought or oversold conditions.
EMA is a moving average indicator that smooths out price fluctuations and shows you the long-term trend of the market. It helps you confirm the validity of your trades and avoid trading against the trend.
Our Supertrend basic strategy combines these three indicators to give you a simple yet effective way to trade any market. Here's how it works:
- For long trades, you enter when the price is above Supertrend and pulls back below it (the low of the candle crosses Supertrend) and then rebounds above it (the high of the next candle goes above the pullback candle). You exit when the price closes below Supertrend or when you reach your target profit or stop loss.
- For short trades, you enter when the price is below Supertrend and pulls back above it (the high of the candle crosses Supertrend) and then drops below it (the low of the next candle goes below the pullback candle). You exit when the price closes above Supertrend or when you reach your target profit or stop loss.
- You can also use RSI and EMA filters to improve your results. For long trades, you only enter if RSI is above 50 and price is above 200 EMA. For short trades, you only enter if RSI is below 50 and price is below 200 EMA.
- You can set your stop loss and target profit as a percentage of your entry price or based on other criteria. You can also adjust the parameters of each indicator according to your preferences and risk tolerance.
Our Supertrend basic strategy is easy to use and has been tested on various markets and time frames. It can help you capture consistent profits while minimizing your losses.

ATR Mean Reversion Strategy V1**Long Only Strategy**
When Price drops below the ATR band below it will enter a buy on the next candle open
SL at current price minus ATR* ATR multiplier
TP at Mean EMA or if higher than Mean EMA and current candle low is below previous candle low or if price is above ATR
NB: I would highly recommend a low fee broker (I use ICmarkets raw spread account) due to the fact that this is a decently high frequency trading strategy you will rack up a lot of commission, if you use and exchange like Bybit or Binance the strategy will not be profitable due to the high commissions.

SSL + Wave Trend StrategyStrategy incorporates the following features:
Risk management:
Configurable X% loss per stop loss
Configurable R:R ratio
Trade entry:
Based on strategy conditions below
Trade exit:
Based on strategy conditions below
Backtesting:
Configurable backtesting range by date
Trade drawings:
Each entry condition indicator can be turned on and off
TP/SL boxes drawn for all trades. Can be turned on and off
Trade exit information labels. Can be turned on and off
NOTE: Trade drawings will only be applicable when using overlay strategies
Alerting:
Alerts on LONG and SHORT trade entries
Debugging:
Includes section with useful debugging techniques
Strategy conditions
Trade entry:
LONG
C1: SSL Hybrid baseline is BLUE
C2: SSL Channel crosses up (green above red)
C3: Wave Trend crosses up (represented by pink candle body)
C4: Entry candle height is not greater than configured threshold
C5: Entry candle is inside Keltner Channel (wicks or body depending on configuration)
C6: Take Profit target does not touch EMA (represents resistance)
SHORT
C1: SSL Hybrid baseline is RED
C2: SSL Channel crosses down (red above green)
C3: Wave Trend crosses down (represented by orange candle body)
C4: Entry candle height is not greater than configured threshold
C5: Entry candle is inside Keltner Channel (wicks or body depending on configuration)
C6: Take Profit target does not touch EMA (represents support)
Trade exit:
Stop Loss: Size configurable with NNFX ATR multiplier
Take Profit: Calculated from Stop Loss using R:R ratio
Credits
Strategy is based on the YouTube video "This Unique Strategy Made 47% Profit in 2.5 Months " by TradeSmart.
It combines the following indicators to determine trade entry/exit conditions:
Wave Trend: Indicator: WaveTrend Oscillator by @LazyBear
SSL Channel: SSL channel by @ErwinBeckers
SSL Hybrid: SSL Hybrid by @Mihkel00
Keltner Channels: Keltner Channels Bands by @ceyhun
Candle Height: Candle Height in Percentage - Columns by @FreeReveller
NNFX ATR: NNFX ATR by @sueun123

TTP Kent Strat PROKent Strat PRO trades breakouts using Bollinger Bands together with SuperTrend.
PRO features:
- 3commas bot alerts for long/short bots
- Custom JSON bots alerts
Features:
- Risk/reward ratio parameter
- Longs, shorts and combined positions.
- Breakout settings
- Trailing SL, trailing TP
- Use of latest candles to place the SL using a lookback parameter (how many candles to look back for a low/high price)
- Select your SL between the ATR trendline and the latest candle: the closest or furthest away value
- Show the trendline
- Backtest mode for accurate backtests
- Signal mode for live price accurate signals
- Date range backtesting
Filters:
- EMA 200 filter and timeframe selector. This filter can be used to trade with the trend: open longs on an uptrend and shorts on a downtrend.
- ADX filter using threshold. This filter can be used to filter entries where the trend is not very strong.
- ADX pointing up. ADX values pointing up and above certain threshold can improve entries.
- Relative volume filter based on the volume being X% above the MA of the Volume. Trading with volume can help filtering out bad trades.
Example setup:
1) pick BINANCE:ETHUSDT chart, 15 min chart
2) trade longs + shorts
3) pick ratio 3
4) trailing SL checked
5) trailing TP unchecked
7) stop loss "furthest"
8) candle loopback 30
9) BB period 21, dev 1, ATR filter on, atr period 5
10) EMA filter on, 15 min
11) ADX off
12) Volume filter on set to 60%

TTP Kent StratKent Strat trades breakouts using Bollinger Bands together with SuperTrend.
Features:
- Risk/reward ratio parameter
- Longs, shorts and combined positions.
- Breakout settings
- Trailing SL, trailing TP
- Use of latest candles to place the SL using a lookback parameter (how many candles to look back for a low/high price)
- Select your SL between the ATR trendline and the latest candle: the closest or furthest away value
- Show the trendline
- Backtest mode for accurate backtests
- Signal mode for live price accurate signals
- Date range backtesting
Filters:
- EMA 200 filter and timeframe selector. This filter can be used to trade with the trend: open longs on an uptrend and shorts on a downtrend.
- ADX filter using threshold. This filter can be used to filter entries where the trend is not very strong.
- ADX pointing up. ADX values pointing up and above certain threshold can improve entries.
- Relative volume filter based on the volume being X% above the MA of the Volume. Trading with volume can help filtering out bad trades.
Example setup:
1) pick BINANCE:ETHUSDT chart, 15 min chart
2) trade longs + shorts
3) pick ratio 3
4) trailing SL checked
5) trailing TP unchecked
7) stop loss "furthest"
8) candle loopback 30
9) BB period 21, dev 1, ATR filter on, atr period 5
10) EMA filter on, 15 min
11) ADX off
12) Volume filter on set to 60%

EMA RSI ADX Scalping StrategyThis is the strategy version of my ERA Indicator. You can check my scripts if you'd like to use only study indicator.
Strategy Rules For Long Entry:
- Check if price above the set EMA (Can disable this rule if you'd like in the settings)
- RSI is in Oversold
- ADX is above set "Trend Ready" threshold (Meaning there is a trend going on)
- Price must approve the trend of previous candles. This is bullish for buy entries and bearish for sell entries.
- Enter with stop loss below last swing low with 1:1 or 1.5:1 take profit ratio.
Strategy Rules For Short Entry:
- Check if price below the set EMA (Can disable this rule if you'd like in the settings)
- RSI is in Overbought
- ADX is above set "Trend Ready" threshold (Meaning there is a trend going on)
- Price must approve the trend of previous candles. This is bullish for buy entries and bearish for sell entries.
- Enter with stop loss above last swing high with 1:1 or 1.5:1 take profit ratio. (Can be adjusted)
Features:
- You can modify a lot values to your liking.
- Choose Fixed or Trailing Stop Loss / Take Profit with detailed modifiers.
- You can connect it to bots if you'd like.
- It does NOT repaint.
- Since it's a scalping strategy recommended to use on 15 min or below timelines.
- Choose if you want to stop entry on opposite signals.
- And some other things i may not remember right now...
I tried to code this as modifiable as possible. Let me know if there are any problems you encounter. Open to suggestions as well.
Happy Trading.

GEMA-Estrategia por neil-------------------
DESCRIPTION
GEMA-STRATEGY is a strategy generator based on SMA, EMA, WMA, RMA that considers elements such as ADX, DMI, RSI, stochastic, Stoploss, Takeprofit, angles and values at present point.
HOW DOES IT WORK
The component works as an assistant to which you configure the previous elements and you see the performance that it offers you, in such a way that you pass that configuration to GEMA-INDICATOR so that you can receive alerts and do visual trading with notifications or automated trading by sending messages to platforms like 3Commas.
WHY USE IT
The resource operates with one of the most important strategies in the market, which is the price tracking line, which means that if prices go up, we follow it, if prices go down, we follow it; in this way you do not need to make large investments as is often the case with pure BOTs, which require large reserves for security orders.
HOW TO USE IT
Press the "Indicators" option, go to the "Public Library" segment, write the name "GEMA-Estategia por Neil", double click on the record in question and you will have it added in your work panel, now, it only remains to use it and configure its parameters.
-------------------
DESCRIPCIÓN
GEMA-ESTRATEGIA en un generador de estrategias basado en SMA, EMA, WMA, RMA que considera elementos como ADX, DMI, RSI, Estocastico, Stoploss, Takeprofit, ángulos y valores a punto presente.
COMO FUNCIONA
El componente funciona como un asistente al que vas configurando lo elementos anteriores y vas viendo el rendimiento que te ofrece, de manera tal, que pases esa configuración a GEMA-INDICADOR para que puedas recibir alertas y hagas trading visual con notificaciones o trading automatizado enviando mensajes a plataformas como 3Commas.
POR QUÉ USARLO
El recurso opera con una de las estrategias mas importantes del mercado, que es la linea de seguimiento de precio, lo que significa que si los precios suben, lo seguimos, si los precios bajan, lo seguimos; de esta manera no necesita realizar grandes inversiones como suele ocurrir con los BOT puros, que exigen grandes reservas para las ordenes de seguridad.
COMO USARLO
Presione la opción "Indicadores", ubíquese en el segmento "Libreria Publica", escriba el nombre "GEMA-Estrategia por Neil", haga doble clic sobre el registro en cuestión y lo tendrá agregado en su panel de trabajo, ahora, solo resta usarlo y configurar sus paramertos.

Vin's Playzone Strategy How it works
Playzone is a very simple system, utilizing just two exponential moving
averages. The 'Zones' in which different 'actions' should be taken is
highlighted with different colors on the chart. Calculations for the zones
are based on the relative position of price to the two EMA lines and the
relationship between the two EMAs
How to use
The basic method for using Playzone is to follow the green/red color.
Buy when bar closes in green.
Sell when bar closes in red.
Using it this way is safe but slow and is expected to have around 35-40%
accuracy, while yielding around 2-3 profit factors. The system works best
on larger time frames.
The more advanced method uses the zones to switch between different
trading system and biases, or in conjunction with other indicators.
example 1:
Buy when Yellow-Green and Bullish Divergence between price and RSI is visible,
if not Buy on Green and vise-versa
example 2:
Set up a long-biased grid and trade long only when actionzone is in green
change the bias to short when actionzone turns to te bearish side(red)
(Look at colors on a larger time frame)
"We let the market tell us what to do, Not to outguess what the market gonna do."

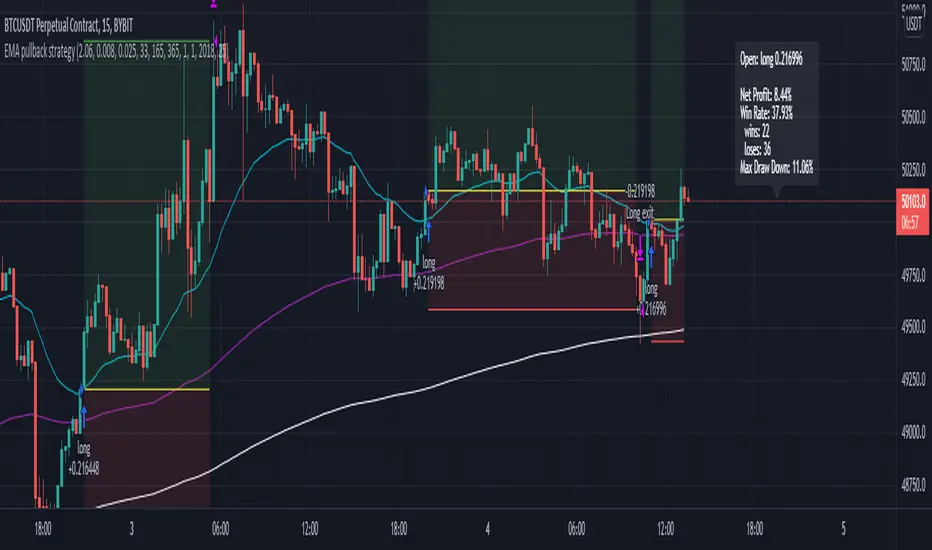
EMA pullback strategyA solid EMA pullback strategy for cryptos 15 min chart that uses EMA crossing as signal and pullback as stop loss.
EMA1: shortest period for finding crossing (I find period = 33 profitable for BTCUSD, you can adjust it for other cryptos)
EMA2: 5x period of EMA1, for filtering out some trend reversals
EMA3: 11x period of EMA1, for determining trend direction
Rules are:
Long:
close price > EMA3
EMA1 > EMA3
close price pullbacks below EMA1 and then crosses up EMA1, enter at the first close price above EMA1
lowest pullback close price < EMA2 at the cross up
Short:
close price < EMA3
EMA1 < EMA3
close price pullbacks above EMA1 and then crosses down EMA1, enter at the first close price below EMA1
highest pullback close price > EMA2 at the cross down
Stop-loss at lowest/highest pullback price for long/short
Take profit = 2x stop-loss
Risk management: risk range can be set in the inspector. If the risk is lower than the range, the trade is not taken. if the risk is higher than the range, the position size is adjusted to keep the risk within range.
Vegas Tunnel strategyApply Vegas Tunnel,
Use EMA144 169 as medium-term trend support
Also use EMA 576 676 and 4 multiples of 144 and 169 as long-term support and trend direction
Also increase EMA 36 43 as a short-term trend support
Suitable for stocks, indices, commodities
The applicable time scale can back-test the usability of the strategy by itself, and select the most applicable target
Introduction to current trading strategy:
According to the trend, the price will enter the market when it touches the support of each stage. When it touches the bollinger bands, it is Squeeze. Hold until it leaves the bollinger bands
But the trading strategy can be more optimized, see the code for details

EMA Slope Cross Trend Follower StrategyThis strategy uses the cross of the slopes of two EMAs having different lengths to generate trend follower signals. By default, I use 130 and 400, which behave very well.
The conditions which make the strat enter the market are:
- Fast Slope > Slow Slope and price > EMA 200 : go Long
- Fast Slope < Slow Slope and price < EMA200 : go Short
The simple slopes cross in the opposite direction, closes the position.
The strategy performs best on Bitcoin and the most liquid and capitalized Altcoins, but works greatly on volatile assets as well, in particular if they often go trending.
Works best on 4h time frame.
There's also an optional Volatility filter, which opens the position only if the difference between the two slopes is more than a specific value, which can be set in the strategy inputs. The purpose is not opening positions if price is going sideways and the noise is way > than the signal.
Enjoy it!

McGinley Dynamic Indicator This is a strategy based on the Mcginley Dynamic Moving Average indicator, a type of moving average that was designed to track the market better than existing moving average indicators. It is a technical indicator that improves upon moving average lines by adjusting for shifts in market speed.
Moving averages used:
EMA: 21
EMA: 42
The chart used for the backtest was the Bovespa Futures Index ( WIN1! Continuous: current contract in front )

EMA Cross StrategyThis is a strategy tester for EMA crossovers that enables you to include Stop Losses and select the backtesting period. You can also change the EMAs, apply a commision and the amount of starting capital.

XPloRR S&P500 Stock Market Crash Detection Strategy v2XPloRR S&P500 Stock Market Crash Detection Strategy v2
Long-Term Trailing-Stop strategy detecting S&P500 Stock Market Crashes/Corrections and showing Volatility as warning signal for upcoming crashes
Detecting or avoiding stock market crashes seems to be the 'Holy Grail' of strategies.
Since none of the strategies that I tested can beat the long term Buy&Hold strategy, the purpose was to detect a stock market crash on the S&P500 and step out in time to minimize losses and beat the Buy&Hold strategy. So beat the Buy&Hold strategy with around 10 trades. 100% capitalize sold trade into new trade.
With the default parameters the strategy generates 10262% profit (starting at 01/01/1962 until release date), with 10 closed trades, 100% profitable, while the Buy&Hold strategy only generates 3633% profit, so this strategy beats the Buy&Hold strategy by 2.82 times !
Also the strategy detects all major S&P500 stock market crashes and corrections since 1962 depending on the Trailing Stop Smoothness parameter, and steps out in time to cut losses and steps in again after the bottom has been reached. The 5 major crashes/corrections of 1987, 1990, 2001, 2008 and 2010 were successfully detected with the default parameters.
The script was first released on November 03 2019 and detected the Corona Crash on March 04 2020 with a Volatility crash-alert and a Sell crash-alert.
I have also created an Alerter Study Script based on the engine of this script, which generates Buy, Sell and Volatility signals.
If you are interested in this Alerter version script, please drop me a mail.
The script shows a lot of graphical information:
the Close value is shown in light-green. When the Close value is temporarily lower than the Buy value, the Close value is shown in light-red. This way it is possible to evaluate the virtual losses during the current trade.
the Trailing Stop value is shown in dark-green. When the Sell value is lower than the Buy value, the last color of the trade will be red (best viewed when zoomed)
the EMA and SMA values for both Buy and Sell signals are shown as colored graphs
the Buy signals are labeled in blue and the Sell signals are labeled in purple
the Volatility is shown below in green and red. The Alert Threshold (red) is default set to 2 (see Volatility Threshold parameter below)
How to use this Strategy?
Select the SPX (S&P500) graph and add this script to the graph.
Look in the strategy tester overview to optimize the values Percent Profitable and Net Profit (using the strategy settings icon, you can increase/decrease the parameters), then keep using these parameters for future Buy/Sell signals on the S&P500.
More trades don't necessarily generate more overall profit. It is important to detect only the major crashes and avoid closing trades on the smaller corrections. Bearing the smaller corrections generates a higher profit.
Watch out for the Volatility Alerts generated at the bottom (red). The Threshold can by changed by the Volatility Threshold parameter (default=2% ATR). In almost all crashes/corrections there is an alert ahead of the crash.
Although the signal doesn't predict the exact timing of the crash/correction, it is a clear warning signal that bearish times are ahead!
The correction in December 2018 was not a major crash but there was already a red Volatility warning alert. If the Volatility Alert repeats the next weeks/months, chances are higher that a bigger crash or correction is near. As can be seen in the graphic, the deeper the crash is, the higher and wider the red Volatility signal goes. So keep an eye on the red flag!
Here are the parameters:
Fast MA Buy: buy trigger when Fast MA Buy crosses over the Slow MA Buy value (use values between 10-20)
Slow MA Buy: buy trigger when Fast MA Buy crosses over the Slow MA Buy value (use values between 21-50)
Minimum Buy Strength: minimum upward trend value of the Fast MA Buy value (directional coefficient)(use values between 10-100)
Fast MA Sell: sell trigger when Fast MA Sell crosses under the Slow MA Sell value (use values between 10-20)
Slow MA Sell: sell trigger when Fast MA Sell crosses under the Slow MA Sell value (use values between 21-50)
Minimum Sell Strength: minimum downward trend value of the Fast MA Sell value (directional coefficient)(use values between 10-100)
Trailing Stop ATR: trailing stop % distance from the smoothed Close value (use values between 2-20)
Trailing Stop Smoothness: MA value for smoothing out the Trailing Stop close value
Buy On Start Date: force Buy on start date even without Buy signal (default: true)
Sell On End Date: force Sell on end date even without Sell signal (default: true)
Volatility EMA Period: MA value of the Volatility value (default 15)
Volatility Threshold: Threshold value to change volatility graph to red (default 2)
Volatility Graph Scaler: Scaling of the volatility graph (default 5)
Important : optimizing and using these parameters is no guarantee for future winning trades!

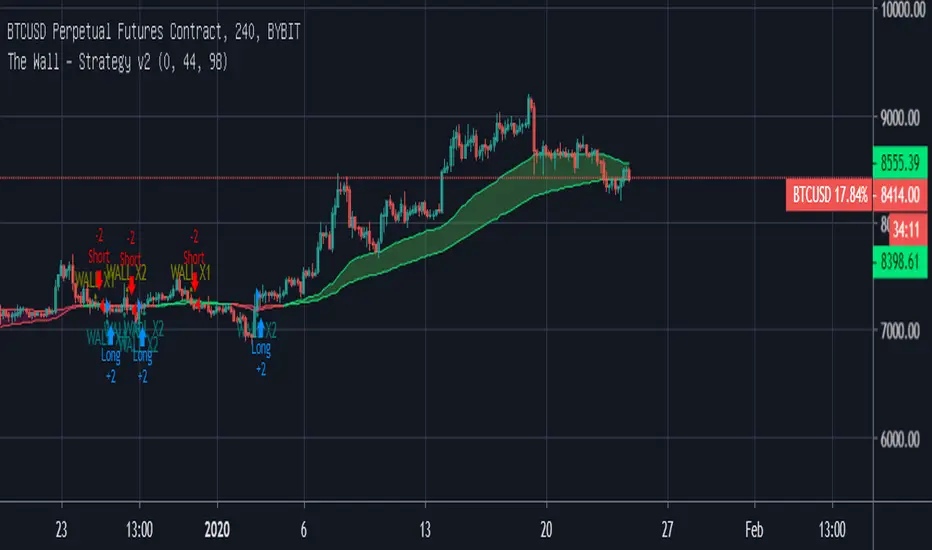
The Wall - Strategy v2If you make a loss, I am not responsible for it. Please use this with caution.
==================================================================================================================================================
The WALL - Strategy v2
If cross EMA 44 i go short. If cross EMA 98 i go long.
Including bit more special changes ;-).
==================================================================================================================================================
Do realize that the indicator is not 100% accurate and please use this with caution. Please read the disclaimer below before using this indicator or the services (Telegram/ Twitter , Trading View etc.) services associated with this indicator:
Disclaimer:
No Investment Advice Provided
Any opinions, chats, messages, news, research, analyses, prices, or other information contained here are provided as general information for educational and entertainment purposes only and do not constitute investment advice. My bullshit statements should not be relied upon as a substitute for an extensive independent market research before making your actual trading decisions. Opinions, market data, recommendations or any other content is subject to change at any time without notice. I will not accept liability for any loss or damage, including without limitation any loss of profit, which may arise directly or indirectly from use of or reliance on such information.
I do not recommend the use of technical analysis or any analysis as a sole means of trading decisions. I do not recommend making hurried trading decisions. I have no clue about PAST PERFORMANCE or any INDICATIVE FUTURE RESULTS.
THE script and its associated services ARE PROVIDED "AS IS", WITHOUT WARRANTY OF ANY KIND, EXPRESS OR IMPLIED, INCLUDING BUT NOT LIMITED TO THE WARRANTIES OF MERCHANTABILITY, FITNESS FOR A PARTICULAR PURPOSE AND NONINFRINGEMENT. IN NO EVENT SHALL THE AUTHORS OR COPYRIGHT HOLDERS BE LIABLE FOR ANY CLAIM, DAMAGES OR OTHER LIABILITY, WHETHER IN AN ACTION OF CONTRACT, TORT OR OTHERWISE, ARISING FROM, OUT OF OR IN CONNECTION WITH THE SOFTWARE OR THE USE OR OTHER DEALINGS IN THE SOFTWARE, WEBSITE, SCRIPT, SIGNALS.
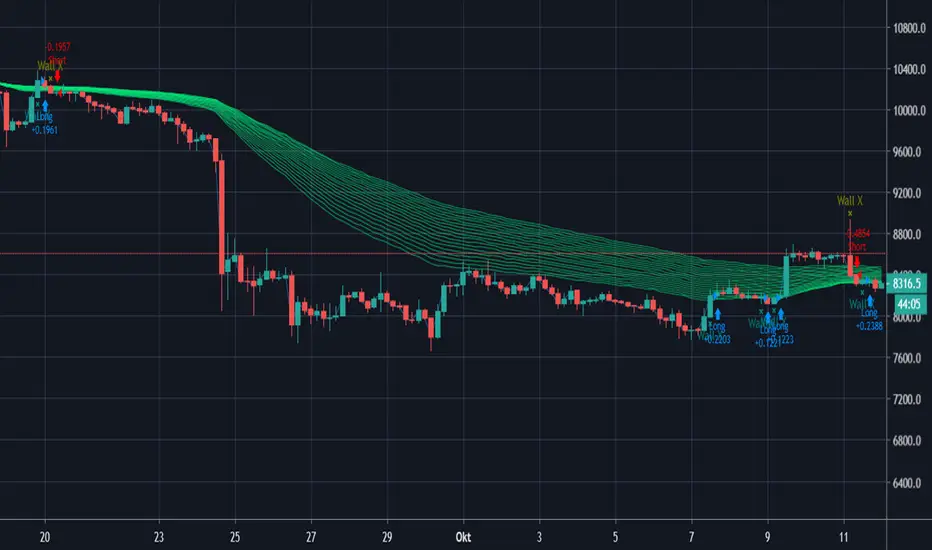
The Wall - StrategyIf you make a loss, I am not responsible for it. Please use this with caution.
==================================================================================================================================================
The WALL - Strategy
If cross EMA 44 i go short. If cross EMA 98 i go long.
==================================================================================================================================================
Do realize that the indicator is not 100% accurate and please use this with caution. Please read the disclaimer below before using this indicator or the services (Telegram/ Twitter , Trading View etc.) services associated with this indicator:
Disclaimer:
No Investment Advice Provided
Any opinions, chats, messages, news, research, analyses, prices, or other information contained here are provided as general information for educational and entertainment purposes only and do not constitute investment advice. My bullshit statements should not be relied upon as a substitute for an extensive independent market research before making your actual trading decisions. Opinions, market data, recommendations or any other content is subject to change at any time without notice. I will not accept liability for any loss or damage, including without limitation any loss of profit, which may arise directly or indirectly from use of or reliance on such information.
I do not recommend the use of technical analysis or any analysis as a sole means of trading decisions. I do not recommend making hurried trading decisions. I have no clue about PAST PERFORMANCE or any INDICATIVE FUTURE RESULTS.
THE script and its associated services ARE PROVIDED "AS IS", WITHOUT WARRANTY OF ANY KIND, EXPRESS OR IMPLIED, INCLUDING BUT NOT LIMITED TO THE WARRANTIES OF MERCHANTABILITY, FITNESS FOR A PARTICULAR PURPOSE AND NONINFRINGEMENT. IN NO EVENT SHALL THE AUTHORS OR COPYRIGHT HOLDERS BE LIABLE FOR ANY CLAIM, DAMAGES OR OTHER LIABILITY, WHETHER IN AN ACTION OF CONTRACT, TORT OR OTHERWISE, ARISING FROM, OUT OF OR IN CONNECTION WITH THE SOFTWARE OR THE USE OR OTHER DEALINGS IN THE SOFTWARE, WEBSITE, SCRIPT, SIGNALS.

Volatility Stop + EMA V1.1 For Short PositionEMA 50, 100, 200 to decide trend and volatility to confirm the trade
entry: price close below ema50 and vstop 20 , enter short position
exit : price close above vstop20
Yellow line on chart indicates Ema 50

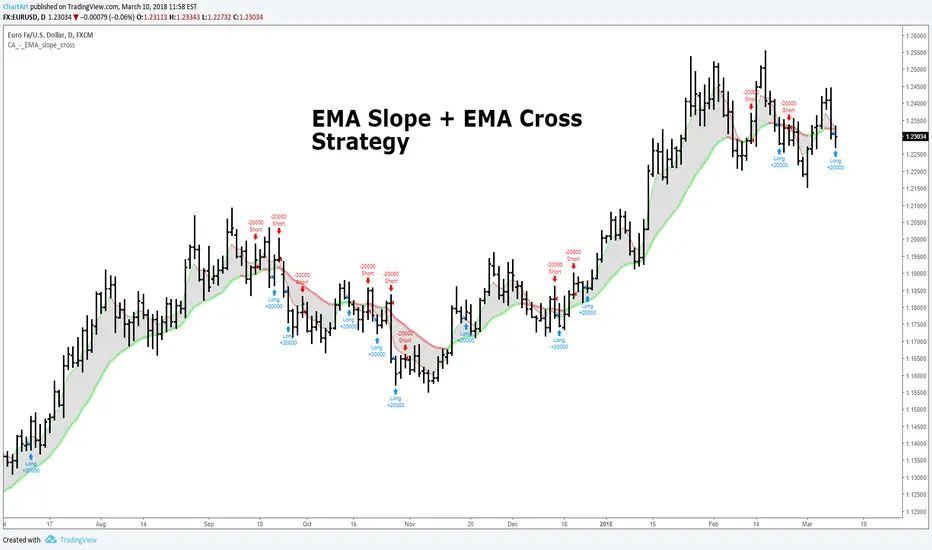
EMA Slope + EMA Cross Strategy (by ChartArt)This strategy uses divergences between three exponential moving averages and their slope directions as well as crosses between the price and these moving averages to switch between a long or short position. The strategy is non-stop in the market and always either long or short.
In addition the moving averages and price bars are colored depending if they are trending up or down.
The strategy was created for the "EURUSD" daily timeframe.
All trading involves high risk; past performance is not necessarily indicative of future results. Hypothetical or simulated performance results have certain inherent limitations. Unlike an actual performance record, simulated results do not represent actual trading. Also, since the trades have not actually been executed, the results may have under- or over-compensated for the impact, if any, of certain market factors, such as lack of liquidity. Simulated trading programs in general are also subject to the fact that they are designed with the benefit of hindsight. No representation is being made that any account will or is likely to achieve profits or losses similar to those shown.
WY Tame the Crypto MarketStrategy utilizes a combination of EMAs, RSIs, EMA of RSIs with adjustable ranges for a wide range of crypto trading flexibility.

EMA + Sessions + RSI Strategy v1.0A professional trading strategy that combines multiple technical indicators for high-probability entries. This system uses EMA crossovers, RSI zone filtering, and trend confirmation to identify optimal trading opportunities while managing risk with advanced position management tools.
Key Features:
✅ Dual Entry Signals (EMA21 + EMA100 crossover conditions)
✅ Trend Filter EMA750 (trade only with the major trend)
✅ Complete Risk Management (SL 1%, TP 3% default)
✅ Trailing Stop & Breakeven (maximize profits, protect capital)
✅ Compact Statistics Table (real-time performance metrics)
✅ RSI & Session Filters (avoid low-probability setups)
✅ Optional Pyramiding (scale into winning positions)
Perfect for swing trading and trend-following on any timeframe. Fully customizable to match your trading style.

EMA Velocity Volatility Clamp (v1)A strategy based on the rate of price change using EMA.
Configured for the 5M Solana.
BINANCE:SOLUSDT
