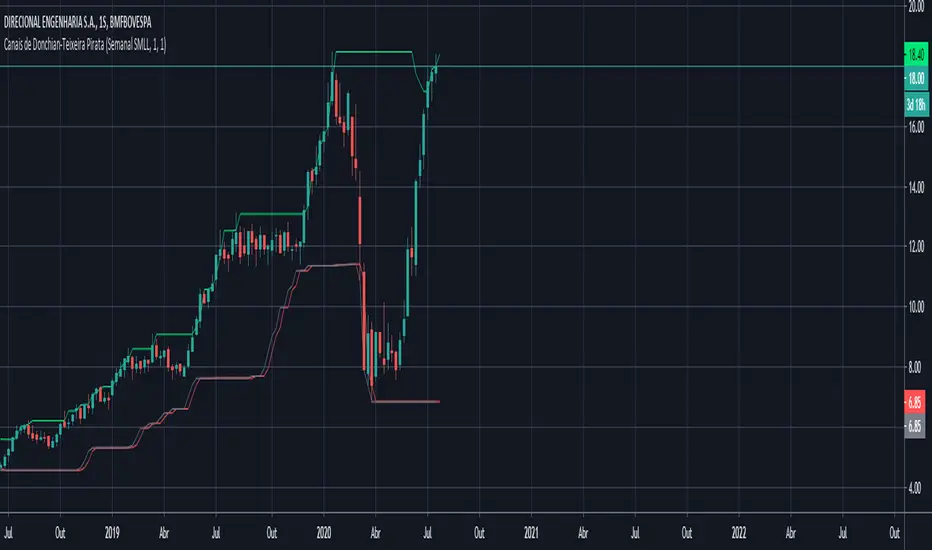
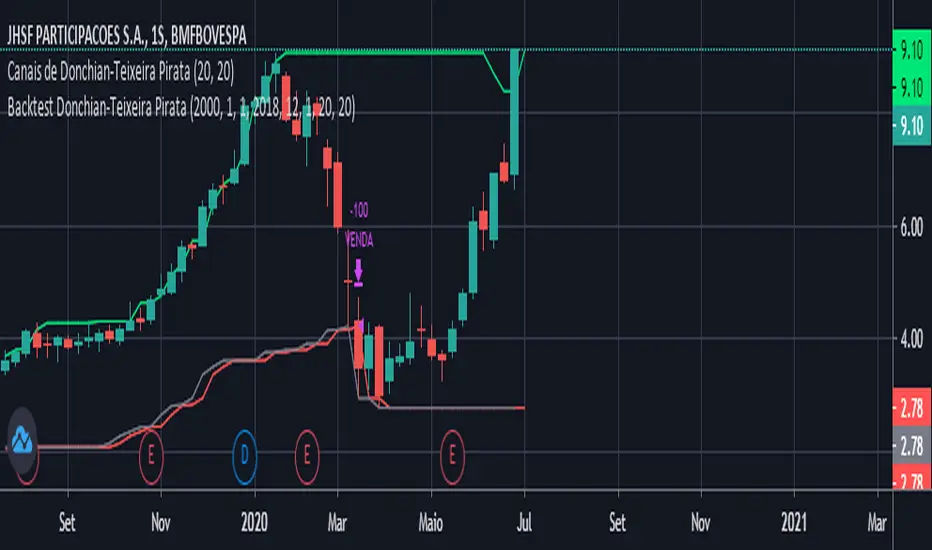
Don ratioUsing the ratio of donchian channel from early script we can calculate factor Z which is the estimate of the high ratio and the low ratio
crossing it with +100 and -100 we can produce the signals with addition on non repaint donchian ratio channel
inside the script one can take profit for both long and short , buy again and sell again with stop loss if needed
by the same logic we can calculate factor to z to any channel we want once we create the correct ratio to it
ค้นหาในสคริปต์สำหรับ "donchian"

CM_Donchian Channels V5NOTE: this indicator was created by @ChrisMoody. I found it really useful, so I upgraded it from v3 to v5
This Indicator replicates the Donchian Channels, but with Alerts Capability
You can set up an alert for when the price breaks above the upper band or when the price breaks below the lower band
It will display respectively a green upward arrow or a red downward arrow
It is possible to change the length of the Indicator
Original Post:

Channel IndicatorSimple Donchian Channels and two EMA so you can trade the bottom and the top of the channel.

River StyxRiver Styx - Modified Donchian Channel with separate adjustments for upper and lower levels, with offset
Blue line = the highest price of the last 14 periods (resistance).
Red line = the lowest price of the last 14 periods (support).
Gray line = middle line between blue and red line.
Green line = exponential moving average of 2 periods of closing price.

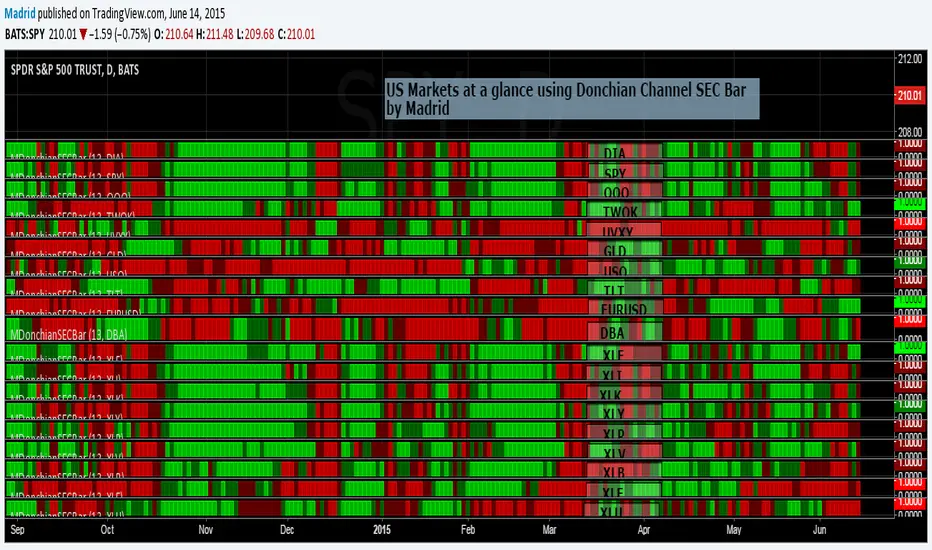
Madrid Donchian SEC barThis study is based on the Donchain Channel Bar indicator but this adds security as a parameter. This allows several instances of this indicator to be used in the same page to create a heat map to take look at a glance at several securities, just like the example where this was implemented.
The only two parameters it requires are the security symbol and the length of the analysis.
TASC 2023.08 Channeling Your Inner Chartist█ OVERVIEW
TASC's August 2023 edition of Traders' Tips features an article written by Stella Osoba titled “Using Price Channels.” The article offers a basic look at using price channels, with a primary focus on Donchian channels . Following the article, the script provides an example of how to calculate and utilize the Donchian channel to gain insights into the price behavior and potential trend movements.
█ CONCEPTS
The use of price channels is a long-standing and fundamental charting technique commonly associated with trend-following trading strategies. Price channels help identify the trend on the chart and facilitate trading in its direction. The Donchian channel, in particular, consists of three lines. The upper line is conventionally calculated as the highest high over a specified lookback period, while the lower line is defined as the lowest low over the same period. The central line represents the midpoint between the upper and lower lines.
The Donchian channel provides a simple and intuitive visual representation of price behavior. Breaking through the lower line, for instance, can indicate weakness and selling pressure, while breaking through the upper line can signal buying pressure. By observing these breakout points, one can gain insight into potential beginnings or endings of long-term trends. However, it is important to note that breakouts often lead to price reversals, so they should be carefully evaluated
█ CALCULATIONS
To illustrate a simple Donchian trading system, this script calculates and plots the channel lines, as well as potential entry points for long positions (green triangles) and short positions (red triangles).

Donchian x WMA Crossover (2025 Only, Adjustable TP, Real OHLC)Short Description:
Long-only breakout system that goes long when the Donchian Low crosses up through a Weighted Moving Average, and closes when it crosses back down (with an optional take-profit), restricted to calendar year 2025. All signals use the instrument’s true OHLC data (even on Heikin-Ashi charts), start with 1 000 AUD of capital, and deploy 100 % equity per trade.
Ideal parameters configured for Temple & Webster on ASX 30 minute candles. Adjust parameter to suit however best to download candle interval data and have GPT test the pine script for optimum parameters for your trading symbol.
Detailed Description
1. Strategy Concept
This strategy captures trend-driven breakouts off the bottom of a Donchian channel. By combining the Donchian Low with a WMA filter, it aims to:
Enter when volatility compresses and price breaks above the recent Donchian Low while the longer‐term WMA confirms upward momentum.
Exit when price falls back below that same WMA (i.e. when the Donchian Low crosses back down through WMA), but only if the WMA itself has stopped rising.
Optional Take-Profit: you can specify a profit target in decimal form (e.g. 0.01 = 1 %).
2. Timeframe & Universe
In-sample period: only bars stamped between Jan 1 2025 00:00 UTC and Dec 31 2025 23:59 UTC are considered.
Any resolution (e.g. 30 m, 1 h, D, etc.) is supported—just set your preferred timeframe in the TradingView UI.
3. True-Price Execution
All indicator calculations (Donchian Low, WMA, crossover checks, take-profit) are sourced from the chart’s underlying OHLC via request.security(). This guarantees that:
You can view Heikin-Ashi or other styled candles, but your strategy will execute on the real OHLC bars.
Chart styling never suppresses or distorts your backtest results.
4. Position Sizing & Equity
Initial capital: 1 000 AUD
Size per trade: 100 % of available equity
No pyramiding: one open position at a time
5. Inputs (all exposed in the “Inputs” tab):
Input Default Description
Donchian Length 7 Number of bars to calculate the Donchian channel low
WMA Length 62 Period of the Weighted Moving Average filter
Take Profit (decimal) 0.01 Exit when price ≥ entry × (1 + take_profit_perc)
6. How It Works
Donchian Low: ta.lowest(low, DonchianLength) over the specified look-back.
WMA: ta.wma(close, WMALength) applied to true closes.
Entry: ta.crossover(DonchianLow, WMA) AND barTime ∈ 2025.
Exit:
Cross-down exit: ta.crossunder(DonchianLow, WMA) and WMA is not rising (i.e. momentum has stalled).
Take-profit exit: price ≥ entry × (1 + take_profit_perc).
Calendar exit: barTime falls outside 2025.
7. Usage Notes
After adding to your chart, open the Strategy Tester tab to review performance metrics, list of trades, equity curve, etc.
You can toggle your chart to Heikin-Ashi for visual clarity without affecting execution, thanks to the real-OHLC calls.

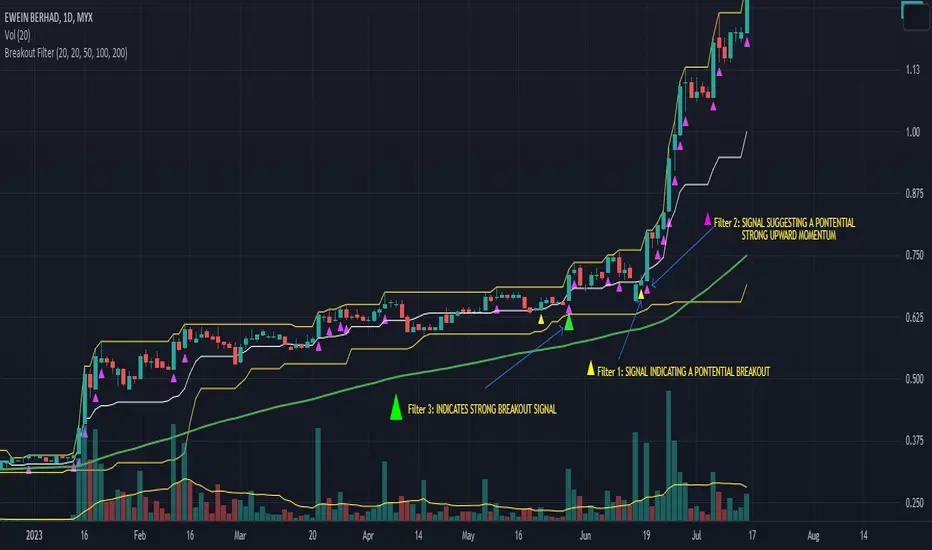
Breakout FilterIntroduction:
The Breakout Filter is a technical analysis indicator designed to identify potential breakout trading opportunities in the financial markets. It combines breakout conditions based on price and volume with the visualization of Exponential Moving Average (EMA) lines. This indicator can be a valuable tool for traders seeking to capture breakout movements while utilizing EMA lines for additional trend analysis.
Indicator Overview:
The Breakout Filter consists of three main filters: Filter 1, Filter 2, and Filter 3. Each filter has its own set of conditions that need to be met for a breakout signal to be generated. Additionally, the indicator plots EMA lines on the chart to provide further insights into the market trend.
Filter 1: Price & Volume Breakout (Default symbol: Tiny Yellow Triangle)
Filter 1 focuses on identifying breakouts based on both price and volume criteria. It considers the following conditions:
- Price Breakout: The close price crosses above the Donchian Channel's middle line, indicating a potential upward breakout.
- Volume Breakout: The trading volume exceeds the moving average of volume, suggesting increased market participation during the breakout.
When both the price breakout and volume breakout conditions are met, Filter 1 generates a signal indicating a potential breakout in the market. This filter helps traders identify significant price movements accompanied by higher trading volumes.
Filter 2: Upper Band Breakout
Filter 2 specifically looks for breakouts above the upper band of the Donchian Channel. This condition suggests a potential strong upward momentum in the market. When the high price exceeds the upper band, Filter 2 generates a signal, indicating a breakout above the recent price range.
Filter 3: Combined Filter 1 and Filter 2
Filter 3 combines the conditions of both Filter 1 and Filter 2. It requires that both Filter 1 and Filter 2 generate signals simultaneously. When this happens, it indicates a strong breakout signal with price and volume confirming the upward momentum.
EMA Lines:
The Breakout Filter with EMA Lines also includes the visualization of Exponential Moving Average (EMA) lines on the chart. EMA is a popular technical indicator used to identify the overall trend in the market. The indicator plots three EMA lines with different periods: EMA1, EMA2, and EMA3. Traders can choose the periods for each EMA line based on their preference and trading strategy.
The EMA lines can provide additional insights into the market trend and potential support or resistance levels. By observing the interaction between the price and the EMA lines, traders can gain a better understanding of the prevailing market sentiment and make informed trading decisions.
How to screen these filters using Trading View Screener
Insert column "DONCHIAN20 UP" and set to "EQUAL HIGH"
Conclusion:
The Breakout Filter with EMA Lines is a comprehensive indicator that combines breakout conditions based on price and volume with the visualization of EMA lines. It helps traders identify potential breakout trading opportunities while providing insights into the market trend. By using this indicator, traders can enhance their trading strategies and potentially improve their trading outcomes.
Please note that this write-up is for informational purposes only and should not be considered as financial advice. Traders should conduct their own analysis and exercise caution when making trading decisions.
Donchian Channels StrengthTL;DR - A different approach calculating strength based on Donchain channels
My approach calculating strength by using the difference between price and donchain average. It is possible to use the highest/lowest value of a given source (like close) or to use the highest high/lowest low (by using the option 'include wicks') for the strength calculation
I added multiple moving averages which can be used in the calculations incl. SMMA (RMA) which is used in RSI calculation and works best for me.
Usage is similar to RSI: DC Strength oscillates between 0 and 100. Low values (<20) indicate a bearish situation while high values (>80) indicate bullish ones. Center line (50) crossings can also indicate a possible trend change.

TrendLine ChannelsAbstract
This script provides a set of Trendline Channels which can be tighter than Donchian Channels.
This script computes the most suitable active upper and lower trendlines and updates them as soon as possible.
We can use it for breakout signals earlier than Donchian Channels.
Introduction
Channels are tools which can mark area of values of ranging markets.
Once the price leaves the original region, range traders may start admitting they are wrong and trigger trend.
Donchian Channels (misheard as Dungeon Channels) use the highest and the lowest price to define area of values.
When the price breakouts, it just like it got released from a dungeon.
However, waiting for the price making even higher or lower may be too late and risk reward ratio may be lower.
Trendlines can make the channels tighter and we can find earlier breakout signals.
Computing Trendline Channels
(1) Find the most active trendlines
In this script, a valid trendline connects two high values or two low values.
A high value means the highest value in a trading day.
A low value means the lowest value in a trading day.
In this script, every trendline does not crossover any bar but can exactly touch them.
The most flat trendline is taken. (one for upper and one for lower)
(2) Continue to use or Change a trendline
If there is a tighter trendline available, this script changes to use it.
If the previous active trendline is broken, this script re-computes the trendline available.
When this case happens, this script display with an another color.
Otherwise, this script continues using the previous trendline.
(3) Middle line
The middle line indicates the middle value between the upper and the lower.
Parameters
Length : how many days are used for computation. The default value is 16 just because 16=4*4, using binary characteristic.
x_go_on : If the previous trendline is not breakout and there are no tighter trendlines available, we continue use it.
Color Options
(1) Upper trendline (no update or tighter)
(2) Upper trendline (changed due to breakout)
(3) Middle line
(4) Lower trendline (no update or tighter)
(5) Lower trendline (changed due to breakout)
Conclusion
Trendline Channels can be tighter than Donchian Channels and evaluate earlier breakout signals.
Comparing to known auto trendline scripts, Trendline Channels is continuous.
Once a trendline is broken, Trendline Channels can instantly point out the next available one.
If you think the price movement is boring or you cannot have good risk reward ratio, you can go to an another timeframe.
Reference
How to trade with Donchian Channels
How to trade with Trendlines

Turtle System 1 (20/10) + N-Stop + MTF Table V7.2🐢 Description: Turtle System 1 (20/10) IndicatorThis indicator implements the original trading signals of the Turtle Trading System 1 based on the classic Donchian Channels. It incorporates a historically correct, volatility-based Trailing Stop (N-Stop) and a Multi-Timeframe (MTF) status dashboard. The script is written in Pine Script v6, optimized for performance and reliability.📊 Core Logic and ParametersThe system is a pure trend-following model, utilizing the more widely known, conservative parameters of the Turtle System 1:FunctionParameterValueDescriptionEntry$\text{Donchian Breakout}$$\mathbf{20}$Buy/Sell upon breaking the 20-day High/Low.Exit (Turtle)$\text{Donchian Breakout}$$\mathbf{10}$Close the position upon breaking the 10-day Low/High.Volatility$\mathbf{N}$ (ATR Period)$\mathbf{20}$Calculation of market volatility using the Average True Range (ATR).Stop-LossMultiplier$\mathbf{2.0} BER:SETS the initial and Trailing Stop at $\mathbf{2N}$.🛠️ Key Technical Features1. Original Turtle Trailing Stop (Section 4)The stop-loss mechanism is implemented with the historically accurate Turtle Trailing Logic. The stop is not aggressively tied to the current candle's low/high, which often causes premature exits. Instead, the stop only trails in the direction of the trend, maximizing the previous stop price against the new calculated $\text{Close} \pm 2N$:$$\text{New Trailing Stop} = \text{max}(\text{Previous Stop}, \text{Close} \pm (2 \times N))$$2. Reliable Multi-Timeframe (MTF) Status (Section 6)The indicator features a robust MTF status table.Purpose: It calculates and persistently stores the Turtle System 1 status (LONG=1, SHORT=-1, FLAT=0) for various timeframes (1H, 4H, 8H, 1D, and 1W).Method: It uses global var int variables combined with request.security(), ensuring the status is accurately maintained and updated across different bars and timeframes, providing a reliable higher-timeframe context.3. VisualizationsChannels: The 20-period (Entry) and 10-period (Exit) Donchian Channels are plotted.Stop Line: The dynamic $\mathbf{2N}$ Trailing Stop is visible as a distinct line.Signals: plotshape markers indicate Entry and Exit.MTF Table: A clean, color-coded status summary is displayed in the upper right corner.

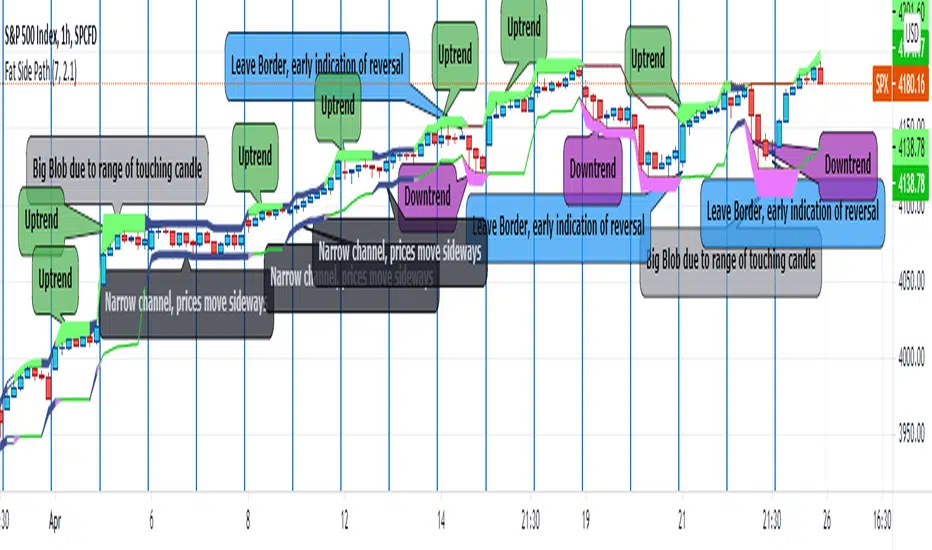
Fat Side PathI got the idea for a narrow Donchian Channel with a short lookback period which closely follows the price fluctuation in which the sides of the channel have a thickness according to the range of the last touching candle.
Any channel, be it Donchian, Keltner, Bollinger Bands or Parallel, has an upside and a downside, touching the upside is a buy signal as this may initiate an uptrend, the downside a sell signal because a down trend may come.
This gave me the idea to make only the last touched side fat, thus creating visible switching between uptrend and downtrend. However this is ‘too digital’, as in practice also periods of no trend occur in which signaling a trend would give a false signal. In a Donchian channel (and also Bollinger Bands) such periods are marked by narrowing the channel. So I gave a no trend signal to the sides when the channel is narrower than a minimum width to call a trend. I gave the thing nice colours and proper default settings.
Use of the channel in trading.
I think this thing can be useful for swing trading. In channels two typical things may happen that should be noted by the trader, these are LB, Leaving the Border, which signals a trend reversal and FTT, Failure To Traverse, i.e. the price doesn’t manage to cross the channel to the other side. This affirms the trend. FTT’s are not expected in short lookback channels like this path (Sidenote: Fibonacci levels can be regarded as predictions where FTT’s may occur). The fat side indicates direction. Because somehow trends seem to end with a notable range extension, this channel sometimes produces a “Big Blob” where the trend reverses.
I intend to use this thing together with my Keltner Fibzones channel, where the zones serve as a ‘landscape’ in which the Fat Side Path meanders providing ‘comments’ on the short term price movements.
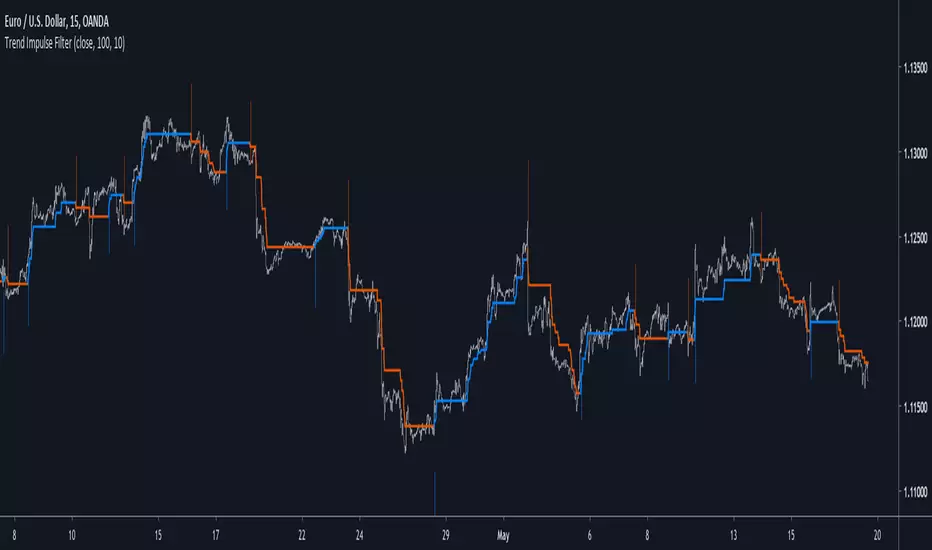
Trend Impulse FilterIntroduction
There is a lot of indicators similar to this one, however i think this one don't share the same calculation method and this is why i share it. This indicator aim to forecast price direction using an exponential filter architecture using highest and lowest information for the estimation of a smoothing variable. This filter is similar to the average Max-Min filter.
The Indicator
In the code a is equal to 1 when the price is greater or lower than any past price over length period, else a is equal to 0. The center parameter control the filtering degree of the output, when center is equal to 1 and a = 1 the indicator return the highest or lowest depending on market current trend, when center is superior to 1 the output will be smoother, however the reactivity of the indicator will still depend on the length parameter.
A color option show you the trend of the market, however the generated signals are the same that can be generated from a Donchian channel.
When highest is greater than previous highest the indicator direction will move upward, else if lowest is lower than previous lowest the indicator direction will move downward. Therefore the indicator can give information on the Donchian channels direction and provide a nice filter.
Conclusions
Adapting to highest and lowest can make an indicator adapt to the essence of trend trading, the indicator i showed can be used as source for others indicator or in MA crossover strategies. If you have a strategy using Donchian channels you may be interested in using this indicator and se how it fit in your strategy. Hope you like it.
Thanks for reading !
EASY SYSTEMSo how to use this very easy system
we have two system the first is based on ATR resistance and support and the other based on % channel based on donchian channel
The black line is the price line
The red lines are % line of the donchian channel (here it set to 2 and 3 % (you can set it any number you want ) this lines are the low end
Theblue d lines are % line of the donchian channel (here it set to 2 and 3 % (you can set it any number you want ),this lines are upper end
you look at the resistance and the support of the ATR and on the % channel
lets say you decide to go long -best if it in lower end of your % channel you can either set alert if price crossup the lower % line that you set
and you can make take profit if it reach the target level by % of the line of your choice
oposite you do in shorting
using the build in alert in TV you can make your trade more easy setting the target in more logical way

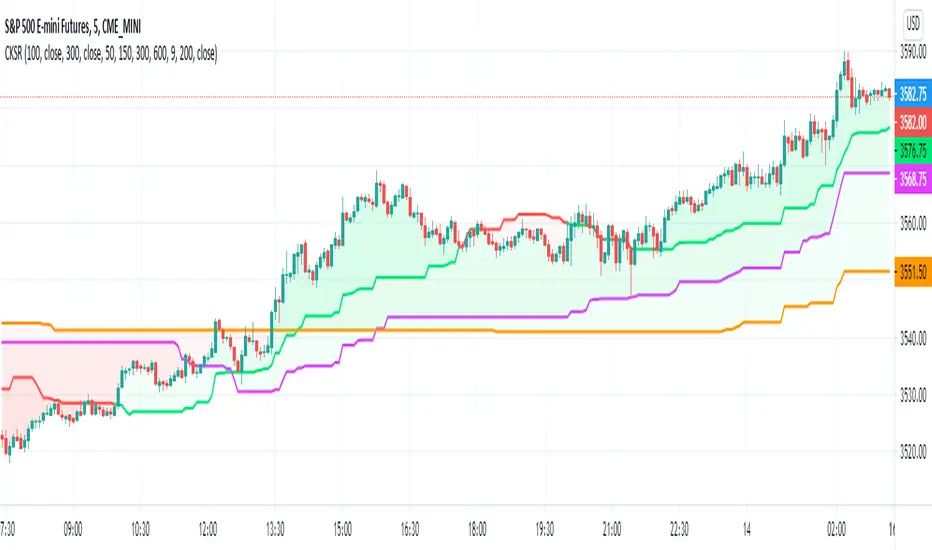
Step RiderRelease Note:
Idea of this script is to ride on the trend. Multiple dynamic support and resistance are identified and those levels are used
Step Lines:
There are 3 different periods by default are used to define 3 different step lines. On any trend, either of these 3 steps shall play major role
Color Strength:
Change in Red & Green color and its thickness changed based on how strong the up or down trend is.
Disclaimer:
//Disclaimer: Idea of publishing this script is to identify the strength of the instrument using multiple confirmation.
//Disclaimer: Using this indicator, changing inputs, and trading decisions are up to the users/traders.
//Courtesy: Thanks to Richard Donchian, Alan Hull as this indicator/script inspired by Donchian Channels, Hull Moving Average
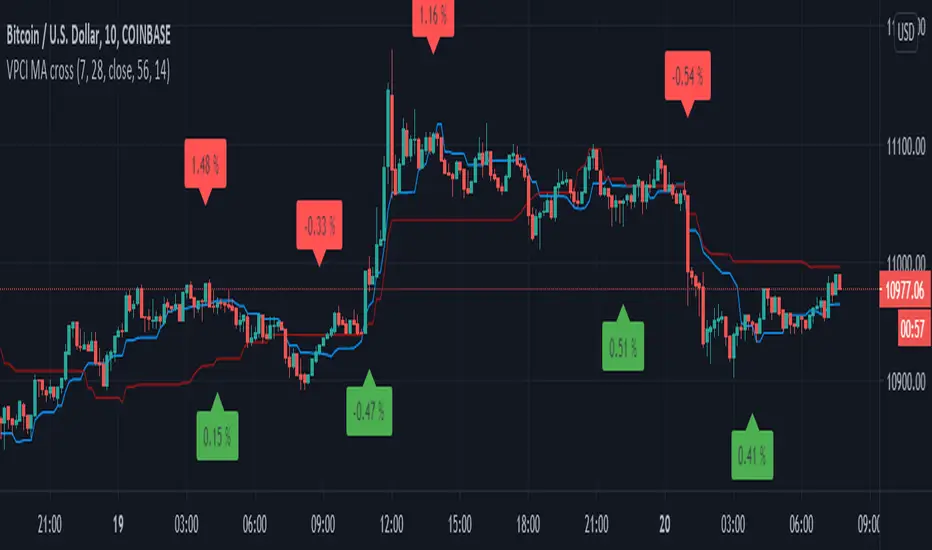
VPCI MA cross [LM]Hello guys,
I would like to introduce you a script that combines two indicators: VPCI( volume price confirmation indicator) and donchian MAs
VPCI:
Fundamentally, the VPCI reveals the proportional imbalances between price trends and volume-adjusted price
trends. An uptrend with increasing volume is a market characterized by greed supported by the fuel needed to
grow. An uptrend without volume is complacent and reveals greed deprived of the fuel needed to sustain itself.
Investors without the influx of other investors ( volume ) will eventually lose interest and the uptrend should
eventually breakdown.
A falling price trend reveals a market driven by fear. A falling price trend without volume reveals apathy, fear
without increasing energy. Unlike greed, fear is self-sustaining, and may endure for long time periods without
increasing fuel or energy. Adding energy to fear can be likened to adding fuel to a fire and is generally bearish
until the VPCI reverses. In such cases, weak-minded investor's, overcome by fear, are becoming irrationally
fearful until the selling climax reaches a state of maximum homogeneity. At this point, ownership held by weak
investor’s has been purged, producing a type of heat death capitulation. These occurrences may be visualized by
the VPCI falling below the lower standard deviation of a Bollinger Band of the VPCI, and then rising above the
lower band, and forming a 'V' bottom.
I have used MA's on top of VPCI and looking for crosses. Percatage that is shown in label is calculation of difference between previous cross and current close price. So you know if you would be flipping what % you would gain or loose, all is rounded with precission of two
DONCHIAN
I took donchain calculation from ichimoku to calculate conversion line and base line(both are giving me information about whether it's trending or not and distance from the mean)
There are various sections in setting:
VPCI - setting of MA lengths(for smaller timeframes I recommend using bigger MA length)
DONCHAIN - setting length for conversion and base line
Any suggestions are welcome
ATR-ranged Donch on 15min// This is a simple Mean Reversion & Breakout Indicator.
// A Donchian Channel is plotted. A threshold equal to 0.25 of Daily ATR.
// If price reverses from this threshold, then it can be taken as possible Mean Reversion.
// If price crosses the previous Donchian levels, it can be taken as a possible breakout.
// Typical of such strategy is the whipsaw effect when price movement is just flat.
// I have marked the region where the lower and higher thresholds are closer to be an indicative of whipsaw.
// But it is not really effective to avoid whipsaw.

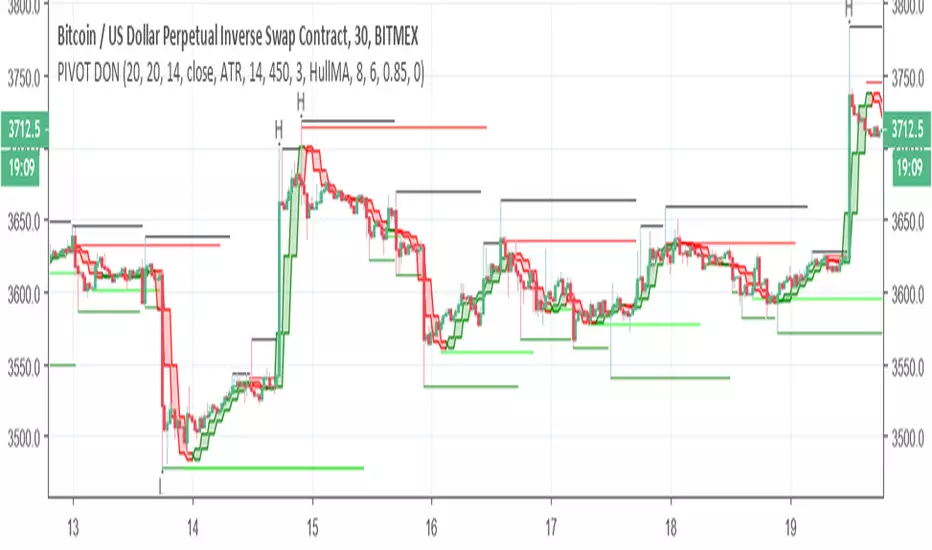
PIVOT DONThis indicator is great to detect resistance and support
The H and L are based on new high and low formed by Donchian cahnnel , the lines of support and resistance are based on pivot system
by the TF you can control the time length of the donchian channel
no alert to this system
Consecutive Highs/LowsTrack consecutive new highs/lows outside the Donchian range. Fans of the oldschool Turtle Strategy should enjoy the visualization.
Same logic as my "Walking the Bands" script, just with Donchian breaks instead of Bollinger tags.

Bagheri IG Ether v2In this version, the winning ratio has been decreased, but the Risk to Reward Ratio (RRR) has been set to be better than the previous version.
This is a technical trading strategy for Ethereum ( BINANCE:ETHUSDT ). We built and developed it on MetaEditor and optimized it with MetaTrader optimizer.
The main indicators are Donchian Channel, Oscillator of ROC , Bears Power, Balance of Power , and Simple Moving Average ( SMA ). Default values in the input panel are the best combination of these indicators, but you can change any of them and try it for better results.
Please notice that this strategy has been optimized on the 1-minute chart of Ethereum .
For each position, you can see the Take Profit (TP) and Stop Loss (SL) levels. Also, you can find the values of mentioned TP and SL in points from the input panel of the script.
Attention: The price of Ethereum has 2 decimal places.
Therefore, 3000 points for TP means 30 USDT for trading 1 BINANCE:ETHUSDT .

[RS]MTF Intraday Dayly Range V0calculation to display a dayly donchian channel at any intraday timeframe.
