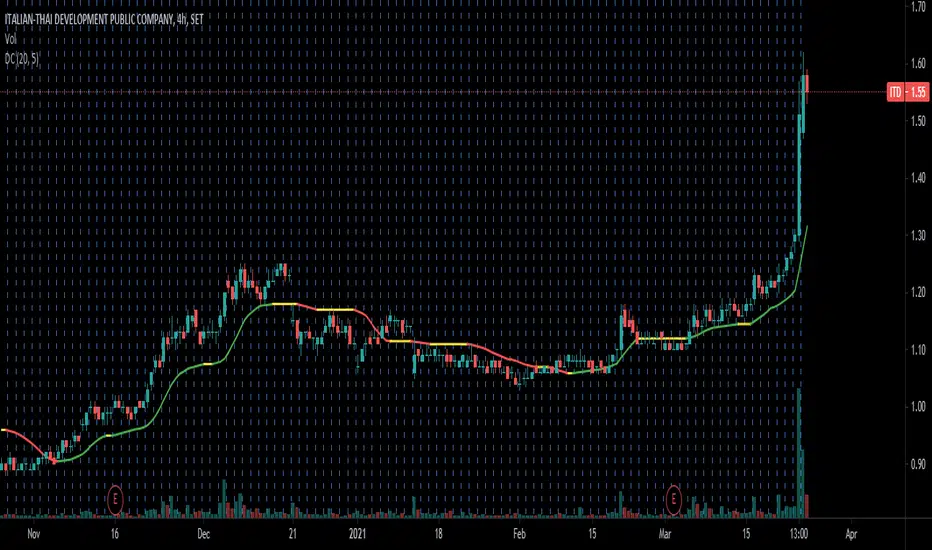
Combo Strategy 123 Reversal & Donchian Channel WidthThis is combo strategies for get a cumulative signal.
First strategy
This System was created from the Book "How I Tripled My Money In The
Futures Market" by Ulf Jensen, Page 183. This is reverse type of strategies.
The strategy buys at market, if close price is higher than the previous close
during 2 days and the meaning of 9-days Stochastic Slow Oscillator is lower than 50.
The strategy sells at market, if close price is lower than the previous close price
during 2 days and the meaning of 9-days Stochastic Fast Oscillator is higher than 50.
Second strategy
The Donchian Channel was developed by Richard Donchian and it could be compared
to the Bollinger Bands. When it comes to volatility analysis, the Donchian Channel
Width was created in the same way as the Bollinger Bandwidth technical indicator was.
As was mentioned above the Donchian Channel Width is used in technical analysis to measure
volatility. Volatility is one of the most important parameters in technical analysis.
A price trend is not just about a price change. It is also about volume traded during this
price change and volatility of a this price change. When a technical analyst focuses his/her
attention solely on price analysis by ignoring volume and volatility, he/she only sees a part
of a complete picture only. This could lead to a situation when a trader may miss something and
lose money. Lets take a look at a simple example how volatility may help a trader:
Most of the price based technical indicators are lagging indicators.
When price moves on low volatility, it takes time for a price trend to change its direction and
it could be ok to have some lag in an indicator.
When price moves on high volatility, a price trend changes its direction faster and stronger.
An indicator's lag acceptable under low volatility could be financially suicidal now - Buy/Sell signals could be generated when it is already too late.
Another use of volatility - very popular one - it is to adapt a stop loss strategy to it:
Smaller stop-loss recommended in low volatility periods. If it is not done, a stop-loss could
be generated when it is too late.
Bigger stop-loss recommended in high volatility periods. If it is not done, a stop-loss could
be triggered too often and you may miss good trades.
WARNING:
- For purpose educate only
- This script to change bars colors.
ค้นหาในสคริปต์สำหรับ "donchian"

TURT Donchian Ladder v3.13How to trade TURT+ with the v3.13 script
1) Pick the system & arm the entry
• In the script, choose System = S1 (20D) or S2 (55D).
The HUD always shows both rails for reference, but the ladder (Entry/+Adds) uses the system you pick.
• Your Entry is shown as Pivot + 0.1×N (rounded).
• Place a stop-limit “parent” order at that Entry price. (Classic Turtle uses an entry stop; I suggest a tight limit offset so you don’t chase a blow-through.)
• Initial stop = N2 = Entry − 2×N (rounded). Put that in immediately.
If you like only confirming on a bar close, leave confirmClose = true and place the parent after the close that breaks out. If you want intrabar fills, set confirmClose = false and keep the stop-limit active intraday.
2) Size it the way you planned
• Set acctEquity / riskCapPct / posCapUSD / entryFrac / entryRiskFrac / sizingMode.
• HUD gives Rec Entry Qty (when flat) and, once in, it shows:
• Next Rung (price)
• Suggested AddShares (honors RiskCap & PosCap)
• Proj Stop if Add (ratcheted N2)
• A limiter note (RiskCap or PosCap) if you’re constrained.
3) After entry fills, stage the ADDs (only at fixed +N steps)
• Adds are NOT “every Donchian break.” You add only at:
• Add-1 = Entry + 0.5×N
• Add-2 = Entry + 1.0×N
• Add-3 = Entry + 1.5×N (optional)
• Use the HUD’s Suggested AddShares for each rung (it respects your RiskCap/PosCap).
• Place stop-limit orders for each add (either immediately as a contingent OTO chain that arms only after Entry fills, or you arm each add when price approaches—your choice).
• On each add fill, ratchet the catastrophic stop for the entire position to Last-Add − 2×N (the script and HUD show Proj Stop if Add so you know where it will land). Never move it lower.
Pro tip: If your broker supports OTO/OTOCO:
• OTO parent = Entry stop-limit.
• On fill, fire an OCO with the N2 stop (no target), and also stage child stop-limits for Add-1 / Add-2 / Add-3 with the correct sizes. If your broker can’t chain that deep, just use the script’s alerts (Entry/Add-1/Add-2/Add-3/Exits) to place/adjust orders quickly.
4) Exits (two layers)
• Catastrophic (always on): the N2 stop you’re ratcheting (Last-Add − 2×N).
• Trend exits (runner):
• S1: 10-low close (HUD shows it).
• S2: 20-low close (HUD shows it).
• Profit-taking (optional): sell ~50% at +2.5R to +3R vs current N2; let the runner trail with 10-low/20-low. You can keep N2 as a hard backstop.
5) Should you pre-set everything or buy live?
Both work; pick the style that fits you:
Preset (Turtle-pure, rules-based)
• ✅ You won’t miss the breakout; minimal discretion.
• ✅ Broker handles fills even if you’re away.
• ⚠️ You may get the occasional intraday “poke” (use confirmClose + place after close if you want fewer).
Buy on break manually
• ✅ Lets you check tape/volume or any extra gates before clicking.
• ⚠️ Higher chance of slippage or of simply missing the trigger.
A nice hybrid: place the Entry order, then arm Add-1/2/3 when price is nearing each rung and the HUD shows Suggested AddShares > 0 (green risk read).
⸻
6) Quick checklist per trade
1. System: S1 or S2?
2. Levels: Entry / Add-1 / Add-2 / Add-3 / 10-low / 20-low / N2 (rounded).
3. Sizing: confirm RiskCap/PosCap; HUD shows Suggested AddShares and limiter.
4. Orders:
• Parent Entry stop-limit.
• N2 stop (rounded).
• Stage adds (stop-limits) with sizes from HUD.
5. On fill: ratchet stop to Last-Add − 2×N; adjust remaining adds and sizes.
⸻
7) Example with your MU position (pattern)
• You’re already in: set entryQty and entryPman in the inputs to match your fill.
• HUD now focuses on Next Rung, Suggested AddShares, and Proj Stop if Add.
• If Suggested AddShares = 0 and limiter says RiskCap or PosCap, you’ll still see the next rung price and Proj Stop if Add so you can decide whether to override.
⸻
Bottom line
• Entry: buy the Donchian breakout + 0.1N with a stop-limit (Turtle style).
• Adds: only at +0.5N steps, sized by HUD; not on every future Donchian break.
• Stops: keep (and ratchet) the N2 catastrophic; trail runner on 10-low / 20-low.
If you want, tell me your broker/platform and I’ll map this to exact order ticket types (stop-limit/OTO/OCO) and a tiny checklist you can keep next to your screen.

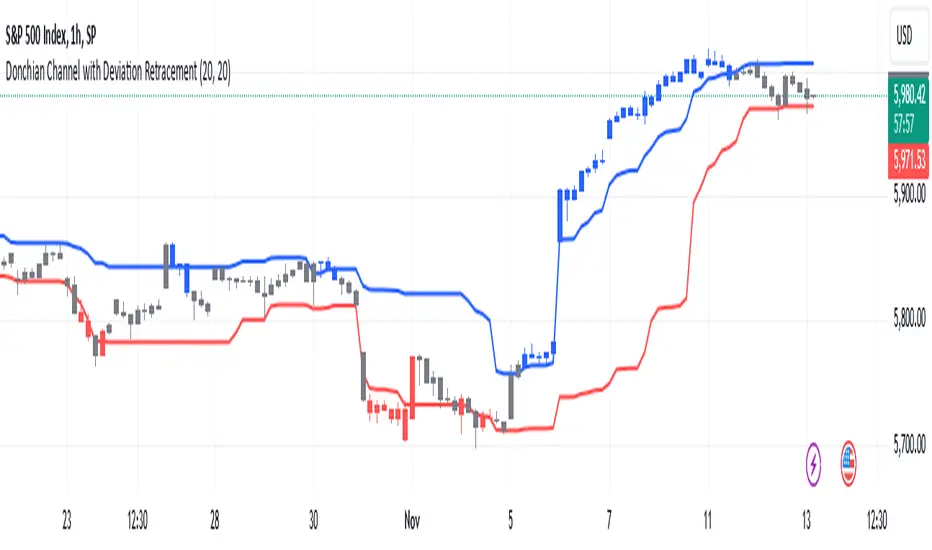
RB Donchian Channel with Deviation RetracementBased on the Donchian Channel, this trading indicator leverages deviation retracements within the channel to identify strategic exit points and capture directional momentum. The Donchian Channel plots the highest high and lowest low over a specified period, creating a range that helps traders monitor price movements. By focusing on retracements within this range, the indicator allows traders to pinpoint exit levels, minimizing potential losses or securing gains as trends fluctuate. It uses a color-coded system to enhance readability and quick decision-making: blue indicates a long position, while red signals a short position. This approach to using retracements within the Donchian Channel provides a structured method for traders to follow momentum shifts and make data-driven trading choices.
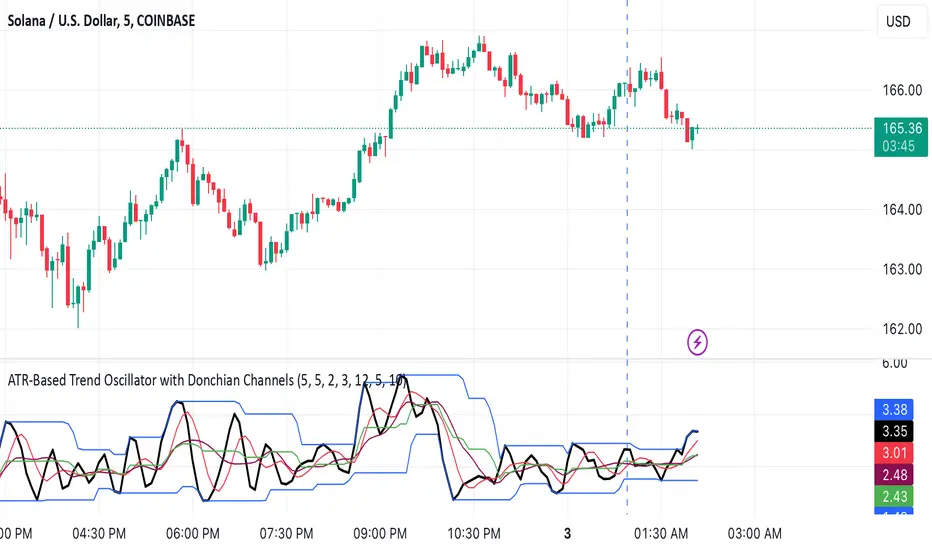
ATR-Based Trend Oscillator with Donchian ChannelsThis script, my Magnum Opus, combines the best elements of trend detection into a powerful ATR-based trend strength oscillator. It has been meticulously engineered to give traders a consistent edge in trend analysis across any asset, including highly volatile markets like crypto and forex. The oscillator normalizes trend strength as a percentage of ATR, smoothing out noise and allowing the oscillator to remain highly responsive while adapting to varying asset volatility.
Key Features:
ATR-Based Oscillator: Measures trend strength in relation to Average True Range, which enhances accuracy and consistency across different assets. By normalizing to ATR, the oscillator produces stable and reliable values that capture shifts in trend momentum effectively.
Dual Moving Averages for Smoothing: This script features two customizable moving averages to help confirm trend direction and strength, making it adaptable for short- and long-term analysis alike.
Donchian Channels for Strength Bounds: A Donchian Channel over the smoothed trend strength oscillator visually bounds strength levels, enabling traders to spot breakout points or reversals quickly.
Ideal for Multi-Asset Trading: The versatility of this indicator makes it a perfect choice across various asset classes, from stocks to forex and cryptocurrencies, maintaining consistency in signals and reliability.
Suggested Pairing: Use this oscillator alongside a directional indicator, such as the Vortex Indicator, to confirm trend direction. This pairing allows traders to understand not only the strength but also the direction of the trend for optimized entry and exit points.
Why This Indicator Will Elevate Your Trading: This trend strength oscillator has been refined to provide clarity and edge for any trader. By incorporating ATR-based normalization, it maintains accuracy in volatile and steady markets alike. The Donchian Channels add structure to trend strength, giving clear overbought and oversold signals, while the two moving averages ensure that lag is minimized without sacrificing accuracy.
Whether you're scalping or trend-trading, this oscillator will enhance your ability to detect and interpret trend strength, making it an essential tool in any trading arsenal.
Reversed Choppiness Index with Donchian Channels and SMAIn the chaotic world of trading, where every tick can lead to joy or despair, traders yearn for clarity amid the noise. They crave a mechanism that not only reveals the underlying market trends but also navigates the turbulent waters of volatility with grace. Enter the Reversed Choppiness Index with Donchian Channels and SMA Smoothing—a sophisticated tool crafted for those who refuse to be swayed by the whims of market noise.
This innovative script harnesses the power of the Choppiness Index, flipping it on its head to unveil the true direction of price movement. Choppiness, in its traditional form, indicates when the market is stuck in a sideways range, characterized by erratic price movements that can leave traders bewildered. High choppiness often signals confusion in the market, where prices oscillate without a clear trend, leading to potential losses. Conversely, low choppiness suggests a trending market, whether bullish or bearish, where trades can yield consistent profits. By reversing the Choppiness Index, this tool highlights lower choppiness levels as opportunities for selling when the market shows stability and momentum—perfect for traders looking to enter or exit positions with confidence.
The Donchian Channels serve as reliable markers, defining the boundaries of price action and helping to paint a clearer picture of market dynamics. Traders should look for breakouts from these channels, which may indicate a significant shift in momentum. When the Reversed Choppiness Index trends lower while price breaks above the upper Donchian Band, it may signal a strong buying opportunity, while a rise in choppiness alongside price dipping below the lower band can indicate a potential selling point.
But that's not all—this tool features a dual-layer of smoothing through two distinct Simple Moving Averages (SMAs). The first SMA gently caresses the Reversed Choppiness Index, softening its edges to reveal the underlying trends. The second SMA adds an extra layer of finesse, ensuring traders can spot significant changes with less noise interference.
In a landscape filled with fleeting opportunities and unpredictable swings, this script stands as a beacon of stability. It allows traders to focus on what truly matters—seizing profitable moments without getting caught in the crossfire of volatility. By understanding the dynamics of choppiness through this reversed lens, traders can more effectively navigate their strategies, capitalizing on clearer signals while avoiding the pitfalls of market noise. Embrace this tool and transform the way you trade; the market's whispers will no longer drown out your strategies, paving the way for informed decisions and greater success.

FVG Donchian Channel strategy30min FVG + Donchian Channel strategy
buy sell by 30min fvg
and stoploss , take profit by Donchian Channel
Run the strategy on the 1min timeframe!

QZ Trend (Crypto Edition) v1.1a: Donchian, EMA, ATR, Liquidity/FThe "QZ Trend (Crypto Edition)" is a rules-based trend-following breakout strategy for crypto spot or perpetual contracts, focusing on following trends, prioritizing risk control, seeking small losses and big wins, and trading only when advantageous.
Key mechanisms include:
- Market filters: Screen favorable conditions via ADX (trend strength), dollar volume (liquidity), funding fee windows, session/weekend restrictions, and spot-long-only settings.
- Signals & entries: Based on price position relative to EMA and EMA trends, combined with breaking Donchian channel extremes (with ATR ratio confirmation), plus single-position rules and post-exit cooldowns.
- Position sizing: Calculate positions by fixed risk percentage; initial stop-loss is ATR-based, complying with exchange min/max lot requirements.
- Exits & risk management: Include initial stop-loss, trailing stop (tightens only), break-even rule (stop moves to entry when target floating profit is hit), time-based exit, and post-exit cooldowns.
- Pyramiding: Add positions only when profitable with favorable momentum, requiring ATR-based spacing; add size is a fraction of the base position, with layers sharing stop logic but having unique order IDs.
Charts display EMA, Donchian channels, current stop lines, and highlight low ADX, avoidable funding windows, and low-liquidity periods.
Recommend starting with 4H or 1D timeframes, with typical parameters varying by cycle. Liquidity settings differ by token; perpetuals should enable funding window filters, while spot requires "long-only" and matching fees. The strategy performs well in trends with quick stop-losses but faces whipsaws in ranges (filters mitigate but don’t eliminate noise). Share your symbol and timeframe for tailored parameters.

CTA-min D1 — Donchian 55/20 Trend Breakout (ATR Risk)What it is
A clean, daily trend-following breakout inspired by classic CTA/Turtle logic. It buys strength and sells weakness, then lets winners run with a channel-based trailing stop. No curve-fitting, no clutter—just rules.
How it trades
Timeframe: Daily (D1)
Entry: Close breaks the previous 55-bar Donchian channel (above for longs, below for shorts).
Exit/Trail: Trailing stop at the 20-bar Donchian channel on the opposite side (no fixed TP).
Risk: Initial stop = ATR(N) × stopMult (ATR is smoothed). Position size risks riskPct% of equity based on stop distance.
Labels: “BUY/SELL” only on the entry bar; “STOP BUY/STOP SELL” only on the exit bar.
Pyramiding: Off (one position at a time).
Regime Alignment with EMAs (recommended filter, not enforced by code)
Add EMA 50 and EMA 200 to the D1 chart.
Long bias: take BUY signals only when EMA50 > EMA200 (bullish regime).
Short bias: take SELL signals only when EMA50 < EMA200 (bearish regime).
Optional: for extra selectivity, require the H4 EMAs (50/200) to align with D1 before acting on a signal.
Inputs
entryN (55), exitN (20), atrLen (20), atrSmooth (10), stopMult (2.0), riskPct (0.5%–1.0% recommended).
Works well on (tested by user)
BTCUSD (Bitcoin), EURUSD, GBPJPY, NAS100/US100, USDJPY, AUDUSD, XAGUSD (Silver), US30 (Dow), JP225 (Nikkei), EURGBP, NZDUSD, EURCHF, USDCHF.
How to use
Apply to D1 charts. Review once per day after the daily close and execute next session open to mirror backtest assumptions. Best used as a portfolio strategy across multiple uncorrelated markets. Use the EMA alignment above as a discretionary regime filter to reduce false breakouts.
Notes
For educational use. Markets involve risk; past performance does not guarantee future results. Use responsible position sizing.

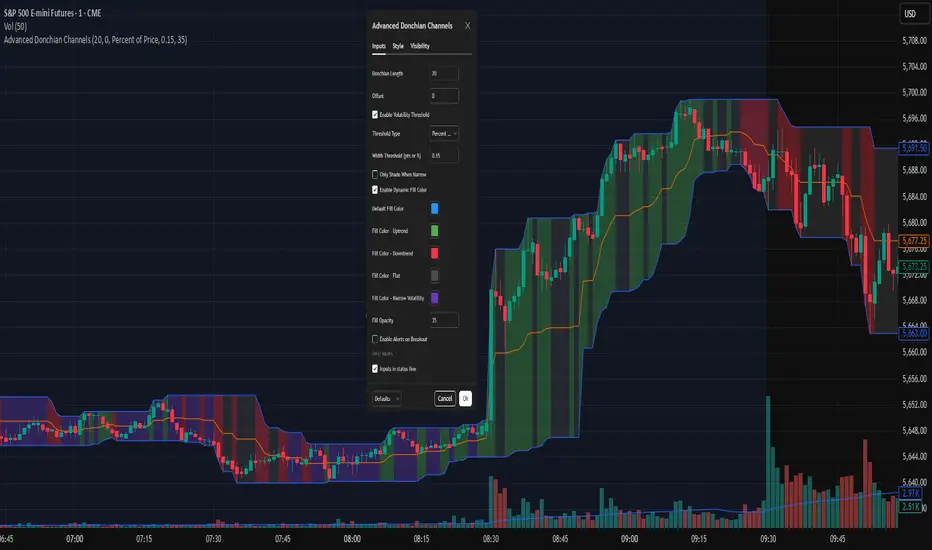
Advanced Donchian ChannelsJust an indicator I got ChatGPT to cook up for my own use, sharing it in case anyone else finds it useful. I have included a screenshot of my own settings as well for reference.
This indicator enhances the classic Donchian Channel with powerful contextual features to support modern breakout and volatility-based trading strategies.
🔹 Core Features:
Donchian Bands: Plots the highest high and lowest low over a configurable lookback period.
Dynamic Fill Shading:
- Color-coded based on the slope of the midline (Basis): Default settings are Green for uptrend, Red for downtrend, Silver for flat, Gray for narrow volatility.
- All fill colors are fully customizable.
Volatility Filter:
- Detects when the channel width is narrow using either a fixed value or a percentage of price.
- Optionally shades only during low-volatility (compression) periods.
Customizable Style:
- Adjustable opacity, offsets, and color settings to suit your charting style.
🛠 Use Cases:
- Spot potential breakout setups after periods of low volatility.
- Identify trend direction via basis slope shading.
- Combine with momentum or volume tools for high-probability entries.
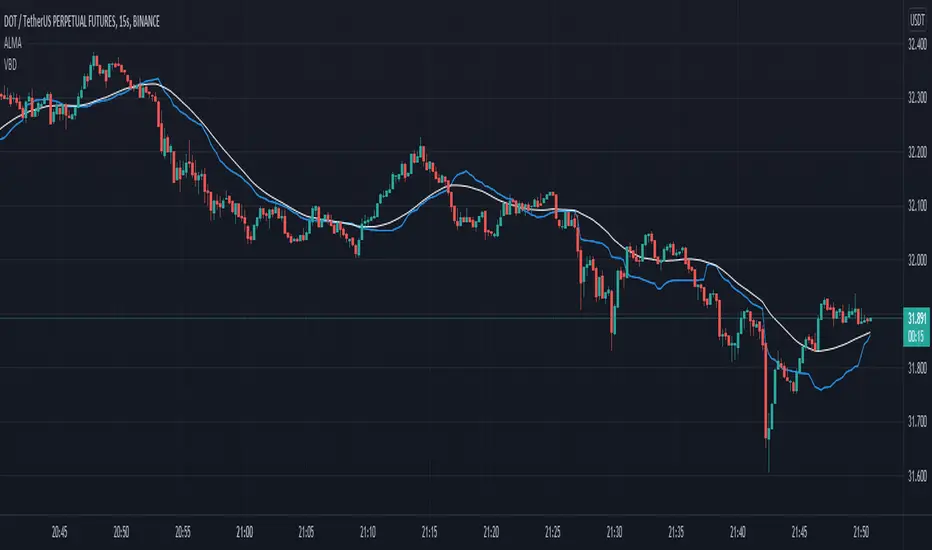
Volume Based DonchianA simple experiment that mixes volume and Donchian's algorithm.
In this version I have implemented a more elegant version of the formula, using the VWMA function instead of spelling out the steps.
I have kept both formulas for educational purposes.
I also plot an Alma Moving Average, how you can see a 16 periods Volume Based Donchian is pretty similar to a 80 period Alma. I think it could be nice stuff if you wanna ask me something write me.
Noro's Donchian StrategyThe strategy uses Donchian price channel . The channel is shown in blue lines. All other lines use Donchian channel too. The red line is the center line between the channel lines. The lime line is a few percent further away. The percentage is set by the user in the strategy settings.
Lines
Blue line - to open position using market stop order
Lime line - take-profit (limit order)
Red line - stop-loss (market stop order, trailing-stop)
For
- BTC /USD, XBT/USD, ETH/USD (need USD)
- timeframe: 1h or 4h

Turtle trading strategy (Donchian/ATR)Strategy based on Turtle Trading Strategy from William Eckhardt and Richard Dennis
- Considers entering trades on breakout of Donchian channels (upper for long, lower for short) (Default length = 20 for daily)
- Considers exiting trades on breakout of Donchian channels (lower for long, upper for short) with lower length (10 for daily)
- Uses 2N ATR (default) as stop loss

Trend Following with Donchian Channels and MACDThis is a trend following system based on the Donchian Channels. Instead of using a simple moving average crossover, this system uses the MACD as the trendfilter:
Long positions:
* Price makes a new 50 day high,
* The MACD-line crosses above or is above the Signal-line.
* Both the MACD and the Signal-lines are above the zero-line.
Short positions:
* Price makes a new 50 day low,
* The MACD-line crosses below or is below the Signal-line.
* Both the MACD and the Signal-lines are below the zero-line.
Stoploss:
The initial and the trailing stoploss are 4 ATRs away from the price.

VWMA Donchian ChannelsPlots Donchian Channel based on VWMA. Trend strength analysis tool.
Note that the VWMA is based on the ohlc not the close.
Strong trends will break out of this channel consolidation will remain inside of the channel. The Channel Midline may be a good bull bear indicator.
As with most trend indicators longer timeframes for the market you are trading will be best. But this can work on all chart time frames

James Donchian ChannelsThis derived from the basis of a Donchian channel with a SMA smoother applied to the indicator.
Running Donchian ChannelsExperimental script to plot a forecast for the Donchian Channels indicator.
By using show_last = 2 , the forecast shows a solid line, this gets messed up on the bar when a new high or low is made.. Like the image below. I don't know how to fix that, please tell me if you do :)

Complete turtles strategy based on the donchian channelsDear Traders and investor,
I want to demonstrate scrypt of the iconic "trend following strategy" coded by my
The main idea was borrowed from the book "Way of the Turtle: The Secret Methods that Turned Ordinary People into Legendary". The strategy is based on the donchian channels and is one of the oldest and easiest strategy in the using. Also strategy include risk managment and trends filter which prevent false entries and high drawndowns. The results are based on the period from 2006 to present, but you can also change timeframe and period of backtesting.
Best regards,
Vlad

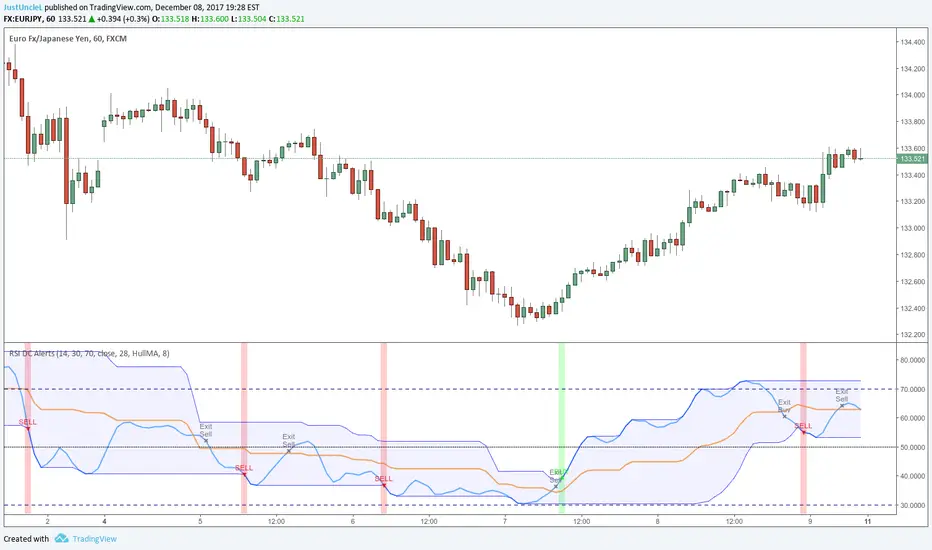
RSI Donchian R1 Alerts by JustUncleLThis study is based on an idea by presented by RicardoSantos and JayRogers of using Donchian Channel (DC) on the RSI curve. The idea being that when RSI passes through the DC centre and touches the Highest/Lowest DC then price action tends to follow in the same direction and stay there until the RSI crosses DC centre line again.
This script expands on the original idea by including alert and exit signals based on the above rules. These alerts are also filtered by the rule: they must be within the Oversold and Overbought boundaries of the RSI.
There is also the option of applying MA smoothing to the RSI curve, the HullMA (8) is recommended (default).
Each Entry and Exit signal creates an Alertcondition that can be picked up by the TradingView Alarm system.
TIP: Remember this type of Trading technique only works well in a trending market. Do not try to trade this technique in a ranging/flat market.
[RS]MTF Donchian Range Wave Sync V1EXPERIMENTAL: using Donchian channels with diferent lengths to extract multiple time frame's to extract price in range rates. the title may be a tiny bit misleading tho -_-''
update: reversed colors, joined the line zone space to make the waves visually stand out more.

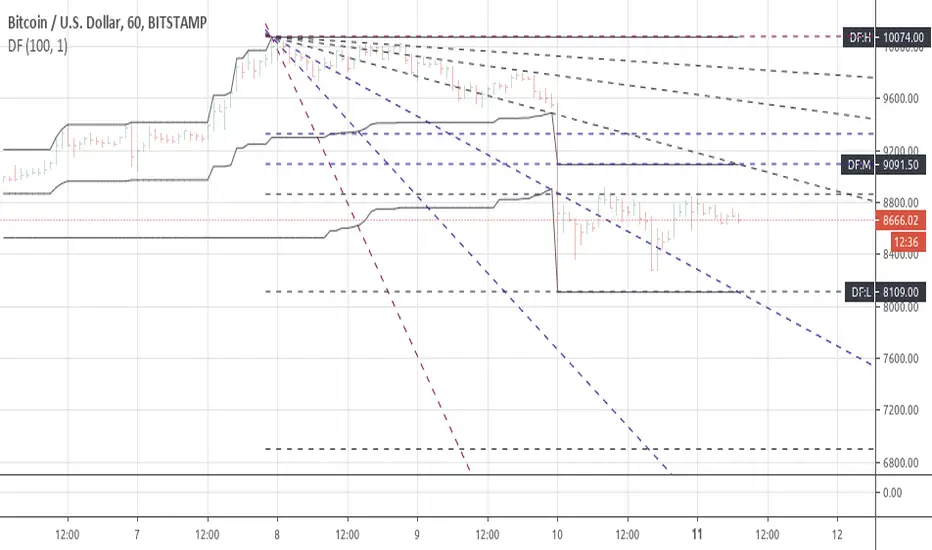
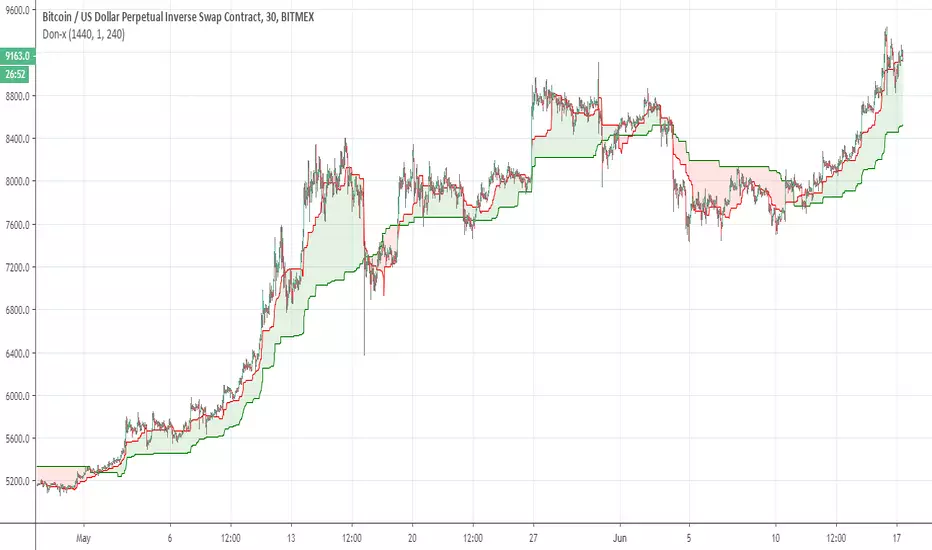
Don-xSimple indicator that nased on two donochian bases each calculated slight different with MTF , where we based a faster of 240 min over slower of daily one on each other and we put on lower time frame (30 min, 1 hour or 2 hour )
hence we can see the bullish trend (green ) or bearish trend (green ) more easy
can be used as by its own (slight lag ) or with other indicators to see where the asset direction is
Donochian zonesThis indicator give the ratio between the high and low of donochian channel and if we take ratio and add it to each other then we can calculate if it + meaning bullish trend or negative meaning bearish trend
using non repainting MTF we can see the zone of the channel at different time set
we can use this indicator to filter bad signal or make it stand alone
here example of amazon stock with 360 min mtf over one hour graph
here facebook 240min over 15 min graph

Contrarian DC Strategy - w Entry SL Pause and TrailingStopDonchian Channel Setup:
The strategy uses a tool called the Donchian Channel. Imagine this as two lines (bands) on a chart that show the highest and lowest prices over a certain number of past trading days (default is 20 days).
There's also a centerline, which is the average of these two bands.
Entry Conditions for Trades:
Buying (Going Long): The strategy considers buying when the price touches or falls below the lower band of the Donchian Channel. However, this only happens if there has been a pause after a previous losing trade. This pause is a number of candles where no new trades are taken.
Selling (Going Short): Similarly, the strategy considers selling when price reaches or exceeds the upper band of the Donchian Channel. Again, this is subject to a pause after a losing trade.
Stop Loss and Take Profit:
Each trade has a "Stop Loss" and "Take Profit" set. The Stop Loss is a preset price level where the trade will close to prevent further losses if the market moves against your position. The Take Profit does the same but locks in profit if the market moves in your favor.
The Stop Loss is set based on a percentage of the price at which you entered the trade.
The Take Profit is determined by the Risk/Reward Ratio. This ratio helps balance how much you're willing to risk versus the potential reward.
Trailing Stop Loss:
When a trade is profitable, the strategy should involve a "Trailing Stop Loss." This means the Stop Loss level moves (or trails) the price movement to lock in profits as the market moves in your favor.
For a buy trade, if the price moves above the centerline of the Donchian Channel, the Trailing Stop Loss should be adjusted in the middle between the entry price and the centerline. Viceversa for a sell trade, it should be adjusted in the same way if the price goes below the centerline.
IMPORTANT: There's no allert for the trailing stop at the moment.
Post-Stop Loss Pause:
If a trade hits the Stop Loss (i.e., it's a losing trade), the strategy takes a break before opening another trade in the same direction. This pause helps to avoid entering another trade immediately in a potentially unfavorable market.
In summary, this strategy is designed to make trades based on the Donchian Channel, with specific rules for when to enter and exit trades, and mechanisms to manage risk and protect profits. It's contrarian because it tends to buy when the price is low and sell when the price is high, which is opposite to what many traders might do.
