Daily EMA TrendThis show whether price is above or below the set DAILY EMAs that you set. Default is 200, 100, 50 & 20. อินดิเคเตอร์ Pine Script®โดย crowewilliam27
Daily Backtest Pivots Problem with the built-in Pivot Points Standard indicator in backtesting/replay mode: The default "Pivot Points Standard" indicator is excellent on live charts, but it becomes completely unusable for proper backtesting or bar-replay because it always calculates and displays the current day’s pivot points (P, R1, R2, S1, S2, etc.) using the high/low/close of the still-forming current day — even when you're replaying historical bars. Example: When replaying or backtesting September 8 at 08:00 (Asian session), the indicator already shows the final R1, R2, S1, S2 for the entire September 8 daily candle, even though in real trading at that moment you would have no idea where the day will close or what the final daily range will be. This creates massive look-ahead bias and makes any strategy that uses daily pivots impossible to test realistically. Desired behavior (historical accuracy): During backtesting or bar replay, the indicator should only plot: The previous day’s completed pivot levels (which were actually known at the start of the current day) NO current-day pivot levels at all (or only plot them after the daily candle is closed) Many custom pivot scripts already do exactly this (they only show the prior day’s levels throughout the current day), which is why people abandon the built-in indicator for backtesting. อินดิเคเตอร์ Pine Script®โดย The_Tokyo_Protocolที่อัปเดต: 6
Daily AVWAPsDaily AVWAPs is designed for intraday and swing traders who track institutional volume benchmarks. Instead of a single "rolling" line that resets continuously, this indicator identifies the starting timestamp of the last 5 trading sessions and draws five distinct Anchored VWAPs from those exact moments. This allows traders to see exactly where the average volume-weighted price stands for the current day (1D), yesterday (2D), and the three days prior (3D, 4D, 5D) simultaneously. Key Features Polyline Visualization: Unlike standard indicators that plot historical values for every bar (creating a messy "sawtooth" effect), this script uses Pine Script Polylines. It draws clean, static lines starting from the specific anchor point to the present price, mimicking the manual "Anchored VWAP" drawing tool. Dynamic Session Detection: The script contains zero hardcoded dates. It automatically detects when a new trading day begins based on the chart data. It works seamlessly across all asset classes (Stocks, Crypto, Futures) and automatically adjusts for weekends, holidays, and irregular trading weeks without manual updates. Unified Color Control: Input colors are synchronized. Changing a color in the settings menu updates both the chart line and the price scale label instantly. Toggle Controls: Individual checkboxes allow you to toggle any specific VWAP (1D through 5D) on or off to keep your chart clean. How to Use Trend Strength: When the 1D, 2D, and 3D VWAPs are "fanning out" in alignment, the trend is strong. Mean Reversion: In a sideways market, price often gravitates back to the 5-Day VWAP as a "value area." Support & Resistance: Watch for price to respect the VWAP of a previous high-volume day (e.g., bouncing off the 3D VWAP during a pullback). Settings Source: Select the price data source (default is OHLC4) . Colors & Toggles: Use the checkboxes to enable/disable specific lines. Customize the color for each specific day's AVWAP directly in the Inputs tab. This indicator was adapted and repurposed from the original work by The_Last_Gentleman . Technical Note: This indicator is optimized for intraday timeframes (1m, 5m, 15m, 1H). Because it uses polyline and array logic to scan specific session timestamps, it calculates exclusively on the most recent bar to maintain high performance.อินดิเคเตอร์ Pine Script®โดย ombvexx27ที่อัปเดต: 8
Daily Separator_Yoot HobbizSimply helps you separate each trading day — a clean, visual indicator that marks daily sessions so you can read price action faster and stay focused on what really matters. A simple indicator that clearly separates each trading day, making your charts easier to read and your decisions easier to take.อินดิเคเตอร์ Pine Script®โดย YootTraderที่อัปเดต: 23
Daily & Average Dollar VolumeCalculates the daily and average (20D) $ volume. Fully customizable appearence and can be placed in any corner.อินดิเคเตอร์ Pine Script®โดย SenorBufoAlvariusที่อัปเดต: 31
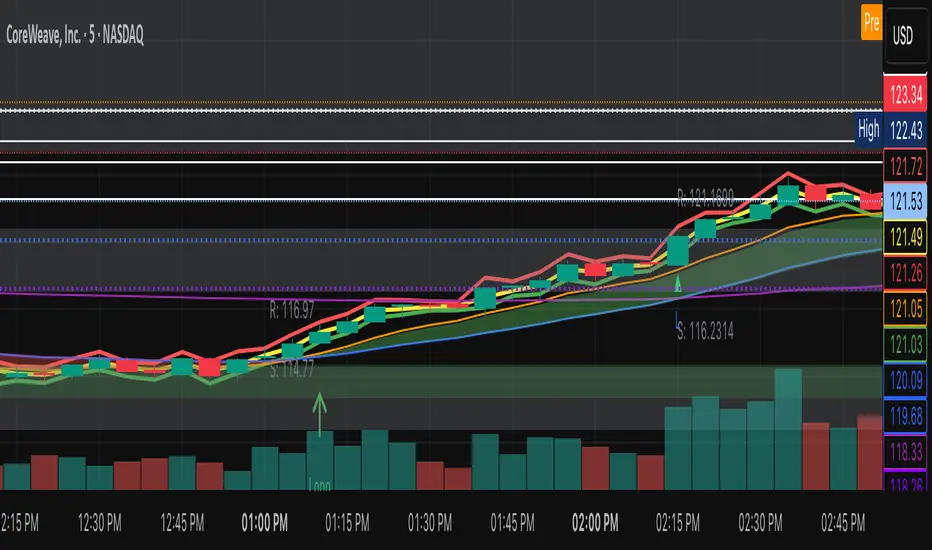
Daily ATR vs Move (black & white) + PipsTop of Chart, Mid. Gives the user an idea of what trend is doing and how the current price compares to daily ATR. Used on this example below to indicate we are within the bottom range for the day, and price has potential to move up without worry of exhaustion.อินดิเคเตอร์ Pine Script®โดย thetrendtraderfxที่อัปเดต: 10
Daily ATR SL/TP Labels on ChartATR-Based Stop Loss & Take Profit Calculator This script calculates 20% of the Average True Range (ATR) to determine optimal Stop Loss and Take Profit levels. Designed to assist traders in setting precise risk parameters when placing Buy/Sell orders based on daily market volatility. Key Features: Computes 20% of ATR value for proportional risk management Provides dynamic SL/TP levels aligned to current market conditions Optimised for Daily timeframe analysis to capture full trading day range Recommended Usage: Apply on Daily (1D) timeframe for most accurate results, as this captures the complete intraday price movement and provides reliable volatility measurements for position sizing and risk management decisions.อินดิเคเตอร์ Pine Script®โดย IamAryTrades25
Daily Midnight Marker (NYC)This indicator automatically plots a vertical line at midnight (00:00) New York time on every trading day. Each line is drawn in light gray to mark the start of a new day, helping traders visually separate daily sessions. A weekday label (e.g., Monday, Tuesday, Wednesday...) is displayed to the right of each line, making it easy to identify daily transitions when analyzing intraday price action or reviewing trading sessions. Perfect for traders who: Trade based on daily session structure or pre-market setups Use NY time as a market reference Prefer a clean and minimal visual day separatorอินดิเคเตอร์ Pine Script®โดย willianborges3
Daily Range Zone This indicator shows the daily range (high to low) for each day. Every day has its own unique color, making it easy to see each day’s price range at a glance.อินดิเคเตอร์ Pine Script®โดย Hevrixi26
Daily Pivot Points LEVELS S-RThis indicator plots daily pivot points based on the previous day’s high, low, and close. It displays the main pivot line, as well as the first levels of support (S1) and resistance (R1), with optional second levels (R2, S2) for additional reference. Ideal forอินดิเคเตอร์ Pine Script®โดย swpittillo031628
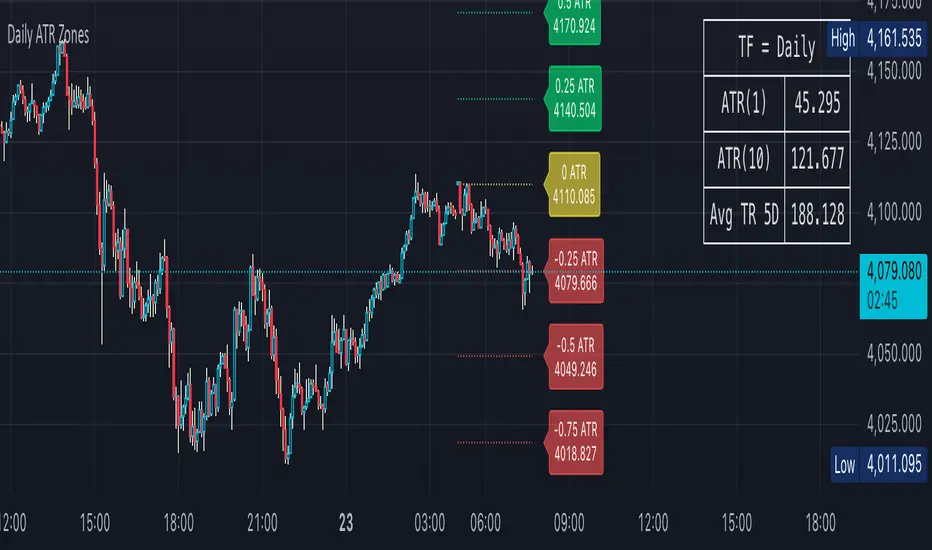
Daily ATR Zones Dynamic Daily ATR Projection Zones ### **Description:** This indicator projects potential price levels for the current trading day based on the Average True Range (ATR) of the previous day. It is designed to help intraday traders visualize daily volatility and identify key potential support, resistance, or target levels that are fixed for the entire session and do not repaint. **How It Works** The logic is based on two key components: a stable base price and a reliable volatility measure. * **Base Price:** The indicator uses the **Open price of the current day** as the central anchor point for all projections. * **Volatility Measure:** The calculation uses the final, completed **ATR value from the previous day**. This ensures that the projected zones are constant throughout the current trading day and are not subject to repainting. The projection levels are then calculated using the formula: `Current Day's Open + (Previous Day's ATR * Multiplier)` **Features** This script is fully customizable to fit your trading style: * **Customizable ATR Multipliers:** Easily define your own price zones by entering a comma-separated list of multipliers (e.g., `0.5, 1.0, 1.5, -0.5, -1.0`). * **Dynamic & Movable Labels:** The price labels are designed to stay on the right edge of the chart, ensuring they never obscure the current price action. * **Adjustable Label Position:** Use the "Label Horizontal Offset" setting to control how far the labels are positioned from the current bar, keeping your chart clean. * **Adjustable Label Size:** Choose from five different sizes (Tiny, Small, Normal, Large, Huge) to ensure the labels are perfectly readable on any device. * **Toggle Labels:** You can turn all labels on or off with a single checkbox. * **Full Color Customization:** Set unique colors for the positive (upper), negative (lower), and neutral projection zones. **How to Use** This tool can be integrated into various intraday trading strategies: * **Intraday Targets:** The projected levels can serve as potential take-profit or stop-loss targets for scalpers and day traders. * **Support & Resistance:** Watch for price reactions, such as bounces or rejections, at these ATR levels, as they often act as dynamic support and resistance zones. * **Volatility Gauge:** The zones provide a quick visual reference for how far the price has moved relative to its recent average daily range. For example, if the price reaches the `1.0 ATR` level, it has completed an "average" day's move.อินดิเคเตอร์ Pine Script®โดย kasapop56394ที่อัปเดต: 84
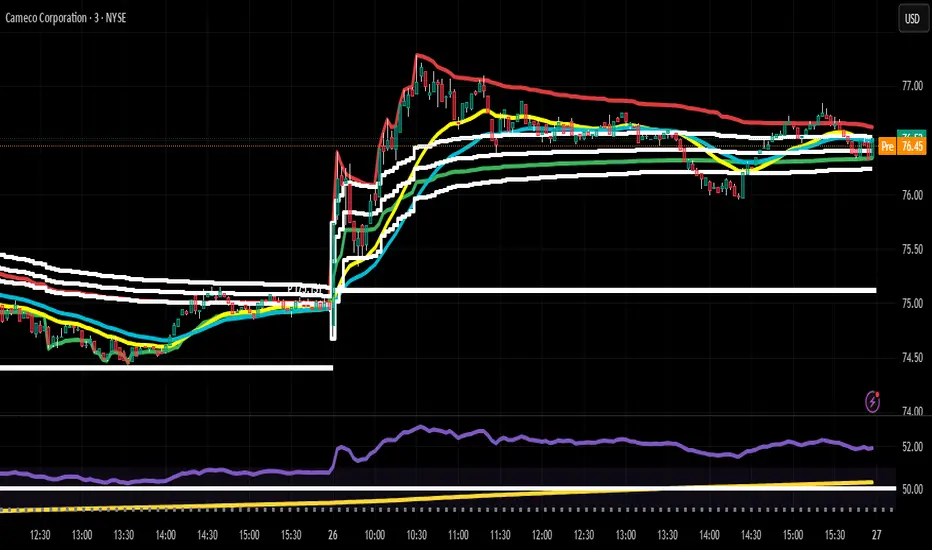
Daily Moving Average Levels on IntradayThis script draws the daily simple moving average levels on the intraday chart. By default it shows 20, 50 and 200 SMA. You can choose the MA you want.อินดิเคเตอร์ Pine Script®โดย Nevada_Bears5
Daily Moving AveragesThis indicator is overlays daily MAs over any intraday time-frame chart.อินดิเคเตอร์ Pine Script®โดย FerasDT4
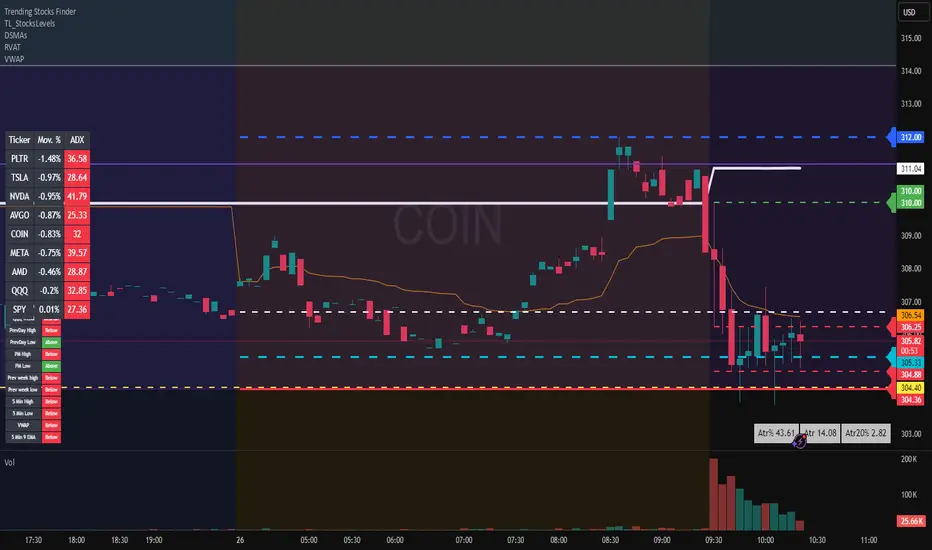
Daily ATR TrackerThis indicator calculates the daily ATR of the past 14 days. The ATR% indicates the range completed for the day. The ATR indicates the average daily range. The 20% ATR indicates the value of 20% of the daily ATR for retracement purposes.อินดิเคเตอร์ Pine Script®โดย Capt_Gongshow55614
Daily HOD / LOD Anchored VWAP (24/7 Markets)mart Daily HOD/LOD Anchored VWAP (Auto Detect + Alerts) This indicator automatically anchors VWAP at the High of Day (HOD) and Low of Day (LOD) for each session/day. No more manual anchoring — the script tracks intraday highs and lows in real-time and resets cleanly at the start of each trading day or session. ✨ Features ✅ Auto-anchored AVWAP at daily High and Low ✅ Works for stock markets (with fixed sessions) and crypto markets (24/7) ✅ Clean reset every session/day ✅ Separate AVWAP lines for HOD and LOD ✅ Customizable colors & line widths ✅ Alerts included 🚨 (get notified instantly when a new High/Low AVWAP starts) 📈 Use Cases Spot true intraday support/resistance levels Track where institutions may be defending positions Combine with price action, orderflow, or volume profile strategies Perfect for intraday trading, scalping, and swing entries ⚡ Alerts New HOD AVWAP → Fires when price makes a fresh high of day, starting a new anchored VWAP. New LOD AVWAP → Fires when price makes a fresh low of day, starting a new anchored VWAP. 🛠️ Settings Show/hide HOD or LOD VWAP Customize line colors and thickness Works seamlessly across stocks, futures, forex, and crypto 💡 Pro Tip: AVWAP from the high and low of the day often acts as a magnet for price. Watch how price reacts when revisiting these levels — confluence with other indicators = high-probability setups. ⚠️ Disclaimer: This script is for educational purposes only. It is not financial advice. Always manage your own risk.อินดิเคเตอร์ Pine Script®โดย hardik23joshi25
Daily Start Vertical Lines (≤1H)This indicator automatically plots vertical lines at the start of each new trading day, based on the selected chart’s timezone. Unlike the default daily session boundaries (which often start at 17:00 New York time), this tool ensures that lines are drawn precisely at 00:00 midnight of the chart’s timezone. 🔹 Features: Plots a vertical line at every new day start (midnight). Fully time-zone aware → lines adjust automatically when you change the chart’s timezone. Customizable line style, width, and color. Option to limit plotting to specific timeframes (e.g., show only on ≤ 1H charts). Lightweight & optimized (does not clutter higher-timeframe charts). 🔹 Use Cases: Quickly identify daily boundaries for intraday analysis. Helps scalpers and day traders align trades with new day opens. Useful for strategies that depend on daily session resets. This tool is especially helpful for traders who want clarity when working across different time zones.อินดิเคเตอร์ Pine Script®โดย saqlainmujtaba1120
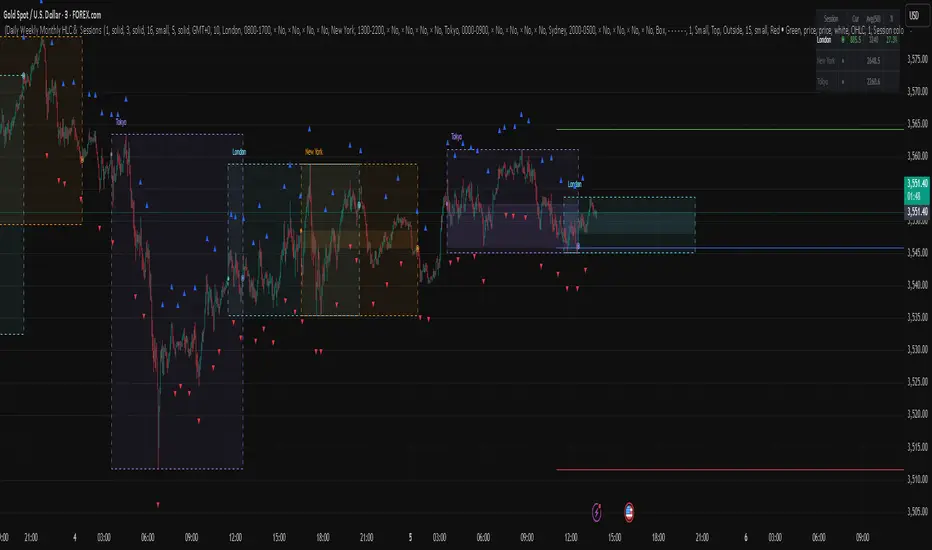
Daily Weekly Monthly HLC (بهداد)خطوط مهم روزانه هفتگی ماهانه This is an indicator that shows the closing lines and the highest and lowest prices for daily, weekly and monthly periods. In addition, we can divide the entire weekly period into several parts.อินดิเคเตอร์ Pine Script®โดย fasu1278ที่อัปเดต: 24
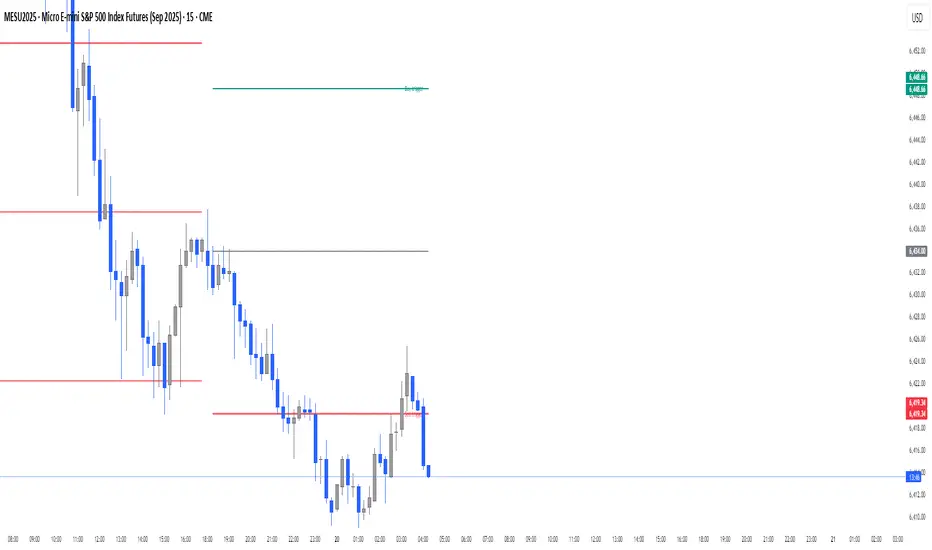
Daily Buy/Sell Triggers + ATR TargetsThis tool gives you a once-per-day, objective ATR map: Buy Trigger above the open, Sell Trigger below the open, clean ATR targets, and FULL ATR extremes. It’s designed for clarity, precision, and zero intraday repainting so you can plan the session and execute with confidence. This indicator prints a new, static grid of intraday levels every New York 18:00 (end of the NY trading day). The grid is anchored at the day’s open and spaced by the Daily ATR so you get tick-precise Buy Trigger, Sell Trigger, intermediate ATR targets, and the FULL ATR bounds for the session. The levels act as objective support/resistance and intraday measuring sticks for continuation, mean-reversion, and range expansion trades. What you see on the chart A thin midline at the Daily Open (anchor). Green lines above, red lines below, spaced at your chosen ATR multiples. Text at the far right for: Buy trigger Sell trigger FULL ATR (both sides) Intermediate targets are unlabeled to keep the chart clean (they’re still tradable S/R).อินดิเคเตอร์ Pine Script®โดย curlingking1211115
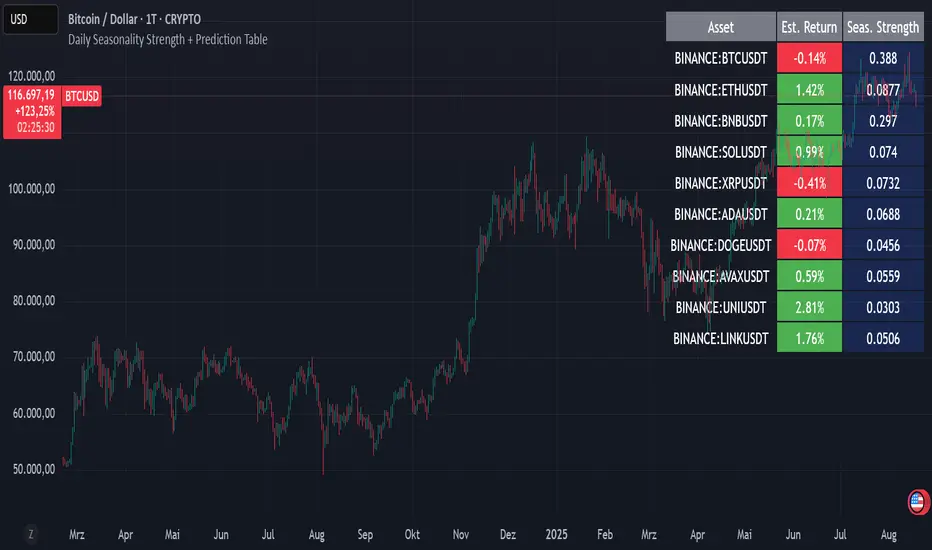
Daily Seasonality Strength + Prediction TableDaily Seasonality Strength + Prediction Table Return Estimates: This indicator uses historical price data to calculate average returns for each day (of the week or month) and uses these to predict the next day’s return. Seasonality Strength: It measures seasonality strength by comparing predicted returns with actual returns, using the inverse of MSE (higher values mean stronger seasonality). supports up to 10 assets This script is for informational and educational purposes only. It does not constitute financial, investment, or trading advice. I am not a financial advisor. Any decisions you make based on this indicator are your own responsibility. Always do your own research and consult with a qualified financial professional before making any investment decisions. Past performance is no guarantee of future results. The value of the instruments may fluctuate and is not guaranteed อินดิเคเตอร์ Pine Script®โดย Hutmacher4224
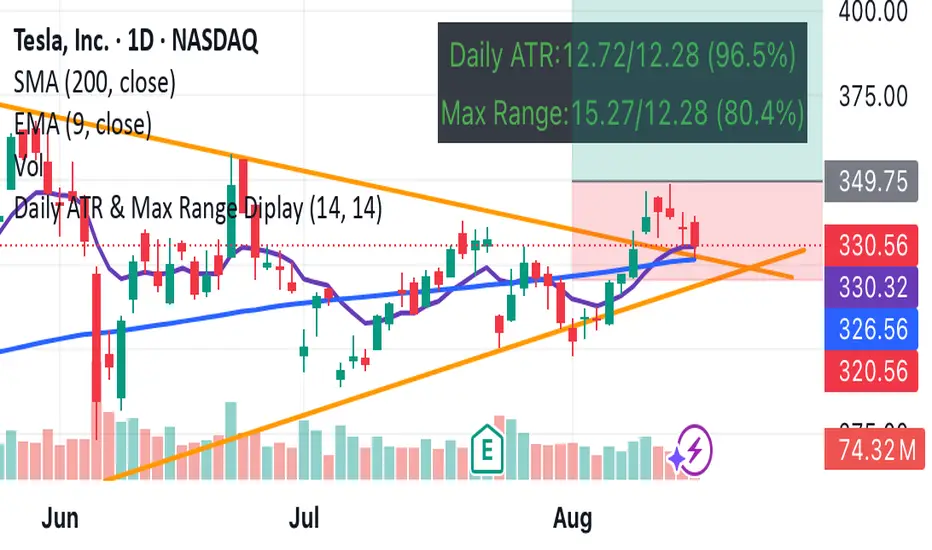
Daily ATR & Max Range DiplayShow how much daily range is left in % format on chartอินดิเคเตอร์ Pine Script®โดย anniechooac13
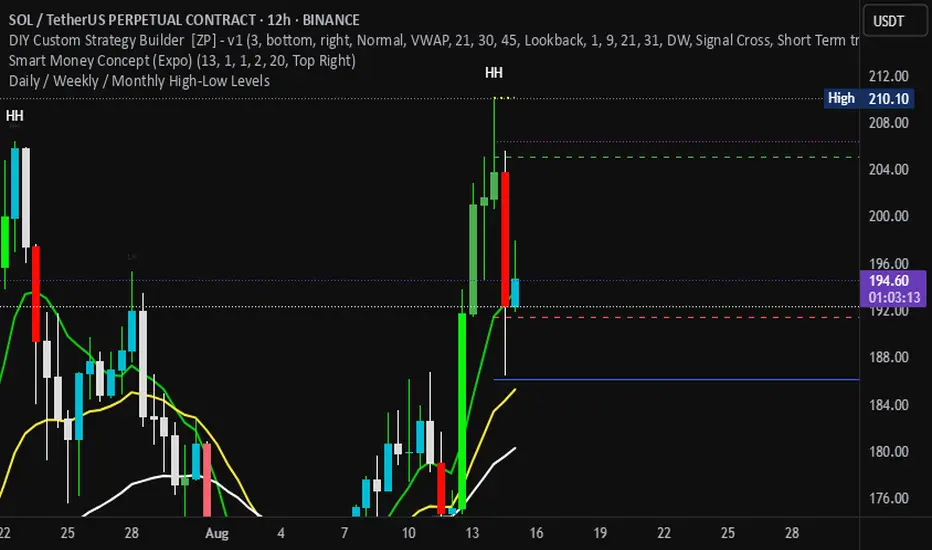
Daily / Weekly / Monthly High-Low Levels (Arindam )How it works: Daily levels are taken from the previous day. Weekly levels are from the previous week. Monthly levels are from the previous month. They extend across the chart for visual reference. You can customize colors, line styles, or whether they reset each session. Do you want me to also add labels on the right side (e.g., “Daily High”, “Weekly Low”) so the lines are clearly marked?อินดิเคเตอร์ Pine Script®โดย html1639357
Daily Pivot Points + R1 S1 R2 S2 with PricesThis indicator automatically plots daily pivot points (PP) along with the first and second resistance (R1, R2) and support (S1, S2) levels on your chart. Each level is clearly labeled with its price, making it easy to identify key areas for potential reversals or breakouts. Perfect for day traders and swing traders looking for reliable intraday support and resistance zones.อินดิเคเตอร์ Pine Script®โดย Jeffrey6651
Daily Levels3 simple daily levels Todays Open will label any historical points an yesterdays close There are plenty of these available but they all seemed overly complex so I adapted this to suit my needs This indicator plots customizable daily session levels (Today's Open, Previous High/Low/Close) on intraday charts, with options for historical days back, session start/close times, labels, colours, and visibility. Ideal for forex and stock traders analysing prior sessions.อินดิเคเตอร์ Pine Script®โดย epicurusMcPotที่อัปเดต: 11