MY_CME eod OI vs CFTC eow OIDaily e-o-d Open Interest as published by CME.
As CFTC COT Open Interest relates to last Tuesday, here you can have an idea how things evolved day-by-day since then.
As CME total OI is not accessibl as data, here I sum OI of the next 9 outstanding contracts, which gives a fair idea of the trend in OI
ค้นหาในสคริปต์สำหรับ "daily"


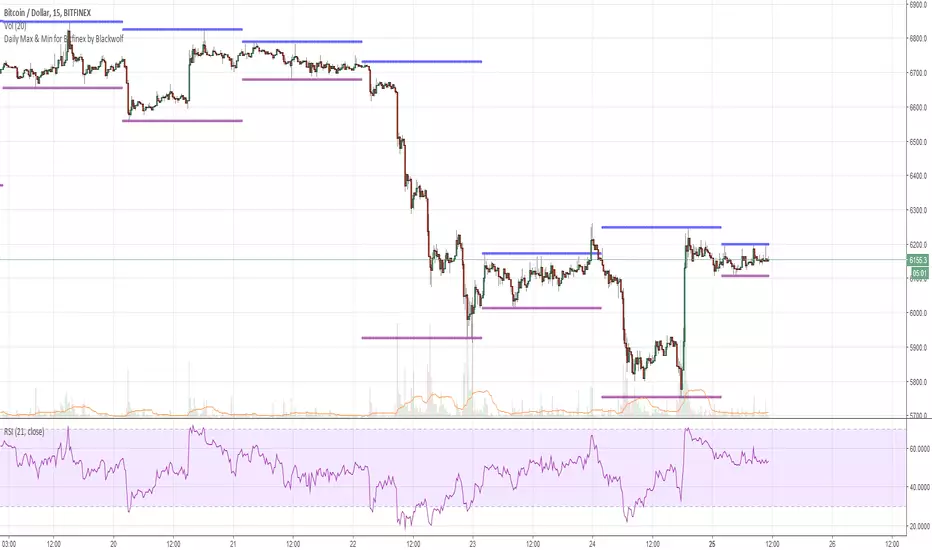
Daily Max & Min for Bitfinex by BlackwolfThis script shows the min and max price level of each day. It can be used also for support and resistance level.
Lo script mostra il prezzo massimo e minimo raggiunto nelle 24 ore. può essere utilizzato come idea per supporti e resistenze
MTF EMA Combo with Background ColorDaily/Weekly EMA combo for longer term trend direction, with combo background color for varying trend direction.

CMGB Pivot PointsDaily and weekly pivots.
Setting: specify how many candles are in a day (in the time frame you are using)
For example for 15m TF there are 91 (not 96) candles. When you get the number right, the lines will align nicely.


Daily SARThe image describes how to use the indicator fairly well, and I used 1 minute candles here, but it's best used on 1H candles.
There's a little bit of noise as the SAR updates, you can expect two movements before it settles. Ignore the first one, it is largely irrelevant except as a signal that the real movement is about to occur (and a hint at which direction).


Daily Average True Range OverlayPlots the upper and lower average true range away from the previous days close on all time frames.

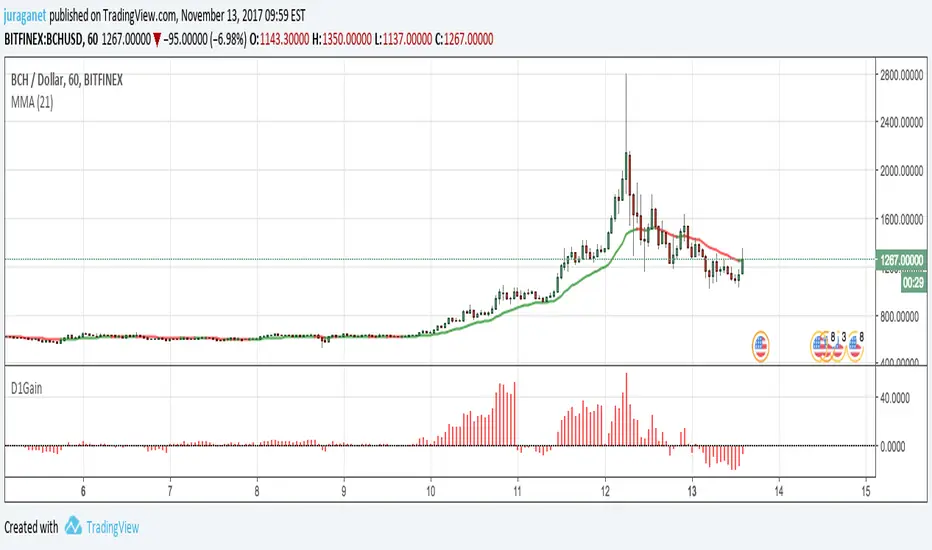
Daily GainPlot today's gain (%) of current security. It's a value of increase/decrease of current price compared to today's 00:00:00 candle open price.
I'm open for idea to improve this script. Drop me message or email to juraganet@gmail.com.
Daily one take and put toolthis script have two line
Each line acts as a line of support and resistance
판매용이 아닙니다. 댓글 남기시고 사용하세요~
사용법은 blog.naver.com

Daily Deviations (Lazy Edition)
Plots the standard deviation resistance/support lines.
Uses Previous days close and the VIX as the volatility factor.
credit to u/UberBotMan and u/Living_Granger for the idea and formulas

Daily Deviations (Self Input Version)
Plots the standard deviation resistance/support levels.
Input the previous settlement price and the implied volatility.
credit to u/UberBotMan and u/Living_Granger for the idea and formulas
(preview example is using settlement of 2420 and IV of 11)


Daily Returns & STDWhat happened last time when xx increased by xx%? - Start collecting some stats!
You can choose the ticker and the timeframe you're interested in

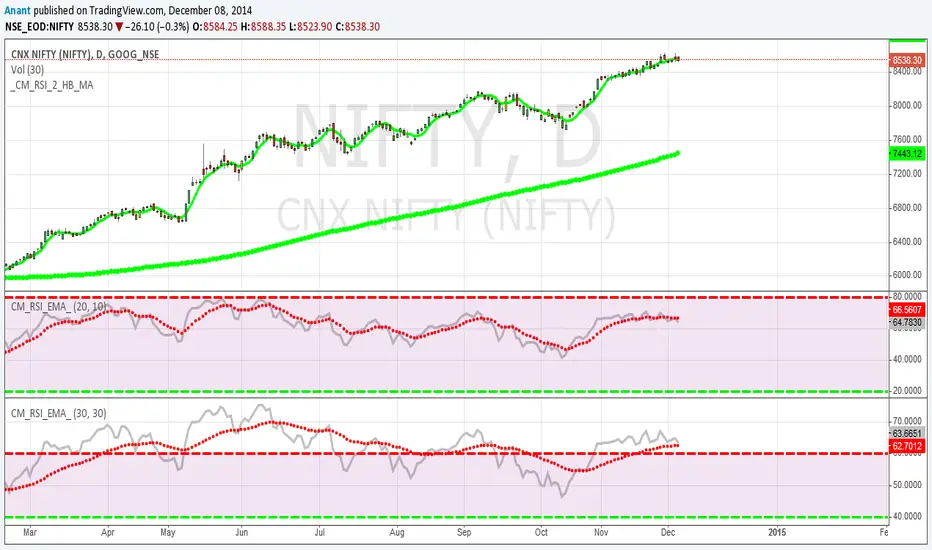
RSI Oversold/UndersoldThe study script will place GREEN BUY arrows BELOW oversold conditions and RED SHORT arrows ABOVE overbought conditions. You can configure the period
Most RSI(14) indicators use a 14-period, I prefer a 5-period. The period, overbought and oversold periods are settings that can easily be changed by adding this study to your chart and clicking the "gear" icon next to the study inside your chart.


Daily SMAThis pine script on intraday chart is exactly the same SMA as built-in MovingAverage on a 1Day chart (with the same lengths)


HS:- HA+BIAS📝 Daily Bias + Heikin Ashi Step Line (Notes)
1️⃣ Indicator Purpose
Combines Daily Market Bias with Heikin Ashi Average
Displays HA average as a STEP LINE WITH BREAKS
HA line changes color based on bias
Works on any timeframe
Bias logic is always calculated from Daily data
2️⃣ Heikin Ashi Calculation
Uses Heikin Ashi candles internally
Does not change chart candles
Formula used:
HA Average = (HA Open + HA Close) / 2
Provides a smoother price reference than normal candles
3️⃣ Daily Reference Levels
Uses previous day:
High
Low
These levels define market structure
Fetched using Daily timeframe regardless of chart timeframe
4️⃣ Positive Bias Condition (Bullish)
Bias becomes POSITIVE only when both conditions are true:
Today Close > Previous Day High
Today Low > Previous Day Low
📌 Indicates strong bullish control
5️⃣ Negative Bias Condition (Bearish)
Bias becomes NEGATIVE only when both conditions are true:
Today Close < Previous Day Low
Today High < Previous Day High
📌 Indicates strong bearish control
6️⃣ Bias Hold Rule (Most Important)
Bias does NOT flip frequently
Bias remains unchanged until:
Both opposite conditions are satisfied
Prevents false signals during sideways markets
Bias Values:
+1 → Positive
-1 → Negative
0 → Neutral
7️⃣ Bias Memory Concept
Bias is stored using a state variable
Previous bias is carried forward when no condition is met
Ensures stable trend direction

ADR % RangesThis indicator is designed to visually represent percentage lines from the open of the day. The % amount is determined by X amount of the last days to create an average...or Average Daily Range (ADR).
1. ADR Percentage Lines: The core function of the script is to apply lines to the chart that represent specific percentage changes from the daily open. It first calculates the average over X amount of days and then displays two lines that are 1/3rd of that average. One line goes above the other line goes below. The other two lines are the full "range" of the average. These lines can act as boundaries or targets to know how an asset has moved recently. *Past performance is not indicative of current or future results.
The calculation for ADR is:
Step 1. Calculate Today's Range = DailyHigh - DailyLow
Step 2. Store this average after the day has completed
Step 3. Sum all day's ranges
Step 4. Divide by total number of days
Step 5. Draw on chart
2. Customizable Inputs: Users have the flexibility to customize the script through various inputs. This includes the option to display lines only for the current trading day (`todayonly`), and to select which lines are displayed. The user can also opt to show a table the displays the total range of previous days and the average range of those previous days.
3. No Secondary Timeframe: The ADR is computed based on whatever timeframe the chart is and does not reference secondary periods. Therefore the script cannot be used on charts greater than daily.
This script is can be used by all traders for any market. The trader might have to adjust the "X" number of days back to compute a historical average. Maybe they only want to know the average over the past week (5 days) or maybe the past month (20 days).

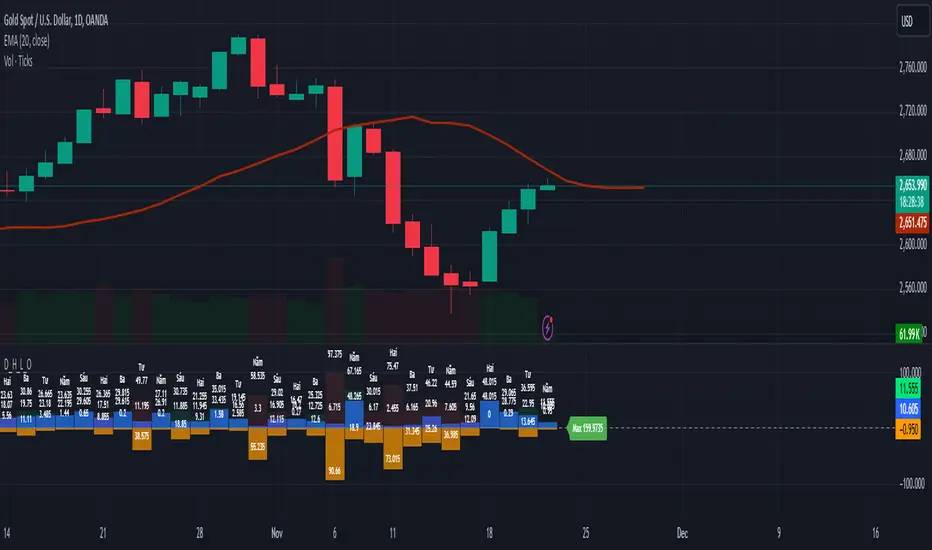
D_H_L_OIndicator Name: D_H_L_O
Primary Function:
This indicator is designed to display buying pressure, selling pressure, and other key metrics derived from the daily candle on a TradingView chart. It helps you analyze market momentum, buying and selling forces, and price spreads.
Features Overview:
Basic Calculations from Daily Candle:
dailyHigh, dailyLow, dailyOpen, dailyClose: Represent the high, low, open, and close prices of the daily candle.
dailySpread: The difference between the high and low prices of the daily candle.
Buying and Selling Pressure:
Buying Pressure (high_open): The difference between the daily high and the open price.
Selling Pressure (low_open): The absolute difference between the daily low and the open price (displayed as a negative value).
deltaVolume: The net difference between buying and selling pressure.
Color and Visuals:
Blue (buyingColor): Indicates buying pressure for green (bullish) days.
Orange (sellingColor): Indicates selling pressure for red (bearish) days.
Displays bars with transparency to distinguish buying and selling forces.
Neutral Reference Line:
A horizontal line at 0 for quick visual comparison of buying and selling forces.
Labels for Key Information:
Displays values of buying pressure, selling pressure, and daily candle spread directly on the chart at corresponding bar positions.
Includes the weekday name (currentWeekday) for additional time context.
Historical Statistics:
Highest and lowest values of buying and selling pressure across the dataset.
Average buying and selling pressure.
Displays statistical summaries (like maximum pressure values) as labels on the last bar of the chart.
Benefits:
Detailed Market Pressure Visualization: Provides a clear view of the forces driving market movement each day.
Historical Context: Helps analyze historical trends in buying and selling pressures over time.
Decision-Making Support: Use pressure metrics to gauge market momentum and assess potential trends.
How to Use:
Copy and paste the script into TradingView (create a new indicator using Pine Script v5).
Add the indicator to your chart on any timeframe to observe daily candle metrics.
Customize colors, transparency, or other parameters to suit your trading style.
This indicator is ideal for traders who want to analyze price momentum and make decisions based on daily market behavior.