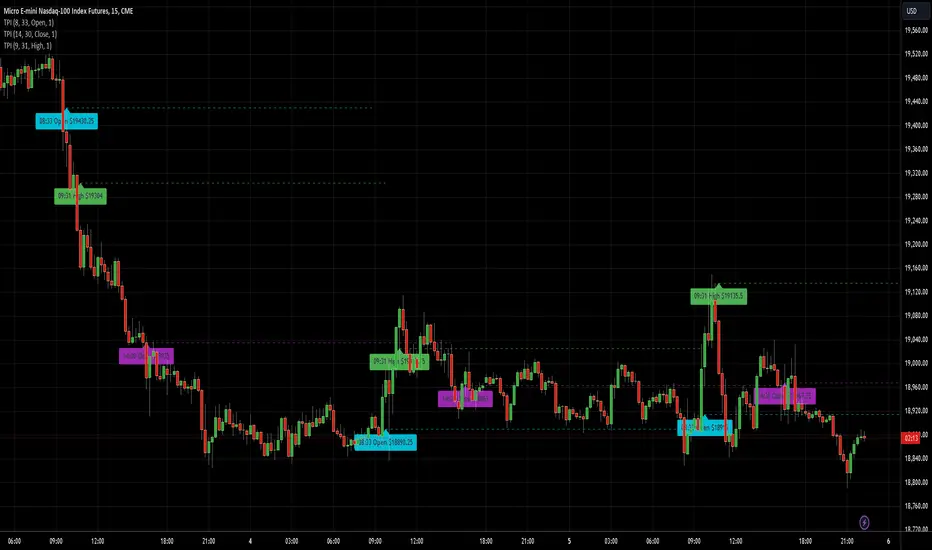
Mars Signals - Ultimate Institutional Suite v3.0(Joker)Comprehensive Trading Manual
Mars Signals – Ultimate Institutional Suite v3.0 (Joker)
## Chapter 1 – Philosophy & System Architecture
This script is not a simple “buy/sell” indicator.
Mars Signals – UIS v3.0 (Joker) is designed as an institutional-style analytical assistant that layers several methodologies into a single, coherent framework.
The system is built on four core pillars:
1. Smart Money Concepts (SMC)
- Detection of Order Blocks (professional demand/supply zones).
- Detection of Fair Value Gaps (FVGs) (price imbalances).
2. Smart DCA Strategy
- Combination of RSI and Bollinger Bands
- Identifies statistically discounted zones for scaling into spot positions or exiting shorts.
3. Volume Profile (Visible Range Simulation)
- Distribution of volume by price, not by time.
- Identification of POC (Point of Control) and high-/low-volume areas.
4. Wyckoff Helper – Spring
- Detection of bear traps, liquidity grabs, and sharp bullish reversals.
All four pillars feed into a Confluence Engine (Scoring System).
The final output is presented in the Dashboard, with a clear, human-readable signal:
- STRONG LONG 🚀
- WEAK LONG ↗
- NEUTRAL / WAIT
- WEAK SHORT ↘
- STRONG SHORT 🩸
This allows the trader to see *how many* and *which* layers of the system support a bullish or bearish bias at any given time.
## Chapter 2 – Settings Overview
### 2.1 General & Dashboard Group
- Show Dashboard Panel (`show_dash`)
Turns the dashboard table in the corner of the chart ON/OFF.
- Show Signal Recommendation (`show_rec`)
- If enabled, the textual signal (STRONG LONG, WEAK SHORT, etc.) is displayed.
- If disabled, you only see feature status (ON/OFF) and the current price.
- Dashboard Position (`dash_pos`)
Determines where the dashboard appears on the chart:
- `Top Right`
- `Bottom Right`
- `Top Left`
### 2.2 Smart Money (SMC) Group
- Enable SMC Strategy (`show_smc`)
Globally enables or disables the Order Block and FVG logic.
- Order Block Pivot Lookback (`ob_period`)
Main parameter for detecting key pivot highs/lows (swing points).
- Default value: 5
- Concept:
A bar is considered a pivot low if its low is lower than the lows of the previous 5 and the next 5 bars.
Similarly, a pivot high has a high higher than the previous 5 and the next 5 bars.
These pivots are used as anchors for Order Blocks.
- Increasing `ob_period`:
- Fewer levels.
- But levels tend to be more significant and reliable.
- In highly volatile markets (major news, war events, FOMC, etc.),
using values 7–10 is recommended to filter out weak levels.
- Show Fair Value Gaps (`show_fvg`)
Enables/disables the drawing of FVG zones (imbalances).
- Bullish OB Color (`c_ob_bull`)
- Color of Bullish Order Blocks (Demand Zones).
- Default: semi-transparent green (transparency ≈ 80).
- Bearish OB Color (`c_ob_bear`)
- Color of Bearish Order Blocks (Supply Zones).
- Default: semi-transparent red.
- Bullish FVG Color (`c_fvg_bull`)
- Color of Bullish FVG (upward imbalance), typically yellow.
- Bearish FVG Color (`c_fvg_bear`)
- Color of Bearish FVG (downward imbalance), typically purple.
### 2.3 Smart DCA Strategy Group
- Enable DCA Zones (`show_dca`)
Enables the Smart DCA logic and visual labels.
- RSI Length (`rsi_len`)
Lookback period for RSI (default: 14).
- Shorter → more sensitive, more noise.
- Longer → fewer signals, higher reliability.
- Bollinger Bands Length (`bb_len`)
Moving average period for Bollinger Bands (default: 20).
- BB Multiplier (`bb_mult`)
Standard deviation multiplier for Bollinger Bands (default: 2.0).
- For extremely volatile markets, values like 2.5–3.0 can be used so that only extreme deviations trigger a DCA signal.
### 2.4 Volume Profile (Visible Range Sim) Group
- Show Volume Profile (`show_vp`)
Enables the simulated Volume Profile bars on the right side of the chart.
- Volume Lookback Bars (`vp_lookback`)
Number of bars used to compute the Volume Profile (default: 150).
- Higher values → broader historical context, heavier computation.
- Row Count (`vp_rows`)
Number of vertical price segments (rows) to divide the total price range into (default: 30).
- Width (%) (`vp_width`)
Relative width of each volume bar as a percentage.
In the code, bar widths are scaled relative to the row with the maximum volume.
> Technical note: Volume Profile calculations are executed only on the last bar (`barstate.islast`) to keep the script performant even on higher timeframes.
### 2.5 Wyckoff Helper Group
- Show Wyckoff Events (`show_wyc`)
Enables detection and plotting of Wyckoff Spring events.
- Volume MA Length (`vol_ma_len`)
Length of the moving average on volume.
A bar is considered to have Ultra Volume if its volume is more than 2× the volume MA.
## Chapter 3 – Smart Money Strategy (Order Blocks & FVG)
### 3.1 What Is an Order Block?
An Order Block (OB) represents the footprint of large institutional orders:
- Bullish Order Block (Demand Zone)
The last selling region (bearish candle/cluster) before a strong upward move.
- Bearish Order Block (Supply Zone)
The last buying region (bullish candle/cluster) before a strong downward move.
Institutions and large players place heavy orders in these regions. Typical price behavior:
- Price moves away from the zone.
- Later returns to the same zone to fill unfilled orders.
- Then continues the larger trend.
In the script:
- If `pl` (pivot low) forms → a Bullish OB is created.
- If `ph` (pivot high) forms → a Bearish OB is created.
The box is drawn:
- From `bar_index ` to `bar_index`.
- Between `low ` and `high `.
- `extend=extend.right` extends the OB into the future, so it acts as a dynamic support/resistance zone.
- Only the last 4 OB boxes are kept to avoid clutter.
### 3.2 Order Block Color Guide
- Semi-transparent Green (`c_ob_bull`)
- Represents a Bullish Order Block (Demand Zone).
- Interpretation: a price region with a high probability of bullish reaction.
- Semi-transparent Red (`c_ob_bear`)
- Represents a Bearish Order Block (Supply Zone).
- Interpretation: a price region with a high probability of bearish reaction.
Overlap (Multiple OBs in the Same Area)
When two or more Order Blocks overlap:
- The shared area appears visually denser/stronger.
- This suggests higher order density.
- Such zones can be treated as high-priority levels for entries, exits, and stop-loss placement.
### 3.3 Demand/Supply Logic in the Scoring Engine
is_in_demand = low <= ta.lowest(low, 20)
is_in_supply = high >= ta.highest(high, 20)
- If current price is near the lowest lows of the last 20 bars, it is considered in a Demand Zone → positive impact on score.
- If current price is near the highest highs of the last 20 bars, it is considered in a Supply Zone → negative impact on score.
This logic complements Order Blocks and helps the Dashboard distinguish whether:
- Market is currently in a statistically cheap (long-friendly) area, or
- In a statistically expensive (short-friendly) area.
### 3.4 Fair Value Gaps (FVG)
#### Concept
When the market moves aggressively:
- Some price levels are skipped and never traded.
- A gap between wicks/shadows of consecutive candles appears.
- These regions are called Fair Value Gaps (FVGs) or Imbalances.
The market generally “dislikes” imbalance and often:
- Returns to these zones in the future.
- Fills the gap (rebalance).
- Then resumes its dominant direction.
#### Implementation in the Code
Bullish FVG (Yellow)
fvg_bull_cond = show_smc and show_fvg and low > high and close > high
if fvg_bull_cond
box.new(bar_index , high , bar_index, low, ...)
Core condition:
`low > high ` → the current low is above the high of two bars ago; the space between them is an untraded gap.
Bearish FVG (Purple)
fvg_bear_cond = show_smc and show_fvg and high < low and close < low
if fvg_bear_cond
box.new(bar_index , low , bar_index, high, ...)
Core condition:
`high < low ` → the current high is below the low of two bars ago; again a price gap exists.
#### FVG Color Guide
- Transparent Yellow (`c_fvg_bull`) – Bullish FVG
Often acts like a magnet for price:
- Price tends to retrace into this zone,
- Fill the imbalance,
- And then continue higher.
- Transparent Purple (`c_fvg_bear`) – Bearish FVG
Price tends to:
- Retrace upward into the purple area,
- Fill the imbalance,
- And then resume downward movement.
#### Trading with FVGs
- FVGs are *not* standalone entry signals.
They are best used as:
- Targets (take-profit zones), or
- Reaction areas where you expect a pause or reversal.
Examples:
- If you are long, a bearish FVG above is often an excellent take-profit zone.
- If you are short, a bullish FVG below is often a good cover/exit zone.
### 3.5 Core SMC Trading Templates
#### Reversal Long
1. Price trades down into a green Order Block (Demand Zone).
2. A bullish confirmation candle (Close > Open) forms inside or just above the OB.
3. If this zone is close to or aligned with a bullish FVG (yellow), the signal is reinforced.
4. Entry:
- At the close of the confirmation candle, or
- Using a limit order near the upper boundary of the OB.
5. Stop-loss:
- Slightly below the OB.
- If the OB is broken decisively and price consolidates below it, the zone loses validity.
6. Targets:
- The next FVG,
- Or the next red Order Block (Supply Zone) above.
#### Reversal Short
The mirror scenario:
- Price rallies into a red Order Block (Supply).
- A bearish confirmation candle forms (Close < Open).
- FVG/premium structure above can act as a confluence.
- Stop-loss goes above the OB.
- Targets: lower FVGs or subsequent green OBs below.
## Chapter 4 – Smart DCA Strategy (RSI + Bollinger Bands)
### 4.1 Smart DCA Concept
- Classic DCA = buying at fixed time intervals regardless of price.
- Smart DCA = scaling in only when:
- Price is statistically cheaper than usual, and
- The market is in a clear oversold condition.
Code logic:
rsi_val = ta.rsi(close, rsi_len)
= ta.bb(close, bb_len, bb_mult)
dca_buy = show_dca and rsi_val < 30 and close < bb_lower
dca_sell = show_dca and rsi_val > 70 and close > bb_upper
Conditions:
- DCA Buy – Smart Scale-In Zone
- RSI < 30 → oversold.
- Close < lower Bollinger Band → price has broken below its typical volatility envelope.
- DCA Sell – Overbought/Distribution Zone
- RSI > 70 → overbought.
- Close > upper Bollinger Band → price is extended far above the mean.
### 4.2 Visual Representation on the Chart
- Green “DCA” Label Below Candle
- Shape: `labelup`.
- Color: lime background, white text.
- Meaning: statistically attractive level for laddered spot entries or short exits.
- Red “SELL” Label Above Candle
- Warning that the market is in an extended, overbought condition.
- Suitable for profit-taking on longs or considering short entries (with proper confluence and risk management).
- Light Green Background (`bgcolor`)
- When `dca_buy` is true, the candle background turns very light green (high transparency).
- This helps visually identify DCA Zones across the chart at a glance.
### 4.3 Practical Use in Trading
#### Spot Trading
Used to build a better average entry price:
- Every time a DCA label appears, allocate a fixed portion of capital (e.g., 2–5%).
- Combining DCA signals with:
- Green OBs (Demand Zones), and/or
- The Volume Profile POC
makes the zone structurally more important.
#### Futures Trading
- Longs
- Use DCA Buy signals as low-risk zones for opening or adding to longs when:
- Price is inside a green OB, or
- The Dashboard already leans LONG.
- Shorts
- Use DCA Sell signals as:
- Exit zones for longs, or
- Areas to initiate shorts with stops above structural highs.
## Chapter 5 – Volume Profile (Visible Range Simulation)
### 5.1 Concept
Traditional volume (histogram under the chart) shows volume over time.
Volume Profile shows volume by price level:
- At which prices has the highest trading activity occurred?
- Where did buyers and sellers agree the most (High Volume Nodes – HVNs)?
- Where did price move quickly due to low participation (Low Volume Nodes – LVNs)?
### 5.2 Implementation in the Script
Executed only when `show_vp` is enabled and on the last bar:
1. The last `vp_lookback` bars (default 150) are processed.
2. The minimum low and maximum high over this window define the price range.
3. This price range is divided into `vp_rows` segments (e.g., 30 rows).
4. For each row:
- All bars are scanned.
- If the mid-price `(high + low ) / 2` falls inside a row, that bar’s volume is added to the row total.
5. The row with the greatest volume is stored as `max_vol_idx` (the POC row).
6. For each row, a volume box is drawn on the right side of the chart.
### 5.3 Color Scheme
- Semi-transparent Orange
- The row with the maximum volume – the Point of Control (POC).
- Represents the strongest support/resistance level from a volume perspective.
- Semi-transparent Blue
- Other volume rows.
- The taller the bar → the higher the volume → the stronger the interest at that price band.
### 5.4 Trading Applications
- If price is above POC and retraces back into it:
→ POC often acts as support, suitable for long setups.
- If price is below POC and rallies into it:
→ POC often acts as resistance, suitable for short setups or profit-taking.
HVNs (Tall Blue Bars)
- Represent areas of equilibrium where the market has spent time and traded heavily.
- Price tends to consolidate here before choosing a direction.
LVNs (Short or Nearly Empty Bars)
- Represent low participation zones.
- Price often moves quickly through these areas – useful for targeting fast moves.
## Chapter 6 – Wyckoff Helper – Spring
### 6.1 Spring Concept
In the Wyckoff framework:
- A Spring is a false break of support.
- The market briefly trades below a well-defined support level, triggers stop losses,
then sharply reverses upward as institutional buyers absorb liquidity.
This movement:
- Clears out weak hands (retail sellers).
- Provides large players with liquidity to enter long positions.
- Often initiates a new uptrend.
### 6.2 Code Logic
Conditions for a Spring:
1. The current low is lower than the lowest low of the previous 50 bars
→ apparent break of a long-standing support.
2. The bar closes bullish (Close > Open)
→ the breakdown was rejected.
3. Volume is significantly elevated:
→ `volume > 2 × volume_MA` (Ultra Volume).
When all conditions are met and `show_wyc` is enabled:
- A pink diamond is plotted below the bar,
- With the label “Spring” – one of the strongest long signals in this system.
### 6.3 Trading Use
- After a valid Spring, markets frequently enter a meaningful bullish phase.
- The highest quality setups occur when:
- The Spring forms inside a green Order Block, and
- Near or on the Volume Profile POC.
Entries:
- At the close of the Spring bar, or
- On the first pullback into the mid-range of the Spring candle.
Stop-loss:
- Slightly below the Spring’s lowest point (wick low plus a small buffer).
## Chapter 7 – Confluence Engine & Dashboard
### 7.1 Scoring Logic
For each bar, the script:
1. Resets `score` to 0.
2. Adjusts the score based on different signals.
SMC Contribution
if show_smc
if is_in_demand
score += 1
if is_in_supply
score -= 1
- Being in Demand → `+1`
- Being in Supply → `-1`
DCA Contribution
if show_dca
if dca_buy
score += 2
if dca_sell
score -= 2
- DCA Buy → `+2` (strong, statistically driven long signal)
- DCA Sell → `-2`
Wyckoff Spring Contribution
if show_wyc
if wyc_spring
score += 2
- Spring → `+2` (entry of strong money)
### 7.2 Mapping Score to Dashboard Signal
- score ≥ 2 → STRONG LONG 🚀
Multiple bullish conditions aligned.
- score = 1 → WEAK LONG ↗
Some bullish bias, but only one layer clearly positive.
- score = 0 → NEUTRAL / WAIT
Rough balance between buying and selling forces; staying flat is usually preferable.
- score = -1 → WEAK SHORT ↘
Mild bearish bias, suited for cautious or short-term plays.
- score ≤ -2 → STRONG SHORT 🩸
Convergence of several bearish signals.
### 7.3 Dashboard Structure
The dashboard is a two-column table:
- Row 0
- Column 0: `"Mars Signals"` – black background, white text.
- Column 1: `"UIS v3.0"` – black background, yellow text.
- Row 1
- Column 0: `"Price:"` (light grey background).
- Column 1: current closing price (`close`) with a semi-transparent blue background.
- Row 2
- Column 0: `"SMC:"`
- Column 1:
- `"ON"` (green) if `show_smc = true`
- `"OFF"` (grey) otherwise.
- Row 3
- Column 0: `"DCA:"`
- Column 1:
- `"ON"` (green) if `show_dca = true`
- `"OFF"` (grey) otherwise.
- Row 4
- Column 0: `"Signal:"`
- Column 1: signal text (`status_txt`) with background color `status_col`
(green, red, teal, maroon, etc.)
- If `show_rec = false`, these cells are cleared.
## Chapter 8 – Visual Legend (Colors, Shapes & Actions)
For quick reading inside TradingView, the visual elements are described line by line instead of a table.
Chart Element: Green Box
Color / Shape: Transparent green rectangle
Core Meaning: Bullish Order Block (Demand Zone)
Suggested Trader Response: Look for longs, Smart DCA adds, closing or reducing shorts.
Chart Element: Red Box
Color / Shape: Transparent red rectangle
Core Meaning: Bearish Order Block (Supply Zone)
Suggested Trader Response: Look for shorts, or take profit on existing longs.
Chart Element: Yellow Area
Color / Shape: Transparent yellow zone
Core Meaning: Bullish FVG / upside imbalance
Suggested Trader Response: Short take-profit zone or expected rebalance area.
Chart Element: Purple Area
Color / Shape: Transparent purple zone
Core Meaning: Bearish FVG / downside imbalance
Suggested Trader Response: Long take-profit zone or temporary supply region.
Chart Element: Green "DCA" Label
Color / Shape: Green label with white text, plotted below the candle
Core Meaning: Smart ladder-in buy zone, DCA buy opportunity
Suggested Trader Response: Spot DCA entry, partial short exit.
Chart Element: Red "SELL" Label
Color / Shape: Red label with white text, plotted above the candle
Core Meaning: Overbought / distribution zone
Suggested Trader Response: Take profit on longs, consider initiating shorts.
Chart Element: Light Green Background (bgcolor)
Color / Shape: Very transparent light-green background behind bars
Core Meaning: Active DCA Buy zone
Suggested Trader Response: Treat as a discount zone on the chart.
Chart Element: Orange Bar on Right
Color / Shape: Transparent orange horizontal bar in the volume profile
Core Meaning: POC – price with highest traded volume
Suggested Trader Response: Strong support or resistance; key reference level.
Chart Element: Blue Bars on Right
Color / Shape: Transparent blue horizontal bars in the volume profile
Core Meaning: Other volume levels, showing high-volume and low-volume nodes
Suggested Trader Response: Use to identify balance zones (HVN) and fast-move corridors (LVN).
Chart Element: Pink "Spring" Diamond
Color / Shape: Pink diamond with white text below the candle
Core Meaning: Wyckoff Spring – liquidity grab and potential major bullish reversal
Suggested Trader Response: One of the strongest long signals in the suite; look for high-quality long setups with tight risk.
Chart Element: STRONG LONG in Dashboard
Color / Shape: Green background, white text in the Signal row
Core Meaning: Multiple bullish layers in confluence
Suggested Trader Response: Consider initiating or increasing longs with strict risk management.
Chart Element: STRONG SHORT in Dashboard
Color / Shape: Red background, white text in the Signal row
Core Meaning: Multiple bearish layers in confluence
Suggested Trader Response: Consider initiating or increasing shorts with a logical, well-placed stop.
## Chapter 9 – Timeframe-Based Trading Playbook
### 9.1 Timeframe Selection
- Scalping
- Timeframes: 1M, 5M, 15M
- Objective: fast intraday moves (minutes to a few hours).
- Recommendation: focus on SMC + Wyckoff.
Smart DCA on very low timeframes may introduce excessive noise.
- Day Trading
- Timeframes: 15M, 1H, 4H
- Provides a good balance between signal quality and frequency.
- Recommendation: use the full stack – SMC + DCA + Volume Profile + Wyckoff + Dashboard.
- Swing Trading & Position Investing
- Timeframes: Daily, Weekly
- Emphasis on Smart DCA + Volume Profile.
- SMC and Wyckoff are used mainly to fine-tune swing entries within larger trends.
### 9.2 Scenario A – Scalping Long
Example: 5-Minute Chart
1. Price is declining into a green OB (Bullish Demand).
2. A candle with a long lower wick and bullish close (Pin Bar / Rejection) forms inside the OB.
3. A Spring diamond appears below the same candle → very strong confluence.
4. The Dashboard shows at least WEAK LONG ↗, ideally STRONG LONG 🚀.
5. Entry:
- On the close of the confirmation candle, or
- On the first pullback into the mid-range of that candle.
6. Stop-loss:
- Slightly below the OB.
7. Targets:
- Nearby bearish FVG above, and/or
- The next red OB.
### 9.3 Scenario B – Day-Trading Short
Recommended Timeframes: 1H or 4H
1. The market completes a strong impulsive move upward.
2. Price enters a red Order Block (Supply).
3. In the same zone, a purple FVG appears or remains unfilled.
4. On a lower timeframe (e.g., 15M), RSI enters overbought territory and a DCA Sell signal appears.
5. The main timeframe Dashboard (1H) shows WEAK SHORT ↘ or STRONG SHORT 🩸.
Trade Plan
- Open a short near the upper boundary of the red OB.
- Place the stop above the OB or above the last swing high.
- Targets:
- A yellow FVG lower on the chart, and/or
- The next green OB (Demand) below.
### 9.4 Scenario C – Swing / Investment with Smart DCA
Timeframes: Daily / Weekly
1. On the daily or weekly chart, each time a green “DCA” label appears:
- Allocate a fixed fraction of your capital (e.g., 3–5%) to that asset.
2. Check whether this DCA zone aligns with the orange POC of the Volume Profile:
- If yes → the quality of the entry zone is significantly higher.
3. If the DCA signal sits inside a daily green OB, the probability of a medium-term bottom increases.
4. Always build the position laddered, never all-in at a single price.
Exits for investors:
- Near weekly red OBs or large purple FVG zones.
- Ideally via partial profit-taking rather than closing 100% at once.
### 9.5 Case Study 1 – BTCUSDT (15-Minute)
- Context: Price has sold off down towards 65,000 USD.
- A green OB had previously formed at that level.
- Near the lower boundary of this OB, a partially filled yellow FVG is present.
- As price returns to this region, a Spring appears.
- The Dashboard shifts from NEUTRAL / WAIT to WEAK LONG ↗.
Plan
- Enter a long near the OB low.
- Place stop below the Spring low.
- First target: a purple FVG around 66,200.
- Second (optional) target: the first red OB above that level.
### 9.6 Case Study 2 – Meme Coin (PEPE – 4H)
- After a strong pump, price enters a corrective phase.
- On the 4H chart, RSI drops below 30; price breaks below the lower Bollinger Band → a DCA label prints.
- The Volume Profile shows the POC at approximately the same level.
- The Dashboard displays STRONG LONG 🚀.
Plan
- Execute laddered buys in the combined DCA + POC zone.
- Place a protective stop below the last significant swing low.
- Target: an expected 20–30% upside move towards the next red OB or purple FVG.
## Chapter 10 – Risk Management, Psychology & Advanced Tuning
### 10.1 Risk Management
No signal, regardless of its strength, replaces risk control.
Recommendations:
- In futures, do not expose more than 1–3% of account equity to risk per trade.
- Adjust leverage to the volatility of the instrument (lower leverage for highly volatile altcoins).
- Place stop-losses in zones where the idea is clearly invalidated:
- Below/above the relevant Order Block or Spring, not randomly in the middle of the structure.
### 10.2 Market-Specific Parameter Tuning
- Calmer Markets (e.g., major FX pairs)
- `ob_period`: 3–5.
- `bb_mult`: 2.0 is usually sufficient.
- Highly Volatile Markets (Crypto, news-driven assets)
- `ob_period`: 7–10 to highlight only the most robust OBs.
- `bb_mult`: 2.5–3.0 so that only extreme deviations trigger DCA.
- `vol_ma_len`: increase (e.g., to ~30) so that Spring triggers only on truly exceptional
volume spikes.
### 10.3 Trading Psychology
- STRONG LONG 🚀 does not mean “risk-free”.
It means the probability of a successful long, given the model’s logic, is higher than average.
- Treat Mars Signals as a confirmation and context system, not a full replacement for your own decision-making.
- Example of disciplined thinking:
- The Dashboard prints STRONG LONG,
- But price is simultaneously testing a multi-month macro resistance or a major negative news event is imminent,
- In such cases, trade smaller, widen stops appropriately, or skip the trade.
## Chapter 11 – Technical Notes & FAQ
### 11.1 Does the Script Repaint?
- Order Blocks and Springs are based on completed pivot structures and confirmed candles.
- Until a pivot is confirmed, an OB does not exist; after confirmation, behavior is stable under classic SMC assumptions.
- The script is designed to be structurally consistent rather than repainting signals arbitrarily.
### 11.2 Computational Load of Volume Profile
- On the last bar, the script processes up to `vp_lookback` bars × `vp_rows` rows.
- On very low timeframes with heavy zooming, this can become demanding.
- If you experience performance issues:
- Reduce `vp_lookback` or `vp_rows`, or
- Temporarily disable Volume Profile (`show_vp = false`).
### 11.3 Multi-Timeframe Behavior
- This version of the script is not internally multi-timeframe.
All logic (OB, DCA, Spring, Volume Profile) is computed on the active timeframe only.
- Practical workflow:
- Analyze overall structure and key zones on higher timeframes (4H / Daily).
- Use lower timeframes (15M / 1H) with the same tool for timing entries and exits.
## Conclusion
Mars Signals – Ultimate Institutional Suite v3.0 (Joker) is a multi-layer trading framework that unifies:
- Price structure (Order Blocks & FVG),
- Statistical behavior (Smart DCA via RSI + Bollinger),
- Volume distribution by price (Volume Profile with POC, HVN, LVN),
- Liquidity events (Wyckoff Spring),
into a single, coherent system driven by a transparent Confluence Scoring Engine.
The final output is presented in clear, actionable language:
> STRONG LONG / WEAK LONG / NEUTRAL / WEAK SHORT / STRONG SHORT
The system is designed to support professional decision-making, not to replace it.
Used together with strict risk management and disciplined execution,
Mars Signals – UIS v3.0 (Joker) can serve as a central reference manual and operational guide
for your trading workflow, from scalping to swing and investment positioning.
ค้นหาในสคริปต์สำหรับ "daily"
Weekday Close vs Open — Last N (per weekday)# Weekday Close vs Open - Last N Occurrences
This indicator distills every weekday's historical open-to-close behavior into a compact table so you can see how "typical" the current session is before the day even closes. It runs independently of your chart timeframe by pulling daily OHLCV data under the hood, tracking the last **N** completed occurrences for each weekday, and refreshing only when a daily bar closes. On daily charts you can also shade every past bar that matches today's weekday (excluding the in-progress session) to reinforce the pattern visually while the table remains non-repainting.
## What It Shows
- **Win/Loss/Tie counts** - how many of the last `N` occurrences closed above the open (wins), below (losses), or inside the tie threshold you define as "flat".
- **Win % heatmap** - the win column is color-coded (deep green > deep red) so you immediately recognize strong or weak weekdays.
- **Advanced metrics (optional)** - average daily volume plus the average percentage excursion above/below the open (`AvgUp%`, `AvgDn%`) for that weekday.
- **Totals row** - aggregates every weekday into one row to estimate overall hit rate and average stats across the entire data set.
- **Weekday shading (optional)** - on daily charts you can tint every bar that matches today's weekday (all Mondays, all Fridays, etc.) for instant pattern recognition.
## How It Works
1. The script requests daily OHLCV data (non-repainting) regardless of the chart timeframe.
2. When a new daily bar confirms, it packs that day's data into one of seven arrays (one per weekday). Each day contributes five floats (O/H/L/C/V) so trimming and statistics stay in lockstep.
3. A helper function (`f_dayMetrics`) scans daily history to compute average volume, average excursion above/below the open, and win/loss/tie counts for the requested weekday.
4. The table populates on the last bar of the chart session, respecting your advanced/totals toggles and keeping text at `size.normal`.
## Reading the Table
- **Win/Loss/Tie columns**: raw counts taken from your chosen `N`.
- **Win %***: excludes ties from the denominator so it reflects only decisive closes.
- **AvgUp% / AvgDn%**: typical intraday extension (high vs open, open vs low) in percent.
- **Avg Vol**: arithmetic mean of daily volume for that weekday.
- **TOTAL row**: provides a global win rate plus volume/up/down averages weighted by how many samples each weekday contributed.
## Practical Uses
- Spot weekdays that historically trend higher or lower before entering a trade.
- Compare current price action against the typical intraday range (`AvgUp%` vs today's move).
- Filter mean-reversion vs breakout setups based on the most reliable weekday patterns.
- Quickly gauge whether today is behaving "in character" by referencing the highlighted row or the optional whole-chart weekday shading.
> **Tip:** Use smaller `N` values (e.g., 10-20) for adaptive, recent behavior and larger values (50+) to capture longer-term seasonality. Tighten the tie threshold if you want almost every candle to register as win/loss, or widen it to focus only on meaningful moves.
Scout Regiment - D17# Scout Regiment - D17 Indicator
## English Documentation
### Overview
Scout Regiment - D17 is a comprehensive TradingView indicator that combines multiple technical analysis tools into one powerful overlay indicator. It provides traders with market structure analysis, divergence detection, volume profiling, smart money concepts, and session analysis.
### Key Features
#### 1. **EMA (Exponential Moving Averages)**
- **Purpose**: Trend identification and dynamic support/resistance levels
- **Configuration**: 13 customizable EMAs with adjustable periods
- **Default Active EMAs**: EMA 3 (21), EMA 5 (55), EMA 7 (144), EMA 8 (233)
- **Uses**: Identify trend direction, entry/exit points, and trend strength
- **Color Coding**: Different colors for easy visual distinction
#### 2. **TFMA (Timeframe Moving Averages)**
- **Purpose**: Multi-timeframe trend analysis
- **Features**:
- 3 EMAs on higher timeframes
- Dynamic labels showing trend direction
- Price difference percentage display
- Customizable timeframe settings
- **Default Settings**: 21-period timeframe with lengths 55, 144, and 233
- **Benefits**: Align trades with higher timeframe trends
#### 3. **DFMA (Daily Frame Moving Averages)**
- **Purpose**: Daily timeframe perspective on any chart
- **Features**: Similar to TFMA but specifically for daily analysis
- **Default Timeframe**: 1D (Daily)
- **Use Case**: Long-term trend confirmation and positioning
#### 4. **PMA (Price Moving Averages)**
- **Purpose**: Price channel analysis with filled areas
- **Configuration**: 7 customizable moving averages with fill zones
- **Default Lengths**: 12, 144, 169, 288, 338, 576, 676
- **Visual**: Color-filled zones between selected MAs for channel trading
#### 5. **VWAP (Volume Weighted Average Price)**
- **Purpose**: Institutional trading levels and fair value
- **Features**:
- Multiple anchor periods (Session, Week, Month, Quarter, Year, etc.)
- Standard deviation bands
- Corporate event anchoring (Earnings, Dividends, Splits)
- **Use Case**: Identify institutional support/resistance and mean reversion opportunities
#### 6. **Divergence Detector**
- **Purpose**: Identify potential trend reversals
- **Supported Indicators**: MACD, MACD Histogram, RSI, Stochastic, CCI, Williams %R, Bias, Momentum, OBV, SOBV, VWmacd, CMF, MFI, and external indicators
- **Divergence Types**:
- Regular Bullish/Bearish
- Hidden Bullish/Bearish
- **Features**:
- Automatic divergence line drawing
- Customizable detection parameters
- Color-coded alerts
#### 7. **Volume Profile & Node Detection**
- **Purpose**: Identify key price levels based on volume distribution
- **Features**:
- Volume Profile with POC (Point of Control)
- Value Area High (VAH) and Value Area Low (VAL)
- Peak and trough volume node detection
- Highest/lowest volume node highlighting
- **Lookback**: Configurable (default 377 bars)
- **Use Case**: Identify support/resistance zones and liquidity areas
#### 8. **Smart Money Concepts**
- **Purpose**: Track institutional trading patterns
- **Features**:
- Market Structure (BOS - Break of Structure, CHoCH - Change of Character)
- Internal and Swing structures
- Strong/Weak Highs and Lows
- Equal Highs/Lows detection
- Fair Value Gaps (FVG)
- **Modes**: Historical or Present (latest only)
- **Use Case**: Trade with institutional flow
#### 9. **Trading Sessions**
- **Purpose**: Analyze market behavior during different global sessions
- **Available Sessions**:
- Asian Session
- Sydney, Tokyo, Shanghai, Hong Kong
- European Session
- London, New York, NYSE
- **Features**:
- Session boxes with high/low visualization
- Real-time countdown timers
- Volume and price change tracking
- Information table with session statistics
- **Customization**: Choose which sessions to display, colors, and box styles
### How to Use
#### For Trend Following:
1. Enable EMAs 3, 5, 7, and 8
2. Use TFMA for higher timeframe confirmation
3. Look for price above/below key EMAs for trend direction
4. Use VWAP as additional confirmation
#### For Reversal Trading:
1. Enable Divergence Detector with MACD Histogram and Bias
2. Look for divergences at key support/resistance levels
3. Confirm with Smart Money CHoCH signals
4. Use Volume Profile nodes as entry/exit targets
#### For Intraday Trading:
1. Enable Trading Sessions
2. Focus on high-volume sessions (London, New York overlap)
3. Use session highs/lows as support/resistance
4. Trade Fair Value Gaps during active sessions
#### For Swing Trading:
1. Use DFMA for daily trend
2. Enable PMA for channel identification
3. Look for price reactions at volume profile value areas
4. Confirm with swing structure breaks
### Best Practices
1. **Don't Overcrowd**: Enable only the components you need for your strategy
2. **Multi-Timeframe Analysis**: Always check higher timeframe TFMA/DFMA
3. **Confluence**: Look for multiple signals confirming the same direction
4. **Volume Confirmation**: Use Volume Profile to validate price action
5. **Session Awareness**: Be aware of which session is active for volatility expectations
### Performance Optimization
- Disable unused features to improve chart loading speed
- Use "Present Mode" for Smart Money Concepts if historical data isn't needed
- Reduce Volume Profile lookback period on slower devices
### Alerts
The indicator includes alert conditions for:
- All divergence types (8 conditions)
- Smart Money structure breaks (8 conditions)
- Equal highs/lows detection
- Fair Value Gaps formation
---
## 中文说明文档
### 概述
Scout Regiment - D17 是一款综合性TradingView指标,将多个技术分析工具整合到一个强大的叠加指标中。它为交易者提供市场结构分析、背离检测、成交量分析、聪明钱概念和时区分析。
### 核心功能
#### 1. **EMA(指数移动平均线)**
- **用途**:趋势识别和动态支撑阻力位
- **配置**:13条可自定义周期的EMA
- **默认启用**:EMA 3(21)、EMA 5(55)、EMA 7(144)、EMA 8(233)
- **应用**:识别趋势方向、进出场点位和趋势强度
- **颜色编码**:不同颜色便于视觉区分
#### 2. **TFMA(时间框架移动平均线)**
- **用途**:多时间框架趋势分析
- **特点**:
- 3条更高时间框架的EMA
- 显示趋势方向的动态标签
- 价格差异百分比显示
- 可自定义时间框架设置
- **默认设置**:21周期时间框架,长度为55、144和233
- **优势**:使交易与更高时间框架趋势保持一致
#### 3. **DFMA(日线框架移动平均线)**
- **用途**:在任何图表上提供日线时间框架视角
- **特点**:与TFMA类似,但专门用于日线分析
- **默认时间框架**:1D(日线)
- **使用场景**:长期趋势确认和定位
#### 4. **PMA(价格移动平均线)**
- **用途**:价格通道分析与填充区域
- **配置**:7条可自定义的移动平均线,带填充区域
- **默认长度**:12、144、169、288、338、576、676
- **视觉效果**:选定MA之间的彩色填充区域,用于通道交易
#### 5. **VWAP(成交量加权平均价格)**
- **用途**:机构交易水平和公允价值
- **特点**:
- 多个锚定周期(交易日、周、月、季度、年等)
- 标准差波段
- 企业事件锚定(财报、分红、拆股)
- **使用场景**:识别机构支撑阻力和均值回归机会
#### 6. **背离检测器**
- **用途**:识别潜在趋势反转
- **支持指标**:MACD、MACD柱状图、RSI、随机指标、CCI、威廉指标、乖离率、动量、OBV、SOBV、VWmacd、CMF、MFI及外部指标
- **背离类型**:
- 常规看涨/看跌背离
- 隐藏看涨/看跌背离
- **特点**:
- 自动绘制背离连线
- 可自定义检测参数
- 颜色编码警报
#### 7. **成交量分布与节点检测**
- **用途**:基于成交量分布识别关键价格水平
- **特点**:
- 成交量分布图与POC(控制点)
- 价值区域高点(VAH)和低点(VAL)
- 峰值和低谷成交量节点检测
- 最高/最低成交量节点突出显示
- **回溯期**:可配置(默认377根K线)
- **使用场景**:识别支撑阻力区域和流动性区域
#### 8. **聪明钱概念**
- **用途**:追踪机构交易模式
- **特点**:
- 市场结构(BOS-突破结构、CHoCH-结构转变)
- 内部和摆动结构
- 强/弱高低点
- 等高/等低检测
- 公允价值缺口(FVG)
- **模式**:历史模式或当前模式(仅最新)
- **使用场景**:跟随机构资金流动交易
#### 9. **交易时区**
- **用途**:分析不同全球时段的市场行为
- **可用时段**:
- 亚洲时段
- 悉尼、东京、上海、香港
- 欧洲时段
- 伦敦、纽约、纽交所
- **特点**:
- 时段方框显示高低点
- 实时倒计时
- 成交量和价格变化追踪
- 时段统计信息表格
- **自定义**:选择显示哪些时段、颜色和方框样式
### 使用方法
#### 趋势跟随策略:
1. 启用EMA 3、5、7和8
2. 使用TFMA进行更高时间框架确认
3. 观察价格在关键EMA上方/下方确定趋势方向
4. 使用VWAP作为额外确认
#### 反转交易策略:
1. 启用背离检测器(MACD柱状图和乖离率)
2. 在关键支撑阻力位寻找背离
3. 用聪明钱CHoCH信号确认
4. 使用成交量分布节点作为进出场目标
#### 日内交易策略:
1. 启用交易时区
2. 关注高成交量时段(伦敦、纽约重叠时段)
3. 使用时段高低点作为支撑阻力
4. 在活跃时段交易公允价值缺口
#### 波段交易策略:
1. 使用DFMA确定日线趋势
2. 启用PMA识别通道
3. 观察价格在成交量分布价值区域的反应
4. 用摆动结构突破确认
### 最佳实践
1. **避免过度拥挤**:仅启用策略所需的组件
2. **多时间框架分析**:始终检查更高时间框架的TFMA/DFMA
3. **汇合点**:寻找多个信号确认同一方向
4. **成交量确认**:使用成交量分布验证价格行为
5. **时段意识**:了解当前活跃时段以预期波动性
### 性能优化
- 禁用未使用的功能以提高图表加载速度
- 如果不需要历史数据,对聪明钱概念使用"当前模式"
- 在较慢设备上减少成交量分布回溯期
### 警报
指标包含以下警报条件:
- 所有背离类型(8个条件)
- 聪明钱结构突破(8个条件)
- 等高/等低检测
- 公允价值缺口形成
---
## Technical Support
For questions or issues, please refer to the TradingView community or contact the indicator creator.
## 技术支持
如有问题,请参考TradingView社区或联系指标创建者。
3 day look backThis script is designed to help traders visually compare daily liquidity behavior between two correlated assets — for example, the Nasdaq (NQ) and the S&P500 (ES).
It plots each day’s High and Low, aligned from Midnight to Midnight, with a clean session structure. This makes it easier to identify:
SMT (Smart Money Technique) divergences
liquidity grabs
daily highs/lows sweeps
relative strength/weakness between assets
intraday bias shifts based on daily structure
What the script does
Reconstructs each trading day from 00:00 to 00:00, regardless of session irregularities.
Plots the High and Low of every completed day.
Allows users to display as many past days as they want (custom “look-back” parameter).
Automatically merges the weekend with Friday for assets where Saturday/Sunday sessions are fragmented.
Includes a manual midnight offset (–12h to +12h) to fix timezone inconsistencies on TradingView charts (common on futures).
Optional real-time lines for the current day.
No excessive right-side extensions for clean intraday reading.
Why this is useful
When comparing paired assets (e.g., NQ vs ES), liquidity behavior is often different.
This script makes it easy to spot:
when one asset makes a new daily high while the other doesn’t
asymmetrical liquidity sweeps
SMT-based divergence setups
liquidity grabs at daily levels
intraday directional bias shifts
About the other indicators shown on the chart
In the example chart, two additional indicators are used only for clarity and structure:
Day of the Week — displays the weekday on each session for easier orientation.
Vertical Line Timeline — draws a clean separator line between days.
These indicators are not required for this High/Low script to work.
They simply help visually organize sessions and make daily structure easier to read when comparing two assets side by side.
How to use
Open two assets (e.g., NQ1! and ES1!) side by side.
Apply this script on both charts.
Set the same timeframe.
Choose how many days back you want to visualize (look-back parameter).
Observe how each asset interacts with its daily High/Low.
Look for SMT divergences and liquidity-based setups.
Main features
Midnight-to-Midnight alignment
Weekend fusion
Manual offset for perfect timing
Adjustable daily look-back
Clean daily liquidity
Optional dynamic daily levels
Ideal for SMT/liquidity-based intraday trading
Luxy Sector & Industry RS AnalyzerEver wonder why some stocks soar while others in the same sector barely move? Or why your perfectly timed entry still loses money? Possibly the answer can be found in Relative Strength.
The Luxy Sector & Industry RS Analyzer solves a critical problem that most traders overlook: picking strong stocks in strong sectors AND strong industries . It's not enough for a stock to go up - you want stocks that are crushing their competition at both the sector AND industry level. This indicator does the heavy lifting by automatically comparing your stock against its sector ETF, industry ETF, the broader market, sector leader, and industry leader, giving you a complete multi-level picture of relative performance.
What makes this different?
- Automatic sector AND industry detection - no manual setup required
- Multi-level hierarchy analysis: Market → Sector → Industry → Stock
- Multi-timeframe analysis (1 month to 1 year) in one glance
- Industry ETF mapping (30+ industries covered)
- Clear 0-100 scoring system with letter grades (A+ to F)
- Works on stocks, crypto, forex, and commodities
- Real-time updates with anti-repaint protection
Think of it as your performance dashboard - instantly showing you if you're trading a champion or a laggard at every level of the market hierarchy.
METHODOLOGY & ATTRIBUTION
This indicator is based on classical Relative Strength (RS) analysis principles from technical analysis. RS methodology compares an asset's price performance against a benchmark to identify relative outperformance or underperformance. This concept has been used by professional traders and institutions for decades.
Key Concepts Used:
Relative Strength (RS) - Classical technical analysis concept measuring comparative performance
Multi-Level Hierarchy Analysis - Market → Sector → Industry → Stock comparison
Sector Rotation Analysis - Identifying which sectors are leading or lagging the market
Industry Rotation Analysis - Identifying which industries are leading within their sectors
Multi-period Performance Analysis - Evaluating strength across multiple timeframes
Beta Calculation - Standard statistical measure of volatility relative to a benchmark
DISCLAIMER: This indicator is for educational and informational purposes only. It should not be considered financial advice or a recommendation to buy or sell. Past performance does not guarantee future results. Trading involves risk and may not be suitable for all investors. Always do your own research and consult with a financial advisor before making investment decisions.
with all rows visible - capture when stock has strong RS score (70+) so users can see what a "good" setup looks like]
WHAT THE INDICATOR SHOWS
1. AUTOMATIC ASSET TYPE DETECTION
The indicator automatically identifies what you're analyzing and adjusts accordingly:
Stocks - Compares to sector ETF (XLK, XLF, XLV, etc.) and SPY
Crypto - Compares to Total Crypto Market Cap and Bitcoin
Forex - Compares to relevant currency index (DXY, EXY, etc.)
Commodities - Compares to Gold (GLD) as benchmark
Indices - Compares to broader market indices
How it works: The indicator reads your chart's asset type and ticker, then automatically maps it to the correct sector or benchmark. For stocks, it uses intelligent sector detection (looking at the sector field) to match you with the right sector ETF. For example:
- Technology stocks get compared to XLK (Technology Select Sector SPDR)
- Financial stocks get compared to XLF (Financial Select Sector SPDR)
- Healthcare stocks get compared to XLV (Health Care Select Sector SPDR)
This happens instantly when you add the indicator to any chart - no configuration needed.
2. SECTOR & MARKET BENCHMARKS
What is a Sector ETF?
A sector ETF is an exchange-traded fund that tracks a specific industry group. For example, XLK contains all major technology companies. By comparing your stock to its sector ETF, you can see if your stock is outperforming or underperforming its peers.
The indicator shows three key comparison points:
Stock vs Sector (Benchmark)
This tells you how your stock performs compared to companies in the same industry. Positive numbers mean your stock is beating the sector average. Negative numbers mean it's lagging behind.
Stock vs Market (SPY)
This shows performance against the broader S&P 500 index. This is important because even if a stock beats its sector, the entire sector might be weak. You want stocks that beat both their sector AND the market.
Sector vs Market
This reveals "sector rotation" - whether money is flowing into or out of this sector. When this number is positive, the whole sector is hot and leading the market. This is powerful because strong sectors tend to lift all boats, making it easier to find winners.
3. MULTI-PERIOD PERFORMANCE ANALYSIS
The indicator calculates performance across four timeframes simultaneously:
1 Month (1M) - Recent short-term momentum
3 Months (3M) - Medium-term trend strength
6 Months (6M) - Longer-term positioning
1 Year (1Y) - Full-cycle performance view
Why multiple periods matter:
A stock might look great over 1 month but terrible over 6 months - that's a red flag. The best stocks show consistent strength across all timeframes . When you see positive RS (Relative Strength) values across all four periods, you've found a stock with sustained outperformance.
Each row in the table shows:
- Raw performance percentage for that period
- RS value (the difference compared to benchmark)
- Color coding: Green for positive, red for negative, white for neutral
4. SECTOR LEADER COMPARISON
The indicator automatically identifies and compares your stock to the sector leader - the dominant stock in that industry.
Sector leaders by industry:
Technology: Apple (AAPL)
Healthcare: UnitedHealth (UNH)
Financial: JPMorgan Chase (JPM)
Energy: ExxonMobil (XOM)
Consumer Discretionary: Amazon (AMZN)
Consumer Staples: Walmart (WMT)
And more...
Why this matters:
Comparing to the leader shows you if you're trading a champion or a follower. If your stock consistently beats the sector leader, you've found something special. If it's lagging the leader, you might want to trade the leader instead.
Optional Custom Leader:
You can override the automatic leader and compare to any stock you choose. This is useful if you want to benchmark against a specific competitor or reference stock.
NEW! INDUSTRY ANALYSIS (STOCKS ONLY)
The indicator now provides multi-level analysis by automatically detecting and comparing your stock to its specific industry , not just the broad sector.
Why Industry matters:
Technology sector (XLK) contains many different industries: Software, Semiconductors, Hardware, etc. A software stock might beat the broad tech sector but lag behind other software companies. Industry analysis provides this granular view.
Industry ETF Mapping (30+ industries):
Software/Applications: IGV (iShares Software ETF)
Semiconductors: SMH (VanEck Semiconductor ETF)
Biotech: IBB (iShares Biotechnology ETF)
Pharmaceuticals: XPH (SPDR Pharmaceuticals ETF)
Banks: KBE (SPDR S&P Bank ETF)
Regional Banks: KRE (SPDR Regional Banking ETF)
Oil & Gas Exploration: XOP (SPDR Oil & Gas Exploration ETF)
Homebuilders: XHB (SPDR Homebuilders ETF)
Retail: XRT (SPDR S&P Retail ETF)
Aerospace & Defense: ITA (iShares U.S. Aerospace & Defense ETF)
And many more...
Industry Leader Mapping:
The indicator also identifies the leader within each industry:
Software: Microsoft (MSFT)
Semiconductors: NVIDIA (NVDA)
Biotech: Amgen (AMGN)
Pharmaceuticals: Eli Lilly (LLY)
Banks: JPMorgan (JPM)
Oil Exploration: ConocoPhillips (COP)
And more...
New Table Rows for Stocks:
Industry ETF Performance - How the specific industry performed (green background)
Industry Leader Performance - How the top stock in the industry performed
vs Industry RS - Your stock's outperformance vs its industry ETF
Industry vs Sector RS - Is this industry hot or cold within its sector?
vs Industry Leader RS - Your stock's performance vs the industry's best
Why this is powerful:
A stock that beats both its sector AND its industry is showing strength at every level. This indicates true relative strength, not just riding sector-wide momentum.
Optional Custom Industry:
You can override automatic detection for both Industry ETF and Industry Leader in settings.
5. RS SCORE & GRADING SYSTEM (0-100)
The heart of the indicator is the RS Score - a weighted calculation that distills all the performance data into one clear number from 0 to 100.
How the score is calculated:
FOR STOCKS (with Industry data):
The indicator splits the weight between Sector (60%) and Industry (40%):
SECTOR RS (60% of total weight):
1 Month RS: 24% weight (40% × 0.6)
3 Month RS: 18% weight (30% × 0.6)
6 Month RS: 12% weight (20% × 0.6)
1 Year RS: 6% weight (10% × 0.6)
INDUSTRY RS (40% of total weight):
1 Month RS: 16% weight (40% × 0.4)
3 Month RS: 12% weight (30% × 0.4)
6 Month RS: 8% weight (20% × 0.4)
1 Year RS: 4% weight (10% × 0.4)
FOR OTHER ASSETS (Crypto, Forex, Commodities):
Uses full 100% weight on benchmark:
1 Month RS: 40% weight
3 Month RS: 30% weight
6 Month RS: 20% weight
1 Year RS: 10% weight
It starts at 50 (neutral) and adds or subtracts points based on your asset's relative strength in each period.
Bonus points:
+5 points if the sector is outperforming the market (sector rotation is bullish)
+5 points if the industry is outperforming its sector (hot industry) - STOCKS ONLY
+5 points if RS momentum is improving (getting stronger over time)
-5 points if RS momentum is declining (getting weaker)
The final score is capped between 0-100.
Letter Grade System:
90-100: A+ - Elite performer, crushing the sector
85-89: A - Excellent, strong outperformer
80-84: A- - Very good, above average
75-79: B+ - Good, solid performer
70-74: B - Above average, decent strength
65-69: B- - Slightly above average
60-64: C+ - Average, neutral strength
55-59: C - Below average
50-54: C- - Weak, slight underperformance
45-49: D+ - Concerning weakness
40-44: D - Poor, significant underperformance
0-39: F - Failing, avoid this stock
What scores mean for trading:
- RS Score above 70: Strong stocks worth considering for long positions
- RS Score 50-70: Average stocks, better opportunities elsewhere
- RS Score below 50: Weak stocks, avoid or consider for shorts
6. CONSISTENCY SCORE
This metric shows what percentage of time periods show positive RS .
For STOCKS (with Industry data):
Counts both Sector RS periods AND Industry RS periods (up to 8 total periods):
- If a stock beats both sector and industry in all 4 periods each: Consistency = 100% (8/8)
- If it beats in 6 out of 8 total periods: Consistency = 75%
- If it beats in 4 out of 8 total periods: Consistency = 50%
For OTHER ASSETS:
Counts benchmark periods only (4 total):
- If it beats benchmark in all 4 periods (1M, 3M, 6M, 1Y): Consistency = 100%
- If it beats in 3 out of 4 periods: Consistency = 75%
- If it beats in 2 out of 4 periods: Consistency = 50%
Why consistency matters:
A high RS Score with low consistency might indicate a recent spike that could fade. The best stocks show both high RS Score AND high consistency - they're strong now AND have been strong historically at both the sector AND industry level.
Look for stocks with:
Consistency above 75%: Very reliable strength across all levels
Consistency 50-75%: Decent but check other metrics
Consistency below 50%: Weak or erratic, proceed with caution
7. BETA CALCULATION (Volatility Measure)
Beta measures how much more volatile your stock is compared to its sector.
Beta > 1.2 : High volatility - stock moves more aggressively than sector (marked as "High")
Beta 0.8-1.2 : Normal volatility - moves roughly in line with sector
Beta < 0.8 : Low volatility - stock is more stable than sector (marked as "Low")
Formula used:
Beta = Correlation(Stock, Sector) × (Standard Deviation of Stock / Standard Deviation of Sector)
This uses a 20-period calculation for reliability.
How to use Beta:
- High Beta stocks offer bigger gains but also bigger risks - good for aggressive traders
- Low Beta stocks are more defensive - good for conservative positions
- Match Beta to your risk tolerance and strategy
8. DAYS ABOVE/BELOW SECTOR
This tracks consecutive periods (bars) where your stock outperforms or underperforms its sector.
Days Above Sector:
Counts how many bars in a row your stock has beaten the sector.
10+ days: Strong sustained strength (shown in bright green)
5-9 days: Building momentum (shown in yellow)
1-4 days: Early strength (shown in white)
0 days: Not currently outperforming
Days Below Sector:
Counts how many bars in a row your stock has lagged the sector.
10+ days: Sustained weakness (shown in bright red)
5-9 days: Losing momentum (shown in orange)
1-4 days: Minor weakness (shown in white)
0 days: Not underperforming (this is good!)
Why this matters:
Long streaks show trend persistence. A stock with 15+ days above sector is riding strong momentum. A stock with 15+ days below sector is in a sustained downtrend relative to peers.
9. PRICE VS 52-WEEK HIGH
Shows where current price sits relative to its 52-week high (or equivalent for your timeframe).
95%+ (green) : Stock is near all-time highs - strong positioning
80-94% (yellow) : Stock is in a pullback but still relatively strong
Below 80% : Stock has pulled back significantly from highs
Why this matters:
The strongest stocks stay near their highs. When you see a stock with high RS Score AND price near 52W high, you've found a stock with institutional support and strong buying pressure.
10. RELATIVE VOLUME
Compares current volume to the 20-period average volume.
1.5x+ (green) : High volume - significant interest and participation
Around 1.0x : Average volume - normal trading activity
Below 1.0x : Low volume - less interest or inactive period
Why volume matters:
High relative volume confirms price moves. When a stock makes a strong move on 2x or 3x normal volume, it's more likely to sustain. Low volume moves are often just noise.
11. AVERAGE RS STRENGTH
This calculates the average absolute value of all RS readings across the four timeframes.
It shows the magnitude of divergence from the sector, regardless of direction. A high number means the stock moves very differently from its sector (could be much stronger or much weaker). A low number means it tracks closely with the sector.
High Average RS: Stock has strong character, moves independently
Low Average RS: Stock follows sector closely, lacks individual strength
12. SECTOR ROTATION SIGNAL
This indicator automatically detects when a sector is experiencing bullish rotation - meaning money is flowing into the sector and it's outperforming the broader market.
Condition for bullish rotation:
Sector must be beating SPY (market) in both 1-month AND 3-month periods.
Why this matters:
Stocks in hot sectors tend to perform better because they have tailwinds from sector-wide buying. When sector rotation is bullish and your stock has a high RS Score, you've found an ideal setup.
The indicator adds +5 bonus points to the RS Score when sector rotation is bullish.
13. MOMENTUM DETECTION
The indicator compares 1-month RS to 3-month RS to detect if momentum is improving or declining.
RS Momentum Improving: 1M RS is better than 3M RS - stock is getting stronger (adds +5 to score)
RS Momentum Declining: 1M RS is worse than 3M RS - stock is getting weaker (subtracts -5 from score)
Why momentum matters:
You want to catch stocks as momentum is building, not after it's already peaked. Improving momentum suggests the strength is accelerating, not fading.
14. OVERALL ASSESSMENT & RECOMMENDATION
The indicator provides two quick summary rows:
Overall Rating:
Based on grade and RS Score, you get an instant quality rating:
Strong Leader (A/A+) - Top tier stock, crushing it
Above Average (A-/B+) - Solid performer, better than most
Average (B/B-) - Middle of the pack
Below Average (C/C+) - Struggling, watch carefully
Underperformer (D/F) - Weak stock, underperforming badly
Trading Signal:
Combines multiple factors to give setup quality:
STRONG BUY SETUP - RS Score 70+, Consistency 75+, AND sector rotation bullish. This is the perfect storm - strong stock, consistent strength, hot sector.
BULLISH - RS Score 60+, Consistency 50+. Good quality stock worth considering.
NEUTRAL - RS Score 50+. Okay but not exciting, better opportunities exist.
WEAK - RS Score 40-49. Below average, risky.
AVOID - RS Score below 40. Stay away, too weak.
IMPORTANT: These are educational signals only, not financial advice. Always do your own analysis and risk management.
KEY FEATURES
1. AUTOMATIC EVERYTHING
- Auto-detects asset type (stock, crypto, forex, commodity, index)
- Auto-maps stocks to correct sector ETF (11 sectors covered)
- Auto-maps stocks to correct industry ETF (30+ industries covered)
- Auto-identifies sector leader AND industry leader
- Auto-selects appropriate market benchmark
- Zero configuration required - just add to chart
2. MULTI-ASSET SUPPORT
Works on all asset classes:
US Stocks - Compares to sector ETFs (XLK, XLF, XLV, etc.)
Crypto - Compares to Total Crypto Market Cap
Forex - Compares to currency indices (DXY, EXY, etc.)
Commodities - Compares to Gold (GLD)
Indices - Compares to broader market benchmarks
3. FLEXIBLE DISPLAY
9 table positions (top/middle/bottom, left/center/right)
4 size options (tiny, small, normal, large)
Show/hide table completely
Real-time indicator toggle
4. TIMEFRAME FLEXIBILITY
Choose your analysis timeframe:
Chart Timeframe (default) - Uses whatever timeframe your chart is on
Fixed: 1 Hour, 4 Hours, Daily, Weekly - Forces calculations to specific timeframe
This means you can be on a 5-minute chart but analyze RS on Daily timeframe if you prefer.
5. RS SCORE FILTERING
Set a minimum RS Score threshold to only see strong stocks:
Set to 0 - Shows all stocks
Set to 70 - Only displays stocks with RS Score 70+ (strong stocks only)
Warning message displays if stock doesn't meet threshold
Perfect for screening - quickly scan multiple charts and the indicator only shows tables for stocks that pass your quality filter.
6. CUSTOM LEADER COMPARISON
Override automatic leader detection:
Compare to any ticker you choose
Benchmark against specific competitors
Use your own reference stocks
7. COMPREHENSIVE TOOLTIPS
Every input parameter and every table row has detailed tooltips explaining:
What the metric measures
How to interpret the values
What thresholds indicate strength/weakness
Why it matters for trading
Hover over any element to learn - it's like having a trading coach built in.
8. SMART ALERTS
Built-in alert system for key events:
Divergence Alerts:
Get notified when your stock diverges significantly from its sector.
Bullish Divergence: Stock beating sector by threshold percentage
Bearish Divergence: Stock losing to sector by threshold percentage
Set your threshold (default 5%) - this determines how big a divergence triggers the alert.
RS Score Alerts:
Get notified when RS Score crosses your threshold:
Crossed Above: RS Score went from below to above your threshold (bullish)
Crossed Below: RS Score dropped from above to below threshold (bearish)
Set your threshold (default 70) to focus on strong stocks.
Sector Rotation Alert:
Fires when sector shows bullish rotation (outperforming market).
HOW TO USE THE INDICATOR
FOR SWING TRADERS:
1. Add indicator to your watchlist stocks
2. Look for RS Score 70+ with Consistency 75%+
3. Check if sector rotation is bullish (bonus!)
4. Verify price is near 52W high (95%+)
5. Wait for entry setup on your chart
6. Use stop loss below key support
Example Setup:
Stock shows:
- RS Score: 82 (Grade: A-)
- Consistency: 100% (strong across all periods)
- Sector Rotation: Bullish
- Price vs 52W High: 96%
- Days Above Sector: 12 days
- Relative Volume: 1.8x
This is a textbook strong stock in a hot sector near highs - ideal for swing long.
FOR POSITION TRADERS:
1. Focus on 6-month and 1-year RS values
2. Look for sustained outperformance (Consistency 75%+)
3. Prefer lower Beta stocks (less volatility)
4. Check Days Above Sector for trend persistence
5. Monitor RS Score monthly, exit if drops below 60
FOR ACTIVE TRADERS:
1. Use on intraday timeframes (1H or 4H)
2. Set RS Score filter to 60+ for quick screening
3. Enable Divergence Alerts
4. Watch for momentum improving signal
5. Higher Beta stocks offer more movement
FOR SHORT SELLERS:
1. Look for RS Score below 40 (Grade: D or F)
2. Check for declining momentum
3. Verify Days Below Sector is increasing (10+)
4. Sector rotation should be bearish
5. Price should be well off 52W high
WHAT MAKES A PERFECT SETUP:
The holy grail combination:
RS Score: 75+ (A- or better)
Consistency: 80%+ (strong across time - beats sector AND industry)
Sector Rotation: Bullish (hot sector)
Industry vs Sector: Positive (hot industry within sector)
Days Above Sector: 10+ (sustained strength)
Momentum: Improving (getting stronger)
Price vs 52W High: 90%+ (near highs)
Relative Volume: 1.5x+ (volume confirmation)
When you find this combination, you've located a stock with every advantage in its favor - strong at the stock level, industry level, AND sector level. That's multi-level confirmation of relative strength.
IMPORTANT NOTES
Data Reliability:
All calculations use lookahead=off for anti-repaint protection
Historical values will never change
Real-time indicator toggle only affects the visual clock icon, not data reliability
All security requests are properly configured to prevent future data leakage
Sector Mapping Notes:
Sector detection uses TradingView's sector field
Some stocks may not have sector data - indicator will adapt
Sector ETFs used: XLK, XLF, XLV, XLE, XLY, XLP, XLI, XLB, XLRE, XLU, XLC
Major market ETFs (SPY, QQQ, DIA) are treated as market benchmarks, not stocks
Multi-Asset Notes:
Crypto compares to CRYPTOCAP:TOTAL (total crypto market cap)
Forex compares to relevant currency index based on base currency
Commodities compare to Gold (GLD) as primary commodity benchmark
Custom leaders can be set for any asset type
FREQUENTLY ASKED QUESTIONS
Q: What does RS Score of 75 actually mean?
A: It means your stock is strongly outperforming its sector across multiple timeframes. The score is weighted toward recent performance (1-month gets 40% weight), so 75 indicates sustained relative strength with emphasis on current momentum.
Q: My stock has high RS Score but is going down. Why?
A: RS Score measures relative performance (vs sector/market), not absolute price direction. A stock can fall 5% while its sector falls 10% - that's still positive relative strength. In bear markets or sector corrections, high RS stocks often fall less than peers.
Q: Should I only trade stocks with RS Score above 70?
A: For long positions, yes - focus on 70+ scores. These stocks have proven they can beat their sector. However, for pairs trading or relative value plays, you might also short stocks with scores below 40 while longing stocks above 70.
Q: What if my stock doesn't have a sector?
A: The indicator handles this gracefully. If no sector is detected, it will compare directly to the market (SPY for stocks). Some rows may show N/A, but the indicator will still provide useful market-relative data.
Q: Why does the sector sometimes show N/A?
A: This happens when: 1) Your asset has no sector classification, 2) The stock IS the sector ETF itself, 3) You're analyzing a non-stock asset (crypto, forex, commodity). The indicator adapts by focusing on market-relative metrics instead.
Q: Can I use this on cryptocurrencies?
A: Yes! The indicator automatically detects crypto and compares to the Total Crypto Market Cap (CRYPTOCAP:TOTAL). You can also set a custom leader like Bitcoin (BTCUSD) to compare against the dominant crypto.
Q: What's the difference between RS Score and Consistency?
A: RS Score is the weighted average of how much you're beating the sector (magnitude). Consistency is what percentage of time periods show outperformance (reliability). You want both high - that means strong AND consistent.
Q: Do the alerts repaint?
A: No. All alerts fire only on bar close (barstate.isconfirmed) and use properly configured data with lookahead=off. Once an alert fires, it's final and won't change.
Q: What timeframe should I use?
A: For swing trading: Daily or Weekly. For day trading: 1H or 4H. For position trading: Weekly. Use "Chart Timeframe" mode and switch your chart timeframe to change the analysis period easily.
Q: Why is Days Above Sector showing 0?
A: This means your stock is not currently outperforming its sector. If Days Below Sector is also 0, it means the RS is exactly neutral (very rare). Check the actual RS values to see current standing.
Q: Can I compare to a different market benchmark than SPY?
A: Currently the indicator uses SPY (S&P 500) as the default US stock market benchmark. For crypto it uses CRYPTOCAP:TOTAL, for forex it uses currency indices, etc. The benchmark auto-adjusts based on asset type.
Q: What's a good Beta value?
A: It depends on your strategy. Aggressive traders prefer Beta above 1.2 (more volatility = bigger moves). Conservative traders prefer Beta 0.8-1.0 (more stable). Beta is neutral - it's about matching your risk tolerance.
Q: How often does the table update?
A: With Real-time Indicator enabled: Every tick (constant updates). With it disabled: Only on bar close. Either way, the underlying data is identical and non-repainting - the toggle only affects update frequency and the clock icon display.
Q: My stock is showing "AVOID" but it's up 50% this year. Is the indicator wrong?
A: Not necessarily. The indicator measures RELATIVE performance. If your stock is up 50% but the sector is up 100%, your stock is actually underperforming by 50%. The indicator helps you identify when you should switch to stronger stocks in the same sector.
Q: What does "Strong Buy Setup" really mean?
A: It means three things aligned: 1) RS Score above 70 (strong stock), 2) Consistency above 75% (reliable strength), 3) Sector rotation is bullish (hot sector). This combination historically correlates with stocks that continue outperforming. However, this is NOT financial advice - always do your own analysis.
Q: Can I use this for options trading?
A: Yes! High RS Score stocks make good candidates for call options (bullish bets) while low RS Score stocks may work for puts (bearish bets). Higher Beta stocks will have more volatile options (higher premiums but more movement).
Q: Why is my crypto showing N/A for sector?
A: Cryptocurrencies don't have "sectors" like stocks do. Instead, the indicator compares crypto to the total crypto market cap. This is normal and expected behavior.
Q: What happens if I'm analyzing an ETF?
A: If you're analyzing a sector ETF (like XLK), it will compare to SPY (market). If you're analyzing SPY itself, some comparisons won't be available (can't compare SPY to itself). The indicator intelligently adapts to avoid circular comparisons.
Q: What if my stock doesn't have industry data?
A: Not all stocks are mapped to specific industries (only 30+ major industries are covered). If no industry is detected, the indicator will still work using only sector analysis. The RS Score calculation will use 100% sector weight instead of the 60%/40% split.
Q: Why does Industry vs Sector matter?
A: Industry vs Sector shows if your specific industry is hot or cold within its broader sector. For example, Semiconductors (SMH) might be outperforming Technology sector (XLK) even though both are up. This helps you find not just strong sectors, but the strongest industries within those sectors.
Q: Can I disable Industry analysis?
A: Yes! In the "Industry Analysis" settings group, you can toggle off "Show Industry Analysis in Table" to hide all industry rows. However, even when hidden, industry data still contributes to the RS Score calculation for stocks.
Q: Why is my Consistency Score lower for stocks than other assets?
A: For stocks with industry data, Consistency counts 8 periods (4 Sector + 4 Industry periods) instead of just 4. This means the bar is higher - your stock needs to beat both sector AND industry consistently. A stock that beats sector in all 4 periods but lags industry in 2 periods will show 75% consistency (6/8), not 100%.
BEST PRACTICES
Use as a screening tool - Set RS Score filter to 70+ and quickly scan your watchlist. Only strong stocks will show the table.
Combine with technical analysis - RS Score tells you WHAT to trade, your chart tells you WHEN to enter.
Check multiple timeframes - Switch between Daily and Weekly to see if strength holds across different time horizons.
Monitor sector rotation - When sector goes from bearish to bullish rotation, it's often a great time to enter stocks in that sector.
Watch Industry vs Sector - Stocks in hot industries within hot sectors have double tailwinds. Prioritize Industry vs Sector positive values.
Pay attention to consistency - High RS Score with low consistency might be a spike that fades. Look for 70%+ consistency across BOTH sector and industry.
Use the leader comparison - If your stock consistently beats both sector leader AND industry leader, you may have found the next champion.
Watch days above/below sector - Long streaks (15+ days) indicate strong trends. Look for these in conjunction with high RS Score.
Set alerts on key stocks - Enable RS Score alerts at 70 threshold to get notified when watchlist stocks become strong.
Consider Beta for position sizing - Size smaller positions in high Beta stocks, larger in low Beta stocks for balanced risk.
Exit when RS Score drops - If a stock's RS Score falls below 60, consider reducing or exiting - the strength may be fading.
Leverage industry-level insight - If Industry ETF is weak but stock is strong, that's standout strength. If Industry is hot but stock is lagging, consider switching to the industry leader instead.
SETTINGS EXPLAINED
Display Settings:
Show Performance Table - Master on/off switch for the table
Table Position - 9 positions available (corners, edges, center)
Table Size - 4 sizes (tiny, small, normal, large) for different screen sizes
Timeframe Settings:
Chart Timeframe (recommended) - Dynamic, uses whatever chart TF you're on
Fixed Timeframes - Locks analysis to 1H, 4H, Daily, or Weekly regardless of chart
Filtering Settings:
Minimum RS Score - Set threshold (0-100) for displaying table
Show Warning - When enabled, displays message if stock doesn't meet filter
Alert Settings:
Divergence Alerts - Enable alerts when stock diverges from sector
Threshold (%) - How big a divergence triggers alert (default 5%)
RS Score Alerts - Enable alerts when RS Score crosses threshold
Threshold - What RS Score level triggers alert (default 70)
Sector Analysis Settings:
Use Custom Sector ETF - Override automatic sector ETF detection
Sector ETF Symbol - Enter any sector ETF to compare against
Use Custom Sector Leader - Override automatic sector leader detection
Sector Leader Symbol - Enter any ticker as sector leader
Industry Analysis Settings:
Use Custom Industry ETF - Override automatic industry ETF detection
Industry ETF Symbol - Enter specific industry ETF (e.g., IGV, SMH)
Use Custom Industry Leader - Override automatic industry leader detection
Industry Leader Symbol - Enter specific industry leader
Show Industry Analysis - Toggle all industry rows on/off
Display Settings:
Show Real-time Indicator - Toggle clock icon in header (doesn't affect data)
WHAT THIS INDICATOR DOESN'T DO
To set proper expectations:
Does NOT provide entry/exit signals - this is a strength analyzer, not a trading system
Does NOT predict future price movement - shows current and historical relative strength
Does NOT guarantee profits - strong RS stocks can still decline
Does NOT replace your own analysis - use as one tool among many
Does NOT work on stocks with no sector data - will adapt but some rows show N/A
This indicator is a decision support tool . It helps you identify which stocks are showing relative strength so you can make more informed trading decisions. You still need your own entry strategy, risk management, and position sizing rules.
SUPPORT & CONTACT
Questions or feedback? Use the comments section below or send me a message.
If you find this indicator useful, please give it a boost and share with other traders who might benefit from relative strength analysis.
FINAL REMINDER
This indicator is a tool for analyzing relative strength - it shows you which stocks are outperforming their sector and market. It does NOT provide financial advice or trade signals. Always conduct your own research, manage your risk appropriately, and consult with a financial advisor before making investment decisions.
Past performance of relative strength does not guarantee future results. Strong stocks can become weak, and sectors rotate in and out of favor. Use this indicator as part of a comprehensive trading strategy, not as a standalone decision-making system.
Trade smart, manage risk, and may your RS Scores stay high!
If you got till here and you like my work a BOOST and a COMMENT would make me happy
MTF Supertrend by Rakesh Sharma📊 MULTI-TIMEFRAME SUPERTREND INDICATOR
Get clear buy and sell signals from the powerful Supertrend indicator across three critical timeframes - all on one chart!
🎯 WHAT IT DOES:
This indicator analyzes the Supertrend across Monthly, Weekly, and Daily timeframes simultaneously, giving you a complete picture of market trends from short-term to long-term perspectives.
✨ KEY FEATURES:
- 📍 Visual Signal Labels: Clear buy/sell labels appear directly on your chart when Supertrend changes direction
- Daily signals (D-BUY/D-SELL) - Small green/red labels
- Weekly signals (W-BUY/W-SELL) - Medium blue/orange labels
- Monthly signals (M-BUY/M-SELL) - Large lime/maroon labels
- 📋 Live Summary Table: Real-time dashboard showing:
- Current trend direction for each timeframe (Bullish ▲ or Bearish ▼)
- Supertrend price levels
- Color-coded for quick reading
- 🎨 Visual Trend Confirmation:
- Supertrend line plotted on current timeframe
- Background color indicating current trend
- ⚙️ Fully Customizable:
- Adjustable ATR Period (default: 10)
- Adjustable Factor (default: 3.0)
- Toggle any timeframe on/off
- Show/hide summary table
🚀 HOW TO USE:
1. **Best Trades**: Look for alignment across multiple timeframes
- All 3 timeframes bullish = Strong buy opportunity
- All 3 timeframes bearish = Strong sell opportunity
2. **Signal Strength**:
- Monthly signals = Strongest, least frequent (major trend changes)
- Weekly signals = Medium strength, moderate frequency
- Daily signals = Most frequent, good for entries/exits
3. **Risk Management**:
- Use Supertrend levels as stop-loss points
- Higher timeframe trends act as confirmation for lower timeframe trades
4. **Settings Optimization**:
- Lower ATR period (7-8) = More sensitive, more signals
- Higher ATR period (12-14) = Less sensitive, fewer false signals
- Lower Factor (2.0-2.5) = Tighter stops, more signals
- Higher Factor (3.5-4.0) = Wider stops, fewer signals
💡 TRADING STRATEGY EXAMPLES:
**Conservative Approach:**
- Only take trades when all 3 timeframes align
- Use monthly trend as overall direction filter
- Enter on daily signals in direction of weekly/monthly trend
**Aggressive Approach:**
- Trade daily signals independently
- Use weekly/monthly as confirmation
- Quick entries and exits
**Swing Trading:**
- Focus on weekly signals
- Use monthly for trend direction
- Use daily for precise entry timing
⚠️ IMPORTANT NOTES:
- This is a trend-following indicator - works best in trending markets
- May generate whipsaws in choppy/sideways markets
- Always use proper risk management and position sizing
- Combine with volume analysis and support/resistance for best results
- Past performance does not guarantee future results
📈 BEST MARKETS:
Works on all markets: Stocks, Forex, Crypto, Commodities, Indices
⏰ BEST TIMEFRAMES:
Can be applied to any chart timeframe, but works best on:
- 1H to 4H charts for intraday trading
- Daily charts for swing trading
- Weekly charts for position trading
🔧 DEFAULT SETTINGS:
- ATR Period: 10
- Factor: 3.0
- All timeframes enabled
- Summary table visible
Feel free to adjust settings based on your trading style and the asset's volatility!
📚 ABOUT SUPERTREND:
Supertrend is a trend-following indicator that uses ATR (Average True Range) to plot dynamic support and resistance levels. It helps identify the current trend direction and potential reversal points.
---
💬 Questions or suggestions? Leave a comment below!
⭐ If you find this indicator helpful, please give it a boost!
Happy Trading! 🎯
NormalizedIndicatorsNormalizedIndicators Library - Comprehensive Trend Normalization & Pre-Calibrated Systems
Overview
The NormalizedIndicators Library is an advanced Pine Script™ collection that provides normalized trend-following indicators, calculation functions, and pre-calibrated consensus systems for technical analysis. This library extends beyond simple indicator normalization by offering battle-tested, optimized parameter sets for specific assets and timeframes.
The main advantage lies in its dual functionality:
Individual normalized indicators with standardized outputs (1 = bullish, -1 = bearish, 0 = neutral)
Pre-calibrated consensus functions that combine multiple indicators with asset-specific optimizations
This enables traders to either build custom strategies using individual indicators or leverage pre-optimized systems designed for specific markets.
📊 Library Structure
The library is organized into three main sections:
1. Trend-Following Indicators
Individual indicators normalized to standard output format
2. Calculation Indicators
Statistical and mathematical analysis functions
3. Pre-Calibrated Systems ⭐ NEW
Asset-specific consensus configurations with optimized parameters
🔄 Trend-Following Indicators
Stationary Indicators
These oscillate around a fixed value and are not bound to price.
TSI() - True Strength Index ⭐ NEW
Source: TradingView
Parameters:
price: Price source
long: Long smoothing period
short: Short smoothing period
signal: Signal line period
Logic: Double-smoothed momentum oscillator comparing TSI to its signal line
Signal:
1 (bullish): TSI ≥ TSI EMA
0 (bearish): TSI < TSI EMA
Use Case: Momentum confirmation with trend direction
SMI() - Stochastic Momentum Index ⭐ NEW
Source: TradingView
Parameters:
src: Price source
lengthK: Stochastic period
lengthD: Smoothing period
lengthEMA: Signal line period
Logic: Enhanced stochastic that measures price position relative to midpoint of high/low range
Signal:
1 (bullish): SMI ≥ SMI EMA
0 (bearish): SMI < SMI EMA
Use Case: Overbought/oversold with momentum direction
BBPct() - Bollinger Bands Percent
Source: Algoalpha X Sushiboi77
Parameters:
Length: Period for Bollinger Bands
Factor: Standard deviation multiplier
Source: Price source (typical: close)
Logic: Calculates the position of price within the Bollinger Bands as a percentage
Signal:
1 (bullish): when positionBetweenBands > 50
-1 (bearish): when positionBetweenBands ≤ 50
Special Feature: Uses an array to store historical standard deviations for additional analysis
RSI() - Relative Strength Index
Source: TradingView
Parameters:
len: RSI period
src: Price source
smaLen: Smoothing period for RSI
Logic: Classic RSI with additional SMA smoothing
Signal:
1 (bullish): RSI-SMA > 50
-1 (bearish): RSI-SMA < 50
0 (neutral): RSI-SMA = 50
Non-Stationary Indicators
These follow price movement and have no fixed boundaries.
NorosTrendRibbonSMA() & NorosTrendRibbonEMA()
Source: ROBO_Trading
Parameters:
Length: Moving average and channel period
Source: Price source
Logic: Creates a price channel based on the highest/lowest MA value over a specified period
Signal:
1 (bullish): Price breaks above upper band
-1 (bearish): Price breaks below lower band
0 (neutral): Price within channel (maintains last state)
Difference: SMA version uses simple moving averages, EMA version uses exponential
TrendBands()
Source: starlord_xrp
Parameters: src (price source)
Logic: Uses 12 EMAs (9-30 period) and checks if all are rising or falling simultaneously
Signal:
1 (bullish): All 12 EMAs are rising
-1 (bearish): All 12 EMAs are falling
0 (neutral): Mixed signals
Special Feature: Very strict conditions - extremely strong trend filter
Vidya() - Variable Index Dynamic Average
Source: loxx
Parameters:
source: Price source
length: Main period
histLength: Historical period for volatility calculation
Logic: Adaptive moving average that adjusts to volatility
Signal:
1 (bullish): VIDYA is rising
-1 (bearish): VIDYA is falling
VZO() - Volume Zone Oscillator
Parameters:
source: Price source
length: Smoothing period
volumesource: Volume data source
Logic: Combines price and volume direction, calculates the ratio of directional volume to total volume
Signal:
1 (bullish): VZO > 14.9
-1 (bearish): VZO < -14.9
0 (neutral): VZO between -14.9 and 14.9
TrendContinuation()
Source: AlgoAlpha
Parameters:
malen: First HMA period
malen1: Second HMA period
theclose: Price source
Logic: Uses two Hull Moving Averages for trend assessment with neutrality detection
Signal:
1 (bullish): Uptrend without divergence
-1 (bearish): Downtrend without divergence
0 (neutral): Trend and longer MA diverge
LeonidasTrendFollowingSystem()
Source: LeonidasCrypto
Parameters:
src: Price source
shortlen: Short EMA period
keylen: Long EMA period
Logic: Simple dual EMA crossover system
Signal:
1 (bullish): Short EMA < Key EMA
-1 (bearish): Short EMA ≥ Key EMA
ysanturtrendfollower()
Source: ysantur
Parameters:
src: Price source
depth: Depth of Fibonacci weighting
smooth: Smoothing period
bias: Percentage bias adjustment
Logic: Complex system with Fibonacci-weighted moving averages and bias bands
Signal:
1 (bullish): Weighted MA > smoothed MA (with upward bias)
-1 (bearish): Weighted MA < smoothed MA (with downward bias)
0 (neutral): Within bias zone
TRAMA() - Trend Regularity Adaptive Moving Average
Source: LuxAlgo
Parameters:
src: Price source
length: Adaptation period
Logic: Adapts to trend regularity - accelerates in stable trends, slows in consolidations
Signal:
1 (bullish): Price > TRAMA
-1 (bearish): Price < TRAMA
0 (neutral): Price = TRAMA
HullSuite()
Source: InSilico
Parameters:
_length: Base period
src: Price source
_lengthMult: Length multiplier
Logic: Uses Hull Moving Average with lagged comparisons for trend determination
Signal:
1 (bullish): Current Hull > Hull 2 bars ago
-1 (bearish): Current Hull < Hull 2 bars ago
0 (neutral): No change
STC() - Schaff Trend Cycle
Source: shayankm (described as "Better MACD")
Parameters:
length: Cycle period
fastLength: Fast MACD period
slowLength: Slow MACD period
src: Price source
Logic: Combines MACD concepts with stochastic normalization for early trend signals
Signal:
1 (bullish): STC is rising
-1 (bearish): STC is falling
🧮 Calculation Indicators
These functions provide specialized mathematical calculations for advanced analysis.
LCorrelation() - Long-term Correlation
Creator: unicorpusstocks
Parameters:
Input: First time series
Compare: Second time series
Logic: Calculates the average of correlations across 6 different periods (30, 60, 90, 120, 150, 180)
Returns: Correlation value between -1 and 1
Application: Long-term relationship analysis between assets, markets, or indicators
MCorrelation() - Medium-term Correlation
Creator: unicorpusstocks
Parameters:
Input: First time series
Compare: Second time series
Logic: Calculates the average of correlations across 6 different periods (15, 30, 45, 60, 75, 90)
Returns: Correlation value between -1 and 1
Application: Medium-term relationship analysis with higher sensitivity
assetBeta() - Beta Coefficient
Creator: unicorpusstocks
Parameters:
measuredSymbol: The asset to be measured
baseSymbol: The reference asset (e.g., market index)
Logic:
Calculates Beta across 4 different time horizons (50, 100, 150, 200 periods)
Beta = Correlation × (Asset Standard Deviation / Market Standard Deviation)
Returns the average of all 4 Beta values
Returns: Beta value (typically 0-2, can be higher/lower)
Interpretation:
Beta = 1: Asset moves in sync with the market
Beta > 1: Asset more volatile than market
Beta < 1: Asset less volatile than market
Beta < 0: Asset moves inversely to the market
🎯 Pre-Calibrated Systems ⭐ NEW FEATURE
These are ready-to-use consensus functions with optimized parameters for specific assets and timeframes. Each calibration has been fine-tuned through extensive backtesting to provide optimal performance for its target market.
Universal Calibrations
virtual_4d_cal(src) - Virtual/General 4-Day Timeframe
Use Case: General purpose 4-day chart analysis
Optimized For: Broad crypto market on 4D timeframe
Indicators Used: BBPct, Noro's, RSI, VIDYA, HullSuite, TrendContinuation, Leonidas, TRAMA
Characteristics: Balanced sensitivity for swing trading
virtual_1d_cal(src) - Virtual/General 1-Day Timeframe
Use Case: General purpose daily chart analysis
Optimized For: Broad crypto market on 1D timeframe
Indicators Used: BBPct, Noro's, RSI, VIDYA, HullSuite, TrendContinuation, Leonidas, TRAMA
Characteristics: Standard daily trading parameters
Cryptocurrency Specific
sui_cal(src) - SUI Ecosystem Tokens
Use Case: Tokens in the SUI blockchain ecosystem
Timeframe: 1D
Characteristics: Fast-response parameters for high volatility projects
deep_1d_cal(src) - DEEP Token Daily
Use Case: Deepbook (DEEP) token analysis
Timeframe: 1D
Characteristics: Tuned for liquidity protocol token behavior
wal_1d_cal(src) - WAL Token Daily
Use Case: Specific for WAL token
Timeframe: 1D
Characteristics: Mid-range sensitivity parameters
sns_1d_cal(src) - SNS Token Daily
Use Case: Specific for SNS token
Timeframe: 1D
Characteristics: Balanced parameters for DeFi tokens
meme_cal(src) - Meme Coin Calibration
Use Case: Highly volatile meme coins
Timeframe: Various
Characteristics: Wider parameters to handle extreme volatility
Warning: Meme coins carry extreme risk
base_cal(src) - BASE Ecosystem Tokens
Use Case: Tokens on the BASE blockchain
Timeframe: Various
Characteristics: Optimized for L2 ecosystem tokens
Solana Ecosystem
sol_4d_cal(src) - Solana 4-Day
Use Case: SOL token on 4-day charts
Characteristics: Responsive parameters for major L1 blockchain
sol_meme_4d_cal(src) - Solana Meme Coins 4-Day
Use Case: Meme coins on Solana blockchain
Timeframe: 4D
Characteristics: Handles high volatility of Solana meme sector
Ethereum Ecosystem
eth_4d_cal(src) - Ethereum 4-Day
Use Case: ETH and major ERC-20 tokens
Timeframe: 4D
Indicators Used: BBPct, Noro's, RSI, TSI, HullSuite, TrendContinuation, Leonidas, SMI
Special: Uses TSI and SMI instead of VIDYA and TRAMA
Characteristics: Tuned for Ethereum's market cycles
Bitcoin
btc_4d_cal(src) - Bitcoin 4-Day
Use Case: Bitcoin on 4-day charts
Timeframe: 4D
Characteristics: Slower, smoother parameters for the most established crypto asset
Notes: Conservative parameters suitable for position trading
Traditional Markets
qqq_4d_cal(src) - QQQ (Nasdaq-100 ETF) 4-Day
Use Case: QQQ ETF and tech-heavy indices
Timeframe: 4D
Characteristics: Largest parameter sets reflecting lower volatility of traditional markets
Notes: Can be adapted for similar large-cap tech indices
💡 Usage Examples
Example 1: Using Pre-Calibrated System
pinescriptimport unicorpusstocks/NormalizedIndicators/1 as lib
// Simple one-line implementation for Bitcoin
btcSignal = lib.btc_4d_cal(close)
// Trading logic
longCondition = btcSignal > 0.5
shortCondition = btcSignal < -0.5
// Plot
plot(btcSignal, "BTC 4D Consensus", color.orange)
Example 2: Custom Multi-Indicator Consensus
pinescriptimport unicorpusstocks/NormalizedIndicators/1 as lib
// Build your own combination
signal1 = lib.BBPct(20, 2.0, close)
signal2 = lib.RSI(14, close, 5)
signal3 = lib.TRAMA(close, 50)
signal4 = lib.TSI(close, 25, 13, 13)
// Custom consensus
customConsensus = math.avg(signal1, signal2, signal3, signal4)
plot(customConsensus, "Custom Consensus", color.blue)
Example 3: Asset-Specific Strategy Switching
pinescriptimport unicorpusstocks/NormalizedIndicators/1 as lib
// Automatically use the right calibration
signal = switch syminfo.ticker
"BTCUSD" => lib.btc_4d_cal(close)
"ETHUSD" => lib.eth_4d_cal(close)
"SOLUSD" => lib.sol_4d_cal(close)
"QQQ" => lib.qqq_4d_cal(close)
=> lib.virtual_4d_cal(close) // Default
plot(signal, "Auto-Calibrated Signal", color.orange)
Example 4: Correlation-Filtered Trading
pinescriptimport unicorpusstocks/NormalizedIndicators/1 as lib
// Only trade when strong correlation with market exists
spy = request.security("SPY", timeframe.period, close)
correlation = lib.MCorrelation(close, spy)
trendSignal = lib.virtual_1d_cal(close)
// Only signals with positive market correlation
tradeBuy = trendSignal > 0.5 and correlation > 0.5
tradeSell = trendSignal < -0.5 and correlation > 0.5
Example 5: Beta-Adjusted Position Sizing
pinescriptimport unicorpusstocks/NormalizedIndicators/1 as lib
spy = request.security("SPY", timeframe.period, close)
beta = lib.assetBeta(close, spy)
// Adjust position size based on Beta
basePositionSize = 100
adjustedSize = basePositionSize / beta // Less size with high Beta
// Use with calibrated signal
signal = lib.qqq_4d_cal(close)
🎯 Choosing the Right Calibration
Decision Tree
1. What asset are you trading?
Bitcoin → btc_4d_cal()
Ethereum/ERC-20 → eth_4d_cal()
Solana → sol_4d_cal()
Solana memes → sol_meme_4d_cal()
SUI ecosystem → sui_cal()
BASE ecosystem → base_cal()
Meme coins (any chain) → meme_cal()
QQQ/Tech indices → qqq_4d_cal()
Other/General → virtual_4d_cal() or virtual_1d_cal()
2. What timeframe?
Most calibrations are optimized for 4D (4-day) or 1D (daily)
For other timeframes, start with virtual calibrations and adjust
3. What's the asset's volatility?
High volatility (memes, new tokens) → Use meme_cal() or similar
Medium volatility (established alts) → Use specific calibrations
Low volatility (BTC, major indices) → Use btc_4d_cal() or qqq_4d_cal()
⚙️ Technical Details
Normalization Standard
Bullish: 1
Bearish: -1
Neutral: 0 (only for selected indicators)
Calibration Methodology
Pre-calibrated functions were optimized using:
Historical backtesting on target assets
Parameter optimization for maximum Sharpe ratio
Validation on out-of-sample data
Real-time forward testing
Iterative refinement based on market conditions
Advantages of Pre-Calibrations
Instant Deployment: No parameter tuning needed
Asset-Optimized: Tailored to specific market characteristics
Tested Performance: Validated through extensive backtesting
Consistent Framework: All use the same 8-indicator structure
Easy Comparison: Compare different assets using same methodology
Performance Considerations
All functions are optimized for Pine Script v5
Proper use of var for state management
Efficient array operations where needed
Minimal recursive calls
Pre-calibrations add negligible computational overhead
📋 License
This code is subject to the Mozilla Public License 2.0 at mozilla.org
🔧 Installation
pinescriptimport unicorpusstocks/NormalizedIndicators/1
Then use functions with your chosen alias:
pinescript// Individual indicators
lib.BBPct(20, 2.0, close)
lib.RSI(14, close, 5)
lib.TSI(close, 25, 13, 13)
// Pre-calibrated systems
lib.btc_4d_cal(close)
lib.eth_4d_cal(close)
lib.meme_cal(close)
⚠️ Important Notes
General Usage
All indicators are lagging, as is typical for trend-following indicators
Signals should be combined with additional analysis (volume, support/resistance, etc.)
Backtesting is recommended before starting live trading with these signals
Different assets and timeframes may require different parameter optimizations
Pre-Calibrated Systems
Calibrations are optimized for specific timeframes - using them on different timeframes may reduce effectiveness
Market conditions change - what worked historically may need adjustment
Pre-calibrations are starting points, not guaranteed solutions
Always validate performance on your specific use case
Consider current market regime (trending vs. ranging)
Risk Management
Meme coin calibrations are designed for extremely volatile assets - use appropriate position sizing
Pre-calibrated systems do not eliminate risk
Always use stop losses and proper risk management
Past performance does not guarantee future results
Customization
Pre-calibrations can serve as templates for your own optimizations
Feel free to adjust individual parameters within calibration functions
Test modifications thoroughly before live deployment
🎓 Advanced Use Cases
Multi-Asset Portfolio Dashboard
Create a dashboard showing consensus across different assets:
pinescriptimport unicorpusstocks/NormalizedIndicators/1 as lib
btc = request.security("BTCUSD", "4D", close)
eth = request.security("ETHUSD", "4D", close)
sol = request.security("SOLUSD", "4D", close)
btcSignal = lib.btc_4d_cal(btc)
ethSignal = lib.eth_4d_cal(eth)
solSignal = lib.sol_4d_cal(sol)
// Plot all three for comparison
plot(btcSignal, "BTC", color.orange)
plot(ethSignal, "ETH", color.blue)
plot(solSignal, "SOL", color.purple)
Regime Detection
Use correlation and calibrations together:
pinescriptimport unicorpusstocks/NormalizedIndicators/1 as lib
// Detect market regime
btc = request.security("BTCUSD", timeframe.period, close)
correlation = lib.MCorrelation(close, btc)
// Choose strategy based on correlation
signal = correlation > 0.7 ? lib.btc_4d_cal(close) : lib.virtual_4d_cal(close)
Comparative Analysis
Compare asset-specific vs. general calibrations:
pinescriptimport unicorpusstocks/NormalizedIndicators/1 as lib
specificSignal = lib.btc_4d_cal(close) // BTC-specific
generalSignal = lib.virtual_4d_cal(close) // General
divergence = specificSignal - generalSignal
plot(divergence, "Calibration Divergence", color.yellow)
🚀 Quick Start Guide
For Beginners
Identify Your Asset: What are you trading?
Find the Calibration: Use the decision tree above
One-Line Implementation: signal = lib.btc_4d_cal(close)
Set Thresholds: Buy when > 0.5, sell when < -0.5
Add Risk Management: Always use stops
For Advanced Users
Start with Pre-Calibration: Use as baseline
Analyze Performance: Backtest on your specific market
Fine-Tune Parameters: Adjust individual indicators if needed
Combine with Other Signals: Volume, market structure, etc.
Create Custom Calibrations: Build your own based on library structure
For Developers
Import Library: Access all functions
Mix and Match: Combine indicators creatively
Build Custom Logic: Use indicators as building blocks
Create New Calibrations: Follow the established pattern
Share and Iterate: Contribute to the trading community
🎯 Key Takeaways
✅ 10 normalized indicators - Consistent interpretation across all
✅ 16+ pre-calibrated systems - Ready-to-use for specific assets
✅ Asset-optimized parameters - No guesswork required
✅ Calculation functions - Advanced correlation and beta analysis
✅ Universal framework - Works across crypto, stocks, forex
✅ Professional-grade - Built on proven technical analysis principles
✅ Flexible architecture - Use pre-calibrations or build your own
✅ Battle-tested - Validated through extensive backtesting
NormalizedIndicators Library transforms complex multi-indicator analysis into actionable signals through both customizable individual indicators and pre-optimized consensus systems. Whether you're a beginner looking for plug-and-play solutions or an advanced trader building sophisticated strategies, this library provides the foundation for data-driven trading decisions.WiederholenClaude kann Fehler machen. Bitte überprüfen Sie die Antworten. Sonnet 4.5
MTF Checklist DashboardMTF Checklist Dashboard
Overview
The MTF Checklist Dashboard is an advanced multi-timeframe analysis tool that provides traders with a comprehensive visual dashboard to analyze market conditions across six customizable timeframes simultaneously. This indicator combines multiple technical analysis methods, including Opening Range Breakouts (ORB), VWAP, EMAs, and daily price levels, to generate high-probability confluence-based trading signals.
Unlike traditional single-timeframe indicators, this dashboard displays all critical information in one organized table, allowing traders to instantly identify when multiple timeframes align for optimal entry and exit opportunities.
Key Features
Multi-Timeframe Analysis
Analyzes up to 6 timeframes simultaneously (default: 1m, 5m, 15m, 30m, 1h, 4h)
Fully customizable timeframe selection via comma-separated input
Color-coded cells for instant visual recognition (green=bullish, red=bearish, yellow=neutral)
Technical Indicators Tracked
Current and previous candle direction
Opening Range Breakout (ORB) positioning with custom period
VWAP relationship (above/below)
200 EMA positioning
Daily and previous day high/low proximity
EMA crossovers (9 vs 21, both vs 200)
Advanced Signal Filtering System
Confluence scoring: Requires multiple timeframes to align (3-6 timeframes)
Higher timeframe confirmation: Ensures 30m/1h/4h agreement
Volume filter: Confirms signals with above-average volume (1.5x default)
ATR volatility filter: Validates sufficient market movement
Session timing: Restricts signals to optimal trading hours (EST)
Momentum confirmation: Requires recent directional strength
Range positioning: Blocks signals near daily extremes
Candle strength: Validates strong directional candles (60%+ body ratio)
Visual Signals
Optional entry arrows (above/below bars)
Background color highlighting
Organized dashboard with real-time price levels
ORB range, current day, and previous day summary rows
Alert Conditions
JSON-formatted alerts for automated trading integration
Separate alerts for long entry, short entry, long exit, and short exit
Compatible with webhook automation systems
How To Use
Dashboard Interpretation
The dashboard displays a color-coded table with the following columns:
TF: Timeframe being analyzed
C: Current candle (Green=bullish, Red=bearish)
P: Previous candle (Green=bullish, Red=bearish)
ORB: Opening Range Breakout position (A=Above, B=Below, W=Within)
VWAP: Price vs VWAP (A=Above, B=Below)
E200: Price vs 200 EMA (A=Above, B=Below)
D Hi/Lo: Proximity to current day high/low (Hi/Lo/Mid)
PD Hi/Lo: Proximity to previous day high/low (Hi/Lo/Mid)
9 vs 21: EMA 9 vs EMA 21 relationship (A=9 above 21, B=9 below 21)
9&21 v200: Both EMAs vs 200 EMA (>>=both above, <<=both below, <>=mixed)
Signal Generation
Long Entry Signal triggers when:
Minimum number of timeframes show bullish alignment (default: 5 of 6)
Higher timeframes (30m/1h/4h) confirm direction (default: 2 of 3)
Price breaks above ORB high with sufficient distance
Volume exceeds average by specified multiplier
ATR shows adequate volatility
Trade occurs during optimal session hours
Recent momentum is upward
Price not too close to daily high
Strong bullish candle forms
Short Entry Signal uses opposite conditions
Exit Signals trigger when opposing timeframe confluence reaches threshold (default: 3 timeframes)
Recommended Workflow
Select your asset and primary trading timeframe
Observe the dashboard - Look for rows showing mostly green (bullish) or red (bearish)
Wait for alignment - The indicator will show arrows when confluence requirements are met
Check the bottom rows - Review ORB levels and daily ranges for context
Set alerts - Enable TradingView alerts using the built-in alert conditions
Manage risk - Use appropriate position sizing and stop losses based on ORB range or daily ATR
Settings Guide
Basic Settings
Timeframes: Enter comma-separated values (e.g., "1,5,15,30,60,240")
Show Header: Toggle column headers on/off
ORB Minutes: Set opening range period (default: 15 minutes)
Near % for daily highs/lows: Define proximity threshold (default: 0.20%)
Use close for comparisons: Compare using close vs current price
Dashboard Position: Choose from 9 screen positions
Confluence Filters
Minimum Timeframes Aligned: Set required confluence (3-6, default: 5)
Require Higher Timeframe Confirmation: Toggle HTF requirement on/off
Min Higher Timeframes: Specify HTF agreement needed (1-3, default: 2)
Volume Filter
Volume Confirmation: Enable/disable volume filtering
Volume vs Average: Set multiplier threshold (default: 1.5x)
Volume Average Length: Period for volume average (default: 20 bars)
Volatility Filter (ATR)
Volatility Filter: Enable/disable ATR confirmation
ATR Length: Calculation period (default: 14)
Min ATR vs Average: Required ATR level (default: 0.5x = 50%)
ORB Filters
ORB Breakout Distance Required: Toggle distance requirement
Min Breakout % Beyond ORB: Additional breakout threshold (default: 0.10%)
Session Filter
Trade Only During Best Hours: Enable time-based filtering
Session 1: First trading window (default: 0930-1130 EST)
Session 2: Second trading window (default: 1400-1530 EST)
Momentum Filter
Recent Momentum Required: Enable directional momentum check
Lookback Bars: Period for momentum comparison (default: 3 bars)
Daily Range Filter
Block Signals Near Daily Extremes: Prevent entries at extremes
Distance from High/Low %: Minimum distance required (default: 2.0%)
Candle Filter
Strong Directional Candle: Require candle strength
Min Candle Body %: Body-to-range ratio threshold (default: 60%)
Visual Signals
Show Entry Signals: Master toggle for visual signals
Show Arrows: Display entry arrows on chart
Background Color: Enable background highlighting
Best Practices
Start with default settings and adjust based on your trading style and asset volatility
Higher confluence requirements (5-6 timeframes) produce fewer but higher-quality signals
Enable all filters for conservative trading; disable some for more frequent signals
Use the dashboard as confirmation alongside your existing trading strategy
Backtest on your specific instruments before live trading
Consider market conditions—trending vs ranging markets may require different settings
Alerts
This indicator includes four alert conditions with JSON formatting for webhook integration:
Long Entry Signal: Triggers when all long conditions are met
Short Entry Signal: Triggers when all short conditions are met
Long Exit Signal: Triggers when opposing confluence reaches exit threshold
Short Exit Signal: Triggers when opposing confluence reaches exit threshold
Alert messages include ticker symbol, action (buy/sell), price, and quantity for automated trading systems.
Important Notes
This indicator works best on liquid instruments with clear price action
Highly volatile markets may require adjusted ATR and ORB distance settings
Session times are in EST timezone—adjust if trading non-US markets
The ORB calculation requires sufficient price history for the day
Signals are generated in real-time but should be confirmed at candle close
Limitations
Maximum of 6 timeframes can be analyzed due to TradingView's security call limits
ORB calculations may not work correctly on instruments with gaps or irregular sessions
The indicator is most effective during regular market hours when volume and volatility are adequate
Lower timeframes (1m, 5m) may produce more false signals in choppy conditions
License
Mozilla Public License 2.0 (MPL-2.0)
This indicator is licensed under the Mozilla Public License 2.0. You are free to use, modify, and distribute this code under the terms of the MPL-2.0. The full license text is available at mozilla.org
Key license provisions:
You may use this code commercially
You may modify and distribute modified versions
Modified versions must be released under the same license
You must include the original license notice in any distributions
No trademark rights are granted
Disclaimer
This indicator is provided for educational and informational purposes only. It is not financial advice, and past performance does not guarantee future results. Trading involves substantial risk of loss. Always:
Practice proper risk management
Test thoroughly on paper/demo accounts before live trading
Use appropriate position sizing
Never risk more than you can afford to lose
Consult with a financial advisor for personalized advice
The creator assumes no liability for trading losses incurred using this indicator.
Version: 2.0
Pine Script Version: v6
Author: © EliasVictor
Day Open ± Ø DailyRangeScript Function Description
This indicator draws two horizontal dashed lines during the Regular Trading Hours (RTH) session.
The upper line is calculated as the RTH Open price plus the average daily range (based on the last 10 days).
The lower line is calculated as the RTH Open price minus the average daily range.
🔍 How it works
Average Daily Range (ADR): The script requests daily candles and computes the 10‑day simple moving average of the daily range (High–Low). This value remains constant throughout the trading day.
RTH Detection: The script identifies the first bar of the RTH session (e.g., 09:00 local exchange time). The open price of this bar is stored as the RTH Open.
Line Creation: At the first RTH bar, two dashed lines are drawn:
Green line above the RTH Open (Open + ADR).
Red line below the RTH Open (Open – ADR).
Dynamic Extension: As new bars appear, the lines are automatically extended to the current bar, keeping their Y‑values constant. This ensures the levels remain visible throughout the session.
✅ What Users See
A green dashed line above the RTH Open, marking the typical upside boundary.
A red dashed line below the RTH Open, marking the typical downside boundary.
Both lines start at the first RTH bar and extend to the latest bar of the session.
This helps traders quickly assess whether price action is staying within or breaking beyond the typical daily range relative to the RTH Open.
Ross Cameron 5 Pillars FilterFirst, I am not Ross Cameron. This indicator is based on his five pillars of stock selection.
ROSS CAMERON 5 PILLARS MOMENTUM FILTER
🎯 OVERVIEW
This indicator automatically checks if the current symbol meets Ross Cameron's famous "5 Pillars" stock selection criteria from Warrior Trading - a proven methodology for identifying high-probability momentum day trading setups.
📊 ROSS CAMERON'S 5 PILLARS
1️⃣ RELATIVE VOLUME ≥5x (Automated ✅)
• Compares current volume to 30-day average
• Minimum 5x confirms institutional/retail interest
• High RVol = high liquidity and momentum potential
2️⃣ DAILY % CHANGE ≥10% (Automated ✅)
• Stock must already be showing momentum
• Default threshold: 10% up from previous close
• Confirms demand is already present
3️⃣ NEWS CATALYST (Manual Check ⚠️)
• Breaking news justifies the price movement
• Look for: earnings, FDA approvals, partnerships, contracts
• 🔥 icon flags stocks with ≥15% momentum (likely news-driven)
4️⃣ PRICE RANGE $1-$20 (Automated ✅)
• Sweet spot for retail trader momentum
• Highly volatile small-cap stocks
• Accessible price range for position building
5️⃣ FLOAT <10 MILLION SHARES (Automated ✅)
• Low float creates supply/demand imbalances
• Enables explosive 50-100%+ intraday moves
• Automatically checked when data available
• Shows actual float with ✅/❌ indicator
🚀 KEY FEATURES
✅ GREEN BACKGROUND HIGHLIGHT
• Visual alert when ALL automated criteria are met
• Instantly identify potential setups while scanning watchlist
📋 DETAILED BREAKDOWN TABLE
• Shows pass/fail status for each pillar
• Displays actual values (RVol, %, Float, etc.)
• Color-coded for quick interpretation
🔥 STRONG MOMENTUM INDICATOR
• Highlights stocks ≥15% (likely have news catalyst)
• Helps prioritize which stocks to research first
🔔 BUILT-IN ALERTS
• "Ross Cameron Criteria Met" - All automated criteria pass
• "Strong Momentum Alert" - Stock showing explosive movement
⚙️ FULLY CUSTOMIZABLE
• Adjust all thresholds to your trading style
• Configurable table position and display
• Toggle volume spike filter on/off
💡 HOW TO USE
BEST WORKFLOW:
1. Build a watchlist of small-cap stocks using TradingView's Stock Screener
2. Add this indicator to your charts
3. Flip through your watchlist - look for GREEN BACKGROUNDS
4. Check the table for detailed breakdown of each pillar
5. VERIFY NEWS CATALYST (required for Pillar 3)
6. If float shows N/A, verify manually on Finviz
7. Execute your trading plan with proper risk management
OPTIMAL TIMING:
• Pre-Market (8:00-9:30 AM ET) - Identify gap-up candidates
• Morning Session (9:30 AM-12:00 PM ET) - Prime momentum window
• Avoid lunch hour (12:00-2:00 PM ET) - Low volume, choppy
ALERT SETUP:
1. Click "Create Alert" on your chart
2. Select "Ross Cameron Criteria Met" condition
3. Get notified when new setups appear real-time
⚙️ CUSTOMIZABLE SETTINGS
PILLAR 1 - RELATIVE VOLUME:
• Min RVol: 5.0x (Ross's minimum, increase for more selective)
• RVol Period: 30 days (industry standard)
PILLAR 2 - MOMENTUM:
• Min Daily %: 10% (increase to 15% for stronger setups)
PILLAR 3 - CATALYST:
• Strong Momentum %: 15% (threshold for 🔥 indicator)
PILLAR 4 - PRICE RANGE:
• Min Price: $1.00 (adjust based on account size)
• Max Price: $20.00 (Ross's sweet spot)
PILLAR 5 - FLOAT:
• Max Float: 10M shares (ultra-aggressive traders use 5M)
ADDITIONAL FILTERS:
• Volume Spike: 2x (Warrior Trading standard)
• Confirms intraday momentum continuation
📈 INTERPRETATION GUIDE
✅ GREEN BACKGROUND = GO!
• All automated criteria are met
• Check news catalyst before trading
• Verify setup on chart (not overextended)
• Follow your risk management plan
❌ NO GREEN BACKGROUND = WAIT
• At least one criterion failed
• Check table to see which pillar(s) failed
• May become valid later if momentum increases
🔥 FLAME ICON = HIGH PRIORITY
• Stock showing very strong momentum (≥15%)
• Likely has significant news catalyst
• Research news IMMEDIATELY
• Often the best setups of the day
⚠️ N/A FOR FLOAT = MANUAL CHECK
• TradingView doesn't have float data for this symbol
• Verify on Finviz.com or similar
• If float >10M, setup is invalid per Ross's criteria
📚 RECOMMENDED STRATEGIES
GAP AND GO:
• Stock gaps up 10%+ on news
• Enters above gap high with volume
• Targets: 20-50% gains
VWAP BOUNCE:
• Pullback to VWAP support
• Enters on bounce with volume confirmation
• Tight stop below VWAP
HIGH OF DAY BREAKOUT:
• New HOD with volume surge
• Momentum continuation play
• Trail stop as it runs
ABCD PATTERN:
• Classic reversal pattern
• Enters on D-point breakout
• Target: A-B distance from C
⚠️ RISK WARNINGS
• DAY TRADING IS HIGHLY RISKY - Most day traders lose money
• This indicator finds setups - YOUR EXECUTION determines success
• Always use proper risk management (1-2% risk per trade)
• Never trade without stop losses
• Paper trade extensively before using real money
• Past performance does not guarantee future results
🔧 TECHNICAL DETAILS
• Pine Script v6
• Works on any timeframe (calculates daily metrics automatically)
• Compatible with TradingView Free, Pro, Premium
• No repainting - all calculations based on confirmed data
• Efficient code - minimal lag
📊 DATA SOURCES
• Relative Volume: Calculated from 30-day volume average
• Daily %: Previous day's close vs current price
• Float: TradingView's shares_outstanding_float data
• Volume Spike: 20-period volume moving average
🎯 WHO THIS IS FOR
IDEAL FOR:
✅ Day traders focused on momentum strategies
✅ Traders who follow Ross Cameron/Warrior Trading methodology
✅ Small-cap stock traders ($1-$20 range)
✅ Scalpers and swing traders seeking high-volatility setups
NOT IDEAL FOR:
❌ Long-term investors
❌ Large-cap stock traders
❌ Options-only traders
❌ Traders who don't monitor news catalysts
💬 USAGE TIPS
1. COMBINE WITH OTHER TOOLS
• Use alongside your charting/technical analysis
• Verify pattern setups (bull flags, ABCD, etc.)
• Check Level 2 / Time & Sales for confirmation
2. MAINTAIN A WATCHLIST
• Update daily with fresh small-cap movers
• Use Finviz Gap Scanner as starting point
• Focus on sectors with momentum
3. RISK MANAGEMENT IS KEY
• Never risk more than 1-2% per trade
• Use 2:1 minimum profit/loss ratio
• Cut losses quickly, let winners run
• Position size based on volatility (ATR)
4. TRACK YOUR RESULTS
• Keep a trading journal
• Note which setups work best for you
• Refine criteria based on your data
• Continuous improvement mindset
📝 DISCLAIMER
This indicator is for EDUCATIONAL PURPOSES ONLY. It is not investment advice, a recommendation to buy/sell securities, or a guarantee of profits. Trading involves substantial risk of loss. Always:
• Conduct your own research and due diligence
• Consult with a licensed financial advisor
• Never risk money you cannot afford to lose
• Understand that most day traders lose money
• Practice in a simulator before trading real money
The creator of this indicator is not affiliated with Ross Cameron or Warrior Trading. This is an independent implementation of publicly available trading methodology.
📈 SUPPORT & FEEDBACK
If you find this indicator helpful, please:
• Give it a thumbs up 👍
• Leave a comment with your experience
• Share with other momentum traders
• Follow for updates and new indicators
For questions or suggestions, leave a comment below!
---
🏆 HAPPY TRADING! Remember: The indicator finds opportunities, but YOUR discipline, risk management, and execution determine your success.
#DayTrading #Momentum #RossCameron #WarriorTrading #SmallCaps #GapAndGo #Scalping #StockScreener
macd sma20
### MACD_sma20 – Multi-Timeframe MACD Pullback & SMA20 Dashboard
This script is a complete trading toolkit built around a **MACD pullback strategy** combined with **multi-timeframe SMA20 filters**, volume analysis, and a compact information panel.
It is designed for traders who like to:
* Trade **MACD pullbacks above the moving average**
* Track **key SMA20 levels across multiple timeframes** (Daily, 3-Day, Weekly, Monthly)
* Quickly see whether **current price is above or below those reference levels**
* Use **clean visual signals** for entries and exits, instead of staring at raw indicator values
---
### Core Features
#### 1. MACD Pullback Long Signal (Green Triangle Up)
The script detects a **bullish MACD pullback** pattern:
* MACD line is still **above** the signal line
* Both MACD line and histogram **pull back** for several bars
* Then MACD turns back up again, with price trading **above the local SMA20**
When this “pullback and re-acceleration” is confirmed, a **green triangle below the bar** is plotted as a **long entry signal**.
There is also an optional filter:
* **Weekly SMA20 filter**:
If enabled, long signals are only triggered when **current price is above the Weekly SMA20**, helping you stay on the right side of the higher-timeframe trend.
---
#### 2. Bearish Pullback Confirmation Signal (Red Triangle Down)
On the short side, the script detects a **bearish pullback confirmation** based on:
* A recent **high-volume bearish candle** (large down bar with volume above a multiple of the 20-period volume average)
* At least a minimum number of **negative MACD histogram bars**
* MACD line moving closer to the signal line (loss of momentum)
* Price recovering back up near the **top of that high-volume bearish candle**, then starting to fall again while MACD stays positive
When all conditions align, the script prints a **red triangle above the bar**, indicating a **bearish pullback confirmation** – often a good area to take profits on longs or consider short/hedge setups.
---
#### 3. Signal History Tracking
For both long and short signals, the script internally tracks the **most recent three signals**:
* Timestamp of the signal
* Price at the signal
* Short-term percentage change into the signal
This is mainly for internal use and future expansion, but already gives you a structured signal history if you want to extend or connect the logic later.
---
### Multi-Timeframe SMA20 Dashboard (Bottom-Right Panel)
One of the most useful parts of this script is the **compact dashboard table** in the **bottom-right corner** of the chart. It updates in real time and shows:
1. **Current Price**
2. **Daily SMA20** – value + whether price is above/below
3. **3-Day SMA20** – value + whether price is above/below
4. **Weekly SMA20** – value + whether price is above/below
5. **Monthly SMA20** – value + whether price is above/below
6. **RSI** (current timeframe)
For each timeframe’s SMA20:
* If **price ≥ SMA20**, the status cell is **green** with a ✓
* If **price < SMA20**, the status cell is **red** with a ✗
This gives you, at a glance:
* Is the market in a **short-term uptrend or downtrend** (Daily SMA20)?
* Is the **swing / position trend** healthy (3D & Weekly SMA20)?
* Is the broader **macro structure** supportive (Monthly SMA20)?
You don’t need to manually switch timeframes or add multiple moving averages – the script does all of that for you automatically using `request.security`.
---
### Alerts
The script comes with two built-in alert conditions:
* **MACD回踩转多信号 (MACD pullback bullish signal)**
* **空头回抽确认信号 (Bearish pullback confirmation signal)**
You can attach TradingView alerts to these conditions to get notified whenever a new long or bearish-confirmation setup appears, even when you’re not watching the chart.
---
### How to Use It in Your Trading
1. **Choose your main trading timeframe**
* For intraday swing: 15m / 1h / 4h
* For swing / position: 4h / Daily
2. **Watch the bottom-right SMA20 panel**
* If most higher-timeframe SMA20 rows are **green**, you are trading **with the larger trend**.
* If they are **mixed or mostly red**, you’re either counter-trend or in a choppy transition zone.
3. **Use the green MACD pullback signals**
* Prefer long setups when:
* The **Weekly and Monthly SMA20 rows are green**, and
* The signal appears **above the Daily SMA20**
* This stacks multiple edges: trend + pullback + momentum re-acceleration.
4. **Use the red bearish confirmation signals for risk management**
* Take partial profits on longs when a red signal appears near resistance.
* Consider hedge/short opportunities if higher-timeframe SMA20 rows are already red or turning red.
5. **Use RSI as a context indicator**
* Combine with overbought/oversold zones or your own RSI thresholds for additional confirmation.
---
### Why This Script Is Useful
* **Trend awareness across timeframes**:
You always know where current price sits relative to the Daily / 3-Day / Weekly / Monthly SMA20 – without switching charts.
* **Clear, rule-based signals**:
The MACD logic is explicit and systematic, focused on **pullbacks within trends** rather than random crossovers.
* **Volume-aware bearish logic**:
High-volume bearish candles often mark important supply zones. The script builds this idea directly into the short-side confirmation logic.
* **Visual and intuitive**:
Green/Red triangles + Green/Red table cells make it easy to interpret even if you are not a heavy indicator user.
* **Flexible**:
All key parameters (MACD lengths, SMA length, volume threshold, lookback period, RSI length, weekly filter) are customizable, so you can adapt it to different markets (crypto, stocks, FX) and timeframes.
---
In short, this script is a **multi-timeframe MACD pullback system with an integrated SMA20 dashboard**, suitable for swing traders and position traders who want a structured, visually clean way to align entries with trend and momentum while keeping an eye on higher-timeframe levels.
Top-line % MovesOverview
A clean, text-only overlay that shows price momentum at a glance. It prints one line at the top-center of your chart:
Movement | Day % | 3-Day % | Wk %
What it shows
Day - Percent change from today’s regular-session open to the latest price
3-Day - Percent change from the daily open 3 trading days ago
Wk - Percent change from the daily open 5 trading days ago
How it works
Pulls daily opens via request.security so it stays consistent across intraday and daily timeframes
Calculates percent moves versus those opens and renders a single centered text line
Transparent background, bright white text, no bars or lines, minimal chart footprint
Notes
“Wk” uses 5 trading days. If you prefer 7 calendar days, change the lookback to your preference
Daily opens follow the symbol’s TradingView session settings. Extended or 24h markets may differ from your broker’s definition of “open”
Best for
Quick momentum read without clutter
Screeners, streaming layouts, and compact dashboards
Inputs
None
Tags
percent change, overlay, momentum, daily open, intraday, text display, minimal, Pine v6
TraderDemircan Auto Fibonacci RetracementDescription:
What This Indicator Does:This indicator automatically identifies significant swing high and swing low points within a customizable lookback period and draws comprehensive Fibonacci retracement and extension levels between them. Unlike the manual Fibonacci tool that requires you to constantly redraw levels as price action evolves, this automated version continuously updates the Fibonacci grid based on the most recent major swing points, ensuring you always have current and relevant support/resistance zones displayed on your chart.Key Features:
Automatic Swing Detection: Continuously scans the specified lookback period to find the most significant high and low points, eliminating manual drawing errors
Comprehensive Level Coverage: Plots 16 Fibonacci levels including 7 retracement levels (0.0 to 1.0) and 9 extension levels (1.115 to 3.618)
Top-Down Methodology: Draws from swing high to swing low (right-to-left), following the traditional Fibonacci retracement convention where 100% is at the top
Dual Labeling System: Shows both exact price values and Fibonacci percentages for easy reference
Complete Customization: Individual toggle controls and color selection for each of the 16 levels
Flexible Display Options: Adjust line thickness (1-5), style (solid/dashed/dotted), and extension direction (left/right/both)
Visual Swing Markers: Red diamond at the swing high (starting point) and green diamond at the swing low (ending point)
Optional Trend Line: Connects the two swing points to visualize the overall price movement direction
How It Works:The indicator employs a sophisticated swing point detection algorithm that operates in two stages:Stage 1 - Find the Swing Low (Support Base):
Scans the entire lookback period to identify the lowest low, which becomes the anchor point (0.0 level in traditional retracement terms, though displayed at the bottom of the grid).Stage 2 - Find the Swing High (Resistance Peak):
After identifying the swing low, searches for the highest high that occurred after that low point, establishing the swing range. This creates a valid price movement range for Fibonacci analysis.Fibonacci Calculation Method:
The indicator uses the top-down approach where:
1.0 Level = Swing High (100% retracement, the top)
0.0 Level = Swing Low (0% retracement, the bottom)
Retracement Levels (0.236 to 0.786) = Potential support zones during pullbacks from the high
Extension Levels (1.115 to 3.618) = Potential target zones below the swing low
Formula: Price = SwingHigh - (SwingHigh - SwingLow) × FibonacciLevelThis ensures that 0.0 is at the bottom and extensions (>1.0) plot below the swing low, following standard Fibonacci retracement convention.Fibonacci Levels Explained:Retracement Levels (0.0 - 1.0):
0.0 (Gray): Swing low - the base support level
0.236 (Red): Shallow retracement, first minor support
0.382 (Orange): Moderate retracement, commonly watched support
0.5 (Purple): Psychological midpoint, significant support/resistance
0.618 (Blue - Golden Ratio): The most important retracement level, high-probability reversal zone
0.786 (Cyan): Deep retracement, last defense before full reversal
1.0 (Gray): Swing high - the initial resistance level
Extension Levels (1.115 - 3.618):
1.115 (Green): First extension, minimal downside target
1.272 (Light Green): Minor extension, common profit target
1.414 (Yellow-Green): Square root of 2, mathematical significance
1.618 (Gold - Golden Extension): Primary downside target, most watched extension level
2.0 (Orange-Red): 200% extension, psychological round number
2.382 (Pink): Secondary extension target
2.618 (Purple): Deep extension, major target zone
3.272 (Deep Purple): Extreme extension level
3.618 (Blue): Maximum extension, rare but powerful target
How to Use:For Retracement Trading (Buying Pullbacks in Uptrends):
Wait for price to make a significant move up from swing low to swing high
When price starts pulling back, watch for reactions at key Fibonacci levels
Most common entry zones: 0.382, 0.5, and especially 0.618 (golden ratio)
Enter long positions when price shows reversal signals (candlestick patterns, volume increase) at these levels
Place stop loss below the next Fibonacci level
Target: Return to swing high or higher extension levels
For Extension Trading (Profit Targets):
After price breaks below the swing low (0.0 level), use extensions as profit targets
First target: 1.272 (conservative)
Primary target: 1.618 (golden extension - most commonly reached)
Extended target: 2.618 (for strong trends)
Extreme target: 3.618 (only in powerful trending moves)
For Counter-Trend Trading (Fading Extremes):
When price reaches deep retracements (0.786 or below), look for exhaustion signals
Watch for divergences between price and momentum indicators at these levels
Enter reversal trades with tight stops below the swing low
Target: 0.5 or 0.382 levels on the bounce
For Trend Continuation:
In strong uptrends, shallow retracements (0.236 to 0.382) often hold
Use these as low-risk entry points to join the existing trend
Failure to hold 0.5 suggests weakening momentum
Breaking below 0.618 often indicates trend reversal, not just retracement
Multi-Timeframe Strategy:
Use daily timeframe Fibonacci for major support/resistance zones
Use 4H or 1H Fibonacci for precise entry timing within those zones
Confluence between multiple timeframe Fibonacci levels creates high-probability zones
Example: Daily 0.618 level aligning with 4H 0.5 level = strong support
Settings Guide:Lookback Period (10-500):
Short (20-50): Captures recent swings, more frequent updates, suited for day trading
Medium (50-150): Balanced approach, good for swing trading (default: 100)
Long (150-500): Identifies major market structure, suited for position trading
Higher values = more stable levels but slower to adapt to new trends
Pivot Sensitivity (1-20):
Controls how many candles are required to confirm a swing point
Low (1-5): More sensitive, identifies minor swings (default: 5)
High (10-20): Less sensitive, only major swings qualify
Use higher sensitivity on lower timeframes to filter noise
Individual Level Toggles:
Enable only the levels you actively trade to reduce chart clutter
Common minimalist setup: Show only 0.382, 0.5, 0.618, 1.0, 1.618, 2.618
Comprehensive setup: Enable all levels for maximum information
Visual Customization:
Line Thickness: Thicker lines (3-5) for presentation, thinner (1-2) for trading
Line Style: Solid for primary levels (0.5, 0.618, 1.618), dashed/dotted for secondary
Price Labels: Essential for knowing exact entry/exit prices
Percent Labels: Helpful for quickly identifying which Fibonacci level you're looking at
Extension Direction: Extend right for forward-looking analysis, left for historical context
What Makes This Original:While Fibonacci indicators are common on TradingView, this script's originality comes from:
Intelligent Two-Stage Detection: Unlike simple high/low finders, this uses a sequential approach (find low first, then find the high that occurred after it), ensuring logical price flow representation
Comprehensive Level Set: Includes 16 levels spanning from retracement to extreme extensions, more than most Fibonacci tools
Top-Down Methodology: Properly implements the traditional Fibonacci retracement convention (high to low) rather than the reverse
Automatic Range Validation: Only draws Fibonacci when both swing points are valid and in the correct temporal order
Dual Extension Options: Separate controls for extending lines left (historical context) and right (forward projection)
Smart Label Positioning: Places percentage labels on the left and price labels on the right for clarity
Visual Swing Confirmation: Diamond markers at swing points help users understand why levels are positioned where they are
Important Considerations:
Historical Nature: Fibonacci retracements are based on past price swings; they don't predict future moves, only suggest potential support/resistance
Self-Fulfilling Prophecy: Fibonacci levels work partly because many traders watch them, creating actual support/resistance at those levels
Not All Levels Hold: In strong trends, price may slice through multiple Fibonacci levels without pausing
Context Matters: Fibonacci works best when aligned with other support/resistance (previous highs/lows, moving averages, trendlines)
Volume Confirmation: The most reliable Fibonacci reversals occur with volume spikes at key levels
Dynamic Updates: The levels will redraw as new swing highs/lows form, so don't rely solely on static screenshots
Best Practices:
Don't Trade Blindly: Fibonacci levels are zones, not exact prices. Look for confirmation (candlestick patterns, indicators, volume)
Combine with Price Action: Watch for pin bars, engulfing candles, or doji at key Fibonacci levels
Use Stop Losses: Place stops beyond the next Fibonacci level to give trades room but limit risk
Scale In/Out: Consider entering partial positions at 0.5 and adding more at 0.618 rather than all-in at one level
Check Multiple Timeframes: Daily Fibonacci + 4H Fibonacci convergence = high-probability zone
Respect the 0.618: This golden ratio level is historically the most reliable for reversals
Extensions Need Strong Trends: Don't expect extensions to be hit unless there's clear momentum beyond the swing low
Optimal Timeframes:
Scalping (1-5 minutes): Lookback 20-30, watch 0.382, 0.5, 0.618 only
Day Trading (15m-1H): Lookback 50-100, all retracement levels important
Swing Trading (4H-Daily): Lookback 100-200, focus on 0.5, 0.618, 0.786, and extensions
Position Trading (Daily-Weekly): Lookback 200-500, all levels relevant for long-term planning
Common Fibonacci Trading Mistakes to Avoid:
Wrong Swing Selection: Choosing insignificant swings produces meaningless levels
Premature Entry: Entering as soon as price touches a Fibonacci level without confirmation
Ignoring Trend: Fighting the main trend by buying deep retracements in downtrends
Over-Reliance: Using Fibonacci in isolation without confirming with other technical factors
Static Analysis: Not updating your Fibonacci as market structure evolves
Arbitrary Lookback: Using the same lookback period for all assets and timeframes
Integration with Other Tools:Fibonacci + Moving Averages:
When 0.618 level aligns with 50 or 200 EMA, confluence creates stronger support
Price bouncing from both Fibonacci and MA simultaneously = high-probability trade
Fibonacci + RSI/Stochastic:
Oversold indicators at 0.618 or deeper retracements = strong buy signal
Overbought indicators at swing high (1.0) = potential reversal warning
Fibonacci + Volume Profile:
High-volume nodes aligning with Fibonacci levels create robust support/resistance
Low-volume areas near Fibonacci levels may see rapid price movement through them
Fibonacci + Trendlines:
Fibonacci retracement level + ascending trendline = double support
Breaking both simultaneously confirms trend change
Technical Notes:
Uses ta.lowest() and ta.highest() for efficient swing detection across the lookback period
Implements dynamic line and label arrays for clean redraws without memory leaks
All calculations update in real-time as new bars form
Extension options allow customization without modifying core code
Format.mintick ensures price labels match the symbol's minimum price increment
Tooltip on swing markers shows exact price values for precision
Volatility-Targeted Momentum Portfolio [BackQuant]Volatility-Targeted Momentum Portfolio
A complete momentum portfolio engine that ranks assets, targets a user-defined volatility, builds long, short, or delta-neutral books, and reports performance with metrics, attribution, Monte Carlo scenarios, allocation pie, and efficiency scatter plots. This description explains the theory and the mechanics so you can configure, validate, and deploy it with intent.
Table of contents
What the script does at a glance
Momentum, what it is, how to know if it is present
Volatility targeting, why and how it is done here
Portfolio construction modes: Long Only, Short Only, Delta Neutral
Regime filter and when the strategy goes to cash
Transaction cost modelling in this script
Backtest metrics and definitions
Performance attribution chart
Monte Carlo simulation
Scatter plot analysis modes
Asset allocation pie chart
Inputs, presets, and deployment checklist
Suggested workflow
1) What the script does at a glance
Pulls a list of up to 15 tickers, computes a simple momentum score on each over a configurable lookback, then volatility-scales their bar-to-bar return stream to a target annualized volatility.
Ranks assets by raw momentum, selects the top 3 and bottom 3, builds positions according to the chosen mode, and gates exposure with a fast regime filter.
Accumulates a portfolio equity curve with risk and performance metrics, optional benchmark buy-and-hold for comparison, and a full alert suite.
Adds visual diagnostics: performance attribution bars, Monte Carlo forward paths, an allocation pie, and scatter plots for risk-return and factor views.
2) Momentum: definition, detection, and validation
Momentum is the tendency of assets that have performed well to continue to perform well, and of underperformers to continue underperforming, over a specific horizon. You operationalize it by selecting a horizon, defining a signal, ranking assets, and trading the leaders versus laggards subject to risk constraints.
Signal choices . Common signals include cumulative return over a lookback window, regression slope on log-price, or normalized rate-of-change. This script uses cumulative return over lookback bars for ranking (variable cr = price/price - 1). It keeps the ranking simple and lets volatility targeting handle risk normalization.
How to know momentum is present .
Leaders and laggards persist across adjacent windows rather than flipping every bar.
Spread between average momentum of leaders and laggards is materially positive in sample.
Cross-sectional dispersion is non-trivial. If everything is flat or highly correlated with no separation, momentum selection will be weak.
Your validation should include a diagnostic that measures whether returns are explained by a momentum regression on the timeseries.
Recommended diagnostic tool . Before running any momentum portfolio, verify that a timeseries exhibits stable directional drift. Use this indicator as a pre-check: It fits a regression to price, exposes slope and goodness-of-fit style context, and helps confirm if there is usable momentum before you force a ranking into a flat regime.
3) Volatility targeting: purpose and implementation here
Purpose . Volatility targeting seeks a more stable risk footprint. High-vol assets get sized down, low-vol assets get sized up, so each contributes more evenly to total risk.
Computation in this script (per asset, rolling):
Return series ret = log(price/price ).
Annualized volatility estimate vol = stdev(ret, lookback) * sqrt(tradingdays).
Leverage multiplier volMult = clamp(targetVol / vol, 0.1, 5.0).
This caps sizing so extremely low-vol assets don’t explode weight and extremely high-vol assets don’t go to zero.
Scaled return stream sr = ret * volMult. This is the per-bar, risk-adjusted building block used in the portfolio combinations.
Interpretation . You are not levering your account on the exchange, you are rescaling the contribution each asset’s daily move has on the modeled equity. In live trading you would reflect this with position sizing or notional exposure.
4) Portfolio construction modes
Cross-sectional ranking . Assets are sorted by cr over the chosen lookback. Top and bottom indices are extracted without ties.
Long Only . Averages the volatility-scaled returns of the top 3 assets: avgRet = mean(sr_top1, sr_top2, sr_top3). Position table shows per-asset leverages and weights proportional to their current volMult.
Short Only . Averages the negative of the volatility-scaled returns of the bottom 3: avgRet = mean(-sr_bot1, -sr_bot2, -sr_bot3). Position table shows short legs.
Delta Neutral . Long the top 3 and short the bottom 3 in equal book sizes. Each side is sized to 50 percent notional internally, with weights within each side proportional to volMult. The return stream mixes the two sides: avgRet = mean(sr_top1,sr_top2,sr_top3, -sr_bot1,-sr_bot2,-sr_bot3).
Notes .
The selection metric is raw momentum, the execution stream is volatility-scaled returns. This separation is deliberate. It avoids letting volatility dominate ranking while still enforcing risk parity at the return contribution stage.
If everything rallies together and dispersion collapses, Long Only may behave like a single beta. Delta Neutral is designed to extract cross-sectional momentum with low net beta.
5) Regime filter
A fast EMA(12) vs EMA(21) filter gates exposure.
Long Only active when EMA12 > EMA21. Otherwise the book is set to cash.
Short Only active when EMA12 < EMA21. Otherwise cash.
Delta Neutral is always active.
This prevents taking long momentum entries during obvious local downtrends and vice versa for shorts. When the filter is false, equity is held flat for that bar.
6) Transaction cost modelling
There are two cost touchpoints in the script.
Per-bar drag . When the regime filter is active, the per-bar return is reduced by fee_rate * avgRet inside netRet = avgRet - (fee_rate * avgRet). This models proportional friction relative to traded impact on that bar.
Turnover-linked fee . The script tracks changes in membership of the top and bottom baskets (top1..top3, bot1..bot3). The intent is to charge fees when composition changes. The template counts changes and scales a fee by change count divided by 6 for the six slots.
Use case: increase fee_rate to reflect taker fees and slippage if you rebalance every bar or trade illiquid assets. Reduce it if you rebalance less often or use maker orders.
Practical advice .
If you rebalance daily, start with 5–20 bps round-trip per switch on liquid futures and adjust per venue.
For crypto perp microcaps, stress higher cost assumptions and add slippage buffers.
If you only rotate on lookback boundaries or at signals, use alert-driven rebalances and lower per-bar drag.
7) Backtest metrics and definitions
The script computes a standard set of portfolio statistics once the start date is reached.
Net Profit percent over the full test.
Max Drawdown percent, tracked from running peaks.
Annualized Mean and Stdev using the chosen trading day count.
Variance is the square of annualized stdev.
Sharpe uses daily mean adjusted by risk-free rate and annualized.
Sortino uses downside stdev only.
Omega ratio of sum of gains to sum of losses.
Gain-to-Pain total gains divided by total losses absolute.
CAGR compounded annual growth from start date to now.
Alpha, Beta versus a user-selected benchmark. Beta from covariance of daily returns, Alpha from CAPM.
Skewness of daily returns.
VaR 95 linear-interpolated 5th percentile of daily returns.
CVaR average of the worst 5 percent of daily returns.
Benchmark Buy-and-Hold equity path for comparison.
8) Performance attribution
Cumulative contribution per asset, adjusted for whether it was held long or short and for its volatility multiplier, aggregated across the backtest. You can filter to winners only or show both sides. The panel is sorted by contribution and includes percent labels.
9) Monte Carlo simulation
The panel draws forward equity paths from either a Normal model parameterized by recent mean and stdev, or non-parametric bootstrap of recent daily returns. You control the sample length, number of simulations, forecast horizon, visibility of individual paths, confidence bands, and a reproducible seed.
Normal uses Box-Muller with your seed. Good for quick, smooth envelopes.
Bootstrap resamples realized returns, preserving fat tails and volatility clustering better than a Gaussian assumption.
Bands show 10th, 25th, 75th, 90th percentiles and the path mean.
10) Scatter plot analysis
Four point-cloud modes, each plotting all assets and a star for the current portfolio position, with quadrant guides and labels.
Risk-Return Efficiency . X is risk proxy from leverage, Y is expected return from annualized momentum. The star shows the current book’s composite.
Momentum vs Volatility . Visualizes whether leaders are also high vol, a cue for turnover and cost expectations.
Beta vs Alpha . X is a beta proxy, Y is risk-adjusted excess return proxy. Useful to see if leaders are just beta.
Leverage vs Momentum . X is volMult, Y is momentum. Shows how volatility targeting is redistributing risk.
11) Asset allocation pie chart
Builds a wheel of current allocations.
Long Only, weights are proportional to each long asset’s current volMult and sum to 100 percent.
Short Only, weights show the short book as positive slices that sum to 100 percent.
Delta Neutral, 50 percent long and 50 percent short books, each side leverage-proportional.
Labels can show asset, percent, and current leverage.
12) Inputs and quick presets
Core
Portfolio Strategy . Long Only, Short Only, Delta Neutral.
Initial Capital . For equity scaling in the panel.
Trading Days/Year . 252 for stocks, 365 for crypto.
Target Volatility . Annualized, drives volMult.
Transaction Fees . Per-bar drag and composition change penalty, see the modelling notes above.
Momentum Lookback . Ranking horizon. Shorter is more reactive, longer is steadier.
Start Date . Ensure every symbol has data back to this date to avoid bias.
Benchmark . Used for alpha, beta, and B&H line.
Diagnostics
Metrics, Equity, B&H, Curve labels, Daily return line, Rolling drawdown fill.
Attribution panel. Toggle winners only to focus on what matters.
Monte Carlo mode with Normal or Bootstrap and confidence bands.
Scatter plot type and styling, labels, and portfolio star.
Pie chart and labels for current allocation.
Presets
Crypto Daily, Long Only . Lookback 25, Target Vol 50 percent, Fees 10 bps, Regime filter on, Metrics and Drawdown on. Monte Carlo Bootstrap with Recent 200 bars for bands.
Crypto Daily, Delta Neutral . Lookback 25, Target Vol 50 percent, Fees 15–25 bps, Regime filter always active for this mode. Use Scatter Risk-Return to monitor efficiency and keep the star near upper left quadrants without drifting rightward.
Equities Daily, Long Only . Lookback 60–120, Target Vol 15–20 percent, Fees 5–10 bps, Regime filter on. Use Benchmark SPX and watch Alpha and Beta to keep the book from becoming index beta.
13) Suggested workflow
Universe sanity check . Pick liquid tickers with stable data. Thin assets distort vol estimates and fees.
Check momentum existence . Run on your timeframe. If slope and fit are weak, widen lookback or avoid that asset or timeframe.
Set risk budget . Choose a target volatility that matches your drawdown tolerance. Higher target increases turnover and cost sensitivity.
Pick mode . Long Only for bull regimes, Short Only for sustained downtrends, Delta Neutral for cross-sectional harvesting when index direction is unclear.
Tune lookback . If leaders rotate too often, lengthen it. If entries lag, shorten it.
Validate cost assumptions . Increase fee_rate and stress Monte Carlo. If the edge vanishes with modest friction, refine selection or lengthen rebalance cadence.
Run attribution . Confirm the strategy’s winners align with intuition and not one unstable outlier.
Use alerts . Enable position change, drawdown, volatility breach, regime, momentum shift, and crash alerts to supervise live runs.
Important implementation details mapped to code
Momentum measure . cr = price / price - 1 per symbol for ranking. Simplicity helps avoid overfitting.
Volatility targeting . vol = stdev(log returns, lookback) * sqrt(tradingdays), volMult = clamp(targetVol / vol, 0.1, 5), sr = ret * volMult.
Selection . Extract indices for top1..top3 and bot1..bot3. The arrays rets, scRets, lev_vals, and ticks_arr track momentum, scaled returns, leverage multipliers, and display tickers respectively.
Regime filter . EMA12 vs EMA21 switch determines if the strategy takes risk for Long or Short modes. Delta Neutral ignores the gate.
Equity update . Equity multiplies by 1 + netRet only when the regime was active in the prior bar. Buy-and-hold benchmark is computed separately for comparison.
Tables . Position tables show current top or bottom assets with leverage and weights. Metric table prints all risk and performance figures.
Visualization panels . Attribution, Monte Carlo, scatter, and pie use the last bars to draw overlays that update as the backtest proceeds.
Final notes
Momentum is a portfolio effect. The edge comes from cross-sectional dispersion, adequate risk normalization, and disciplined turnover control, not from a single best asset call.
Volatility targeting stabilizes path but does not fix selection. Use the momentum regression link above to confirm structure exists before you size into it.
Always test higher lag costs and slippage, then recheck metrics, attribution, and Monte Carlo envelopes. If the edge persists under stress, you have something robust.
VWAP Trend
**Overview**
The VWAP Trend indicator is a volume-weighted price analysis tool that visualizes the relationship between price and the anchored Volume Weighted Average Price (VWAP) over different timeframes. This script is designed to reveal when the market is trending above or below its volume-weighted equilibrium point, providing a clear framework for identifying directional bias, trend strength, and potential reversals.
By combining an anchored VWAP with exponential smoothing and a secondary trend EMA, the indicator helps traders distinguish between short-term price fluctuations and genuine volume-supported directional moves.
**Core Concept**
VWAP (Volume Weighted Average Price) represents the average price of an asset weighted by traded volume. It reflects where the majority of trading activity has taken place within a chosen period, serving as a critical reference level for institutions and professional traders.
This indicator extends the traditional VWAP concept by:
1. Allowing users to **anchor VWAP to different timeframes** (Daily, Weekly, or Monthly).
2. Applying **smoothing** to create a stable reference curve less prone to noise.
3. Overlaying a **trend EMA** to identify whether current price momentum aligns with or diverges from VWAP equilibrium.
The combination of these elements produces a visual representation of price’s relationship to its fair value across time, helping to identify accumulation and distribution phases.
**Calculation Methodology**
1. **Anchored VWAP Calculation:**
The script resets cumulative volume and cumulative volume–price data at the start of each new VWAP session (based on the selected anchor timeframe). It continuously accumulates the product of price and volume, dividing this by total volume to compute the current VWAP value.
2. **Smoothing Process:**
The raw VWAP line is smoothed using an Exponential Moving Average (EMA) of user-defined length, producing a cleaner, more stable trend curve that minimizes intraperiod noise.
3. **Trend Determination:**
An additional EMA is calculated on the closing price. By comparing the position of this EMA to the smoothed VWAP, the indicator determines the prevailing market bias:
* When the trend EMA is above the smoothed VWAP, the market is considered to be in an **uptrend**.
* When the trend EMA is below the smoothed VWAP, the market is classified as a **downtrend**.
**Visual Structure**
The indicator uses color dynamics and chart overlays to make interpretation intuitive:
* **Smoothed VWAP Line:** The main trend reference, colored blue during bullish conditions and orange during bearish conditions.
* **Price Fill Region:** The area between the smoothed VWAP and price is filled with a translucent color matching the current trend, visually representing whether price is trading above or below equilibrium.
* **Trend EMA (implicit):** Although not separately plotted, it drives the color state of the VWAP, ensuring seamless visual transitions between bullish and bearish conditions.
**Inputs and Parameters**
* **VWAP Timeframe:** Choose between Daily, Weekly, or Monthly anchoring. This determines the reset frequency for cumulative volume and price data.
* **VWAP Smoothing Length:** Defines how many periods are used to smooth the VWAP line. Shorter values produce a more reactive line; longer values create smoother, steadier signals.
* **Trend EMA Length:** Sets the period for the trend detection EMA applied to price. Adjust this to calibrate how quickly the indicator reacts to directional changes.
**Interpretation and Use Cases**
* **Trend Confirmation:** When price and the trend EMA both remain above the smoothed VWAP, the market is showing strong bullish control. Conversely, consistent price action below the VWAP suggests sustained bearish sentiment.
* **Fair Value Assessment:** VWAP serves as a dynamic equilibrium level. Price repeatedly reverting to this line indicates consolidation or fair value zones, while strong directional moves away from VWAP highlight momentum phases.
* **Institutional Benchmarking:** Because large market participants often benchmark entries and exits relative to VWAP, this indicator helps align retail analysis with institutional logic.
* **Reversal Detection:** Sudden crossovers of the trend EMA relative to the VWAP can signal potential reversals or shifts in momentum strength.
**Trading Applications**
* **Trend Following:** Use VWAP’s direction and color state to determine trade bias. Long entries are favored when the VWAP turns blue, while short entries align with orange phases.
* **Mean Reversion:** In ranging conditions, traders may look for price deviations far above or below VWAP as potential reversion opportunities.
* **Multi-Timeframe Confluence:** Combine the Daily VWAP Trend with higher anchor periods (e.g., Weekly or Monthly) to confirm larger trend structure.
* **Support and Resistance Mapping:** VWAP often acts as a strong intraday or session-level support/resistance zone. The smoothed version refines this behavior into a cleaner, more reliable reference.
**Originality and Innovation**
The VWAP Trend indicator stands apart from conventional VWAP scripts through several original features:
1. **Anchor Flexibility:** Most VWAP indicators fix the anchor to a specific session (like daily). This version allows switching between Daily, Weekly, and Monthly anchors dynamically, adapting to various trading styles and time horizons.
2. **Volume-Weighted Smoothing:** The use of an EMA smoothing layer over the raw VWAP provides enhanced stability without compromising responsiveness, delivering a more analytically consistent signal.
3. **EMA-Based Trend Comparison:** By introducing a second trend EMA, the indicator creates a comparative framework that merges volume-weighted price analysis with classical momentum tracking — a rare and powerful combination.
4. **Adaptive Visual System:** The color-shifting and shaded fill between VWAP and price are integrated into a single, lightweight structure, giving traders immediate insight into market bias without the clutter of multiple overlapping indicators.
**Advantages**
* Adaptable to any market, timeframe, or trading style.
* Provides both equilibrium (VWAP) and momentum (EMA) perspectives.
* Smooths out noise while retaining the integrity of volume-based price dynamics.
* Enhances situational awareness through intuitive color-coded visualization.
* Ideal for professional, swing, and intraday traders seeking context-driven market direction.
**Summary**
The VWAP Trend indicator is a modern enhancement of the classical VWAP methodology. By merging anchored volume-weighted analysis with smoothed trend detection and visual state feedback, it provides a comprehensive perspective on market equilibrium and directional strength. It is built for traders who seek more than static price references — offering an adaptive, volume-aware framework for identifying market trends, reversals, and fair-value zones with precision and clarity.
Precision NasdaqPrecision NASDAQ Levels — Open-Source Support & Resistance Indicator
This open-source Support and Resistance Indicator helps traders plot key price levels where the market may reverse or consolidate. By plotting support and resistance zones based on historical price action, it provides clear visual cues for potential entry and exit points across various timeframes.
Features:
Customizable Settings: Adjust visual styles, label positions, and toggle level labels to suit your trading strategy.
Multi-Timeframe Support: Plot Monthly, Weekly, Daily, and Daily Range levels for broader market context.
Streamlined String Input: Input structure follows this order:
Code
Red, Red, Pink, Pink, Red, Red, Daily Range, Daily Range, Weekly, Weekly, Monthly, Monthly
Semi-Automatic NQ/QQQ Conversion: Manually input daily NQ spread or QQQ calculation to adjust NASDAQ levels. Note: Levels cannot be dragged when NQ/QQQ conversion is active. Uncheck conversion boxes to enable dragging.
How It Works
Apply the indicator to your chart.
Enter values for each support and resistance level.
Drag and adjust levels directly on the chart.
Use plotted zones to identify potential reversals, breakouts, or stop-loss placements.
Combine with other tools (e.g., trendlines or oscillators) for confirmation.
RSI(14) CrossUp >= 60 📈 RSI14 CrossUp ≥ 60 (Daily, Live) + BB Width Screener
Author: Rayan Selim / Torpedo Labs
Version: 1.0
Category: Momentum + Volatility Visualization
🧠 Overview
This indicator combines RSI-based momentum confirmation with Bollinger Band Width (BBW) expansion tracking — designed for traders who want to visually and quantitatively detect daily strength shifts and volatility expansions across multiple symbols.
It highlights candles when the daily RSI(14) crosses above 60, signaling bullish continuation, and displays daily Bollinger Band Width data to assess volatility expansion or contraction.
You can also use the built-in Screener plots as custom columns in TradingView’s Watchlist or Stock Screener for quick scanning of multiple symbols.
⚙️ Core Features
✅ Daily RSI(14) Cross-Up Highlight
Automatically colors candles when RSI crosses above 60 (updates live, no need to wait for daily close).
✅ Bollinger Band Width (BBW) Display
Shows BBW values for the highlighted and previous candles.
✅ Dynamic Label Coloring
Expanding BBW → Green label, Contracting → Red label (toggleable).
✅ Grouped Input Panels
Organized configuration panels for clarity:
Graphic / Highlight
BBW Labels (Global / Green / Red / Fonts)
Screener Outputs
✅ Screener-Compatible Output Plots
Adds hidden plots for Watchlist columns:
RSI Prev (D)
RSI Today (D)
BBW Prev (D)
BBW Today (D)
CrossUp≥60 (0/1)
BBW Expanding (0/1)
✅ Live & Non-Repainting
Uses lookahead_on for live RSI updates while maintaining daily context.
📊 Use Case Examples
Detect momentum confirmation (RSI crossing 60) with simultaneous volatility expansion.
Screen for tickers where daily BBW is widening while RSI shows strength.
Build Watchlist columns to sort stocks by RSI conditions and BBW expansion.
Identify early breakout conditions during accumulation phases.
⚡ Technical Notes
All calculations use daily data, even on lower timeframes.
RSI cross-up events include the current (in-progress) daily candle.
Screener columns are hidden by default but can be toggled visible for debugging.
The indicator is non-repainting, as it reads daily RSI and BBW in real time.
📢 Alerts
Built-in alert for “RSI(14) Crossed Above 60 (Live)” so you never miss a setup.
Bull Bear Indicator# Bull Bear Indicator - TradingView Script Description
## Overview
The Bull Bear Indicator is a powerful visual tool that instantly identifies market sentiment by coloring all candlesticks based on their position relative to a moving average. This indicator helps traders quickly identify bullish and bearish market conditions at a glance.
## Key Features
### 🎨 Visual Bull/Bear Identification
- **Green Candles**: Price is at or above the moving average (Bullish condition)
- **Red Candles**: Price is below the moving average (Bearish condition)
- Complete candle coloring including body, wicks, and borders for maximum clarity
### 📊 Flexible Moving Average Options
- **MA Type**: Choose between Simple Moving Average (MA) or Exponential Moving Average (EMA)
- **Timeframe**: Select Weekly or Daily timeframe for the moving average calculation
- **Customizable Period**: Adjust the MA/EMA period (default: 50)
### 📈 Smooth Moving Average Line
- Displays a smooth blue moving average line on the chart
- Automatically adapts to your selected timeframe and MA type
- Provides clear visual reference for trend identification
## How It Works
The indicator calculates a moving average (MA or EMA) based on your selected timeframe (Weekly or Daily). It then compares the current price to this moving average:
- **Bull Market**: When price ≥ Moving Average → Candles turn **GREEN**
- **Bear Market**: When price < Moving Average → Candles turn **RED**
## Configuration Options
1. **MA Type**: Choose "MA" for Simple Moving Average or "EMA" for Exponential Moving Average
2. **Timeframe**: Select "Weekly" for weekly-based MA or "Daily" for daily-based MA
3. **MA Period**: Set the number of periods for the moving average calculation (default: 50)
## Use Cases
- **Trend Identification**: Quickly identify overall market trend direction
- **Entry/Exit Signals**: Use color changes as potential entry or exit signals
- **Multi-Timeframe Analysis**: Combine with different chart timeframes for comprehensive analysis
- **Visual Clarity**: Reduce chart clutter while maintaining essential trend information
## Best Practices
- Use Weekly MA for longer-term trend identification
- Use Daily MA for shorter-term trend analysis
- Combine with other technical indicators for confirmation
- Adjust the MA period based on your trading style and timeframe
## Technical Details
- Built with Pine Script v6
- Overlay indicator (displays on main chart)
- Optimized for performance
- Compatible with all TradingView chart types
---
**Note**: This indicator is for educational and informational purposes only. Always conduct your own analysis and risk management before making trading decisions.
SevenDayHighLowTableWithBoxes [CHE]SevenDayHighLowTableWithBoxes — Seven-day day-range boxes with a weekday-aware “ghost” projection and a compact table that tracks recent extremes and per-weekday hit rates.
Summary
This indicator visualizes each trading day as a colored box and annotates the final high and low with compact markers. It maintains a rolling seven-day view and a five-column table showing day name, high, low, range, and a per-weekday projection hit statistic. A dashed “ghost” box projects a typical range for the current weekday using a running average and an adjustable scaling factor. The script is written in Pine v6, runs on the main chart (overlay true), and emphasizes stable object handling and closed-bar finalization at day boundaries.
Motivation: Why this design?
Intraday traders often need fast context for where today’s price sits relative to recent daily extremes, without switching timeframes. A simple daily high/low overlay is informative but lacks structure, sizing context, and continuity. By grouping bars into local days (configurable UTC offset), drawing explicit boxes, and projecting a weekday-typical range, the chart becomes easier to scan. The compact table gives a quick audit trail of the latest seven days while tracking how often the weekday projection would have covered the realized range.
What’s different vs. standard approaches?
Reference baseline: Plain daily high/low lines or session boxes without context.
Architecture differences:
Weekday-tinted boxes and labels for today plus up to six prior days.
Weekday average range drives a dashed projection (“ghost”) sized by a user-defined percentage.
Per-weekday hit statistics recorded as hits over totals and displayed in the table.
ATR-based vertical offsets keep labels readable.
Live updates intraday; state is finalized at the local day switch.
Practical effect: The chart shows where current price sits inside a known daily envelope, plus how “typical” the day’s movement is for this weekday, aiding expectations and planning.
How it works (technical)
The script computes a local daily timestamp using the user’s UTC offset. A day change finalizes the prior day, writes its high, low, start and end indices, and records the bar indices of the terminal high and low.
For each weekday, it maintains a running average of realized ranges with a cap on the lookback count. The ghost projection length is the weekday average scaled by the user’s percentage setting.
Anchor selection for the ghost uses the most recent extreme and the close relative to the intraday midpoint to choose a low-anchored or high-anchored box.
A five-column table (Day, High, Low, Range, Ghost OK) is refreshed on the last bar. The “Ghost OK” column shows per-weekday cumulative hits over totals with a percentage, calculated before including the just-finished day.
Object counts are bounded to seven days by pruning arrays and deleting old boxes and labels. Visual updates for historical objects occur on the last bar to minimize overhead. No `security()` calls are used.
Parameter Guide
UTC (+/−) — Controls local day boundaries — Default: minus five hours — Set to your venue’s local time.
Session (for Time gate) — Session string — Default: full week — (Optional) computed internally; not applied to gating.
Show 7-Day High/Low Table — Toggles the table — Default: true — Disable to reduce UI load.
Show Day Boxes in Chart — Toggles day boxes — Default: true — Disable for a cleaner chart.
Table Position — Nine-point anchor — Default: Middle Right — Move to avoid overlap.
Table Background / Text Color / Min Cell Width — Styling controls — Defaults: gray background, white text, width twelve characters.
Weekday Colors (Sun…Sat) — Row and box tints — Defaults: semi-transparent hues — Adjust for your theme.
Triangle Transparency — Marker opacity — Default: zero — Increase to fade high/low dots.
Day Label Transparency — Day name opacity — Default: zero — Increase to reduce emphasis.
Box Border Width — Box stroke width — Default: one — Increase for stronger edges.
Extend Boxes Right — Extend current box — Default: false — Useful for forward planning.
Show Average Range Ghost Box — Dashed projection — Default: true — Disable if distracting.
Ghost Border Color / Width — Ghost styling — Defaults: gray, width one.
Ghost Length percent of AvgRange — Projection scale — Default: one hundred; bounds zero to five hundred — Lower to be conservative.
Max History Days for Average — Cap per-weekday averaging — Default: two hundred fifty-two; bounds thirty to five hundred.
ATR Length / Day Label ATR Multiplier / Triangle Up ATR Multiplier / Triangle Down ATR Multiplier — Offsets for label placement — Defaults: length one hundred; multipliers zero — Increase on dense instruments to prevent overlap.
Reading & Interpretation
Day boxes: The filled rectangle marks each day’s full high-low span; color encodes the weekday.
Markers: Small dots near the terminal high and low highlight where the final extremes occurred.
Ghost box: A dashed box sized by the weekday average range, anchored based on recent behavior. It is a typical span, not a target.
Table: Row one shows “Today”. Rows below list up to six prior days. “Ghost OK” shows per-weekday cumulative hits over totals with a percentage, which reflects historical coverage quality for that weekday.
Practical Workflows & Combinations
Trend following: Use the current box plus recent boxes to read expansion or compression days; combine with basic structure such as higher-highs and higher-lows or lower-lows and lower-highs for confirmation.
Exits and risk: When price nears the ghost boundary late in the session, consider managing exposure more conservatively.
Multi-asset and multi-timeframe: Works on minute charts. As a starting point, use five to less than sixty minutes. For cross-checks, pair with a higher timeframe bias filter.
Behavior, Constraints & Performance
Repaint/confirmation: The indicator updates intraday; extremes and ghost position can move while the day is open. Values are finalized on the next local day start.
HTF/security: None used; repaint risk is limited to live-bar movement.
Resources: `max_bars_back` five thousand; arrays are pruned to seven days; the table and color sync run on the last bar; the live ghost updates only in real time.
Known limits: Weekday averages can be unrepresentative during regime shifts, events, or gaps. Day boundaries depend on the UTC offset being set correctly. No alerts are included. The script displays warning labels when the timeframe is below five minutes or at sixty minutes and above.
Sensible Defaults & Quick Tuning
Start with the defaults.
Ghost too aggressive: Lower the percent scale.
Labels overlap: Increase ATR multipliers.
Clutter or performance issues: Hide the table or boxes, or disable the ghost.
Day boundary misaligned: Adjust the UTC offset to your market.
What this indicator is—and isn’t
This is a visualization and context layer for daily extremes and a weekday-based typical span. It does not predict direction, does not manage orders, and is not a complete trading system. Use it alongside market structure, risk controls, and position management.
Disclaimer
The content provided, including all code and materials, is strictly for educational and informational purposes only. It is not intended as, and should not be interpreted as, financial advice, a recommendation to buy or sell any financial instrument, or an offer of any financial product or service. All strategies, tools, and examples discussed are provided for illustrative purposes to demonstrate coding techniques and the functionality of Pine Script within a trading context.
Any results from strategies or tools provided are hypothetical, and past performance is not indicative of future results. Trading and investing involve high risk, including the potential loss of principal, and may not be suitable for all individuals. Before making any trading decisions, please consult with a qualified financial professional to understand the risks involved.
By using this script, you acknowledge and agree that any trading decisions are made solely at your discretion and risk.
Do not use this indicator on Heikin-Ashi, Renko, Kagi, Point-and-Figure, or Range charts, as these chart types can produce unrealistic results for signal markers and alerts.
Best regards and happy trading
Chervolino
SRD
SRD v11 - Multi-Timeframe Volume Profile (POC, VAH, VAL)
Key Features
Dual Timeframe Analysis:
📈 Main Analysis (Daily): Calculates and displays the most significant levels based on a user-defined period of daily bars. This is ideal for identifying intraday and short-term trading opportunities.
📊 Strategic Analysis (Weekly): Plots key levels from a weekly perspective, giving you a broader, long-term view of market sentiment and structure. This can be toggled on or off.
Volume Profile Core Levels: The indicator automatically calculates and visualizes the three most important levels derived from volume analysis for both timeframes:
🎯 POC (Point of Control): The price level with the highest traded volume for the specified period. It acts as a powerful magnet for price and a key reference for market equilibrium.
🔴 VAH (Value Area High): The highest price level within the "Value Area" (where ~70% of the volume was traded). It often acts as a significant resistance zone.
🟢 VAL (Value Area Low): The lowest price level within the Value Area. It often serves as a strong support zone.
🟠 24-Hour High: An optional feature that plots the highest price reached in the last 24 hours, providing a crucial reference point for breakout and reversal traders.
Dynamic and Non-Repainting: The levels are calculated based on historical confirmed bars and update automatically as new periods (daily or weekly) close. The lines extend to the right, remaining relevant until a new calculation period begins.
Integrated Alert System: Never miss a key price interaction. The indicator includes a comprehensive alert system for:
Breakouts: Triggers when the price crosses above or below the POC, VAH, or VAL.
Touches: Triggers when the price touches one of these key levels without breaking through it (within a small tolerance).
Unified Alert: A single alert that notifies you of any of the above conditions.
Customization
The SRD v11 is fully customizable to fit your trading style. You can adjust:
Timeframes: Change the base timeframes for both the main (default Daily) and strategic (default Weekly) analysis.
Analysis Periods: Define the number of bars (days or weeks) to include in the Volume Profile calculation.
Visuals: Customize the color, width, and style (solid, dashed, dotted) of every line and label for clear and intuitive visualization.
Toggle Elements: Easily show or hide the strategic (weekly) analysis and the 24-hour high line.
How to Use It >
Identify Key Zones: Use the VAH (resistance) and VAL (support) lines to identify potential entry and exit zones. The area between VAH and VAL is the "Value Area," where the market has found acceptance.
Monitor the POC: The Point of Control is the ultimate level of equilibrium. Watch for price reactions around the POC. A sustained break above or below can signal a new trend.
Combine Timeframes: Use the strategic (weekly) levels as major, long-term points of interest and the main (daily) levels for your day-to-day trading setup. Confluence between levels from different timeframes can indicate extremely strong support or resistance.
Set Alerts: Configure alerts for breakouts or touches to be notified of critical market movements in real-time, even when you are away from the charts.
X Tail that Wagsintraday session-framework and ETH-anchored VWAP tool for TradingView. It draws today’s OVN (ETH) high/mid/low, today’s RTH-day open, previous day open/high/low, and a carried ETH VWAP handle (yesterday’s 4:00 PM NY VWAP, projected forward) to give you a clean, non-repainting scaffold for bias, structure, and execution. All timestamps are New York–local with DST handled explicitly, so historical sessions align correctly across time changes.
Key Capabilities
ETH OVN Range (18:00 → 09:30 NY)
Captures the rolling overnight high/low and computes the mid; at 09:30 NY it locks those levels and extends them to 16:00 NY (same day).
Optional labels (size/color configurable) placed slightly to the right of the 4 PM timestamp for readability.
Daily Handles (Today & Previous Day)
Today’s open line starts at the ETH open (anchor preserved) and extends toward 4 PM NY (or up to the “current bar + 5 bars” cap), with label control.
Previous day open/high/low plotted as discrete reference lines for carry-over structure.
ETH-Anchored VWAP (Live) + Bands
ETH-anchored VWAP runs only during the active ETH session (DST-aware).
Optional VWAP bands (0.5×, 1.0×, 2.0× multipliers) plotted as line-break series.
Carried ETH VWAP Handle (PD 4 PM Snapshot)
At 16:00 NY, the script snapshots the final ETH VWAP value.
On the next ETH open, it projects that value as a static dashed line through the session (non-mutating, non-repainting), with optional label.
Labeling & Styling
Single-toggle label system with color and five sizes.
Per-line color/width controls for quick visual hierarchy.
Internal “tail” logic keeps right endpoints near price (open-anchored lines extend to min(4 PM, now + 5 bars)), avoiding chart-wide overdraw.
Robust Session Logic
All session boundaries computed in NY local time; DST rules applied for historical bars.
Cross-midnight windows handled safely (no gaps or misalignment around day rolls).
Primary Use Cases
Session Bias & Context
Use OVN H/M/L and today’s open to define structural bias zones before RTH begins. A break-and-hold above OVN mid, for example, can filter long ideas; conversely, rejection at OVN high can warn of mean reversion.
Carry-Forward Mean/Value Reference
The carried ETH VWAP (PD 4 PM) acts as a “value memory” line for the next day. Traders can:
Fade tests away from it in balanced conditions,
Use it as a pullback/acceptance gauge during trends,
Track liquidity grabs when price spikes through and reclaims.
Execution Planning & Risk
Anchor stops/targets around PD H/L and OVN H/M/L for well-defined invalidation.
Combine with your entry model (order-flow, momentum, or pattern) to time fades at range extremes or momentum breaks from OVN mid.
Confluence Mapping
Layer the tool with opening range tools, HTF zones, or profile/VWAPs (weekly/daily) to spot high-quality confluence where multiple references cluster.
Regime & Day-Type Read
Quickly see whether RTH accepts/rejects the OVN range or gravitates to PD VWAP handle, helping classify the day (trend, balanced, double-distribution, etc.).
Quick Start
Apply to your intraday chart (any instrument supported by TradingView; best on ≤15m for live intraday context).
In Current Day group, keep Open and OVN HL on; optionally display the mid.
In Previous Day group, enable PD Open/HL for carry-over levels.
Enable AVWAP if you want live ETH-anchored VWAP and its Bands for distance context.
Keep PD VWAP on to project yesterday’s 4 PM ETH VWAP as a static dashed line into today.
Use the Label group to size/color the on-chart tags.
Settings Overview (Plain-English)
Label: Toggle labels on/off; choose label text color and size.
Current Day:
Open (color/width) — daily open line anchored at ETH open.
OVN HL (and Mid) — overnight high/low and midpoint, locked at 09:30 and extended to 16:00.
AVWAP + Bands — ETH-anchored VWAP with optional 0.5×/1×/2× bands.
Previous Day:
PD Open/HL — yesterday’s daily handles.
PD VWAP — the carried snapshot of yesterday’s 4 PM ETH VWAP projected forward (dashed).
Notes & Best Practices
Time Zone: All session logic is hard-coded to America/New_York and DST-robust. No manual DST tweaks required.
Non-Repainting: The carried PD VWAP line is a snapshot; once drawn, it does not back-fill or mutate.
Intraday Use: Designed for intraday execution. It will display on higher TFs, but the session granularity is most informative at ≤15m.
Performance: Script caps lines/labels (500) and uses short “tails” to keep charts responsive.
Compatibility: Uses request.security(..., "D", series, lookahead_on) intentionally to lock daily handles early for planning; this is by design.
Typical Playbook Examples
Fade Extremes in Balance: As RTH opens inside OVN, look for rejection wicks at OVN High with confluence from PD VWAP handle overhead; risk above OVN High.
Trend Continuation: In directional sessions, acceptances above OVN Mid with price pulling back to the live ETH VWAP can offer continuation entries.
Reversion to Value: Sharp extensions away from the carried PD VWAP that quickly stall often revert to that handle; use it as a target or as an acceptance test.
MCL RSI Conflux v2.5 — Multi-Timeframe Momentum & Z-Score Full Description
Overview
The MCL RSI Conflux v2.5 is a multi-timeframe momentum model that integrates daily, weekly, and monthly RSI values into a unified composite. It extends the classical RSI framework with adaptive overbought/oversold thresholds and statistical normalization (Z-score confluence).
This combination allows traders to visualize cross-timeframe alignment, identify synchronized momentum shifts, and detect exhaustion zones with higher statistical confidence.
Methodology
The script extracts RSI data from three major time horizons:
Daily RSI (short-term momentum)
Weekly RSI (intermediate trend)
Monthly RSI (macro bias)
Each RSI is optionally smoothed, weighted, and aggregated into a Composite RSI.
A Z-score transformation then measures how far each RSI deviates from its historical mean, revealing when momentum strength is statistically extreme or aligned across timeframes.
Key Features
Multi-Timeframe RSI Engine – Computes RSI across D/W/M intervals with individual weighting controls.
Adaptive Overbought/Oversold Bands – Automatically adjusts OB/OS thresholds based on rolling volatility (standard deviation of daily RSI).
Composite RSI Score – Weighted consensus RSI that represents total market momentum.
Z-Score Confluence Analysis – Identifies when all three timeframes are statistically synchronized.
Z-Composite Histogram – Displays aggregated Z-score strength around the midline (50).
Divergence Detection – Flags confirmed pivot-based bull and bear divergences on the daily RSI.
Dynamic Gradient Background – Shifts from red to green based on composite momentum regime.
Customizable Control Panel – Displays RSI values, Z-scores, state, and adaptive bands for each timeframe.
Integrated Alerts – For crossovers, risk-on/off thresholds, alignment, and Z-confluence events.
Interpretation
All RSI values above 50: multi-timeframe bullish alignment.
All RSI values below 50: multi-timeframe bearish alignment.
Composite RSI > 60: risk-on environment; momentum expansion.
Composite RSI < 45: risk-off environment; momentum contraction.
Adaptive OB/OS hits: potential exhaustion or mean reversion setup.
Green Z-ribbon: all Z-scores positive and aligned (statistical confirmation).
Red Z-ribbon: all Z-scores negative and aligned (broad market weakness).
Divergences: short-term warning signals against the prevailing momentum bias.
Practical Application
Use the Composite RSI as a global momentum gauge for position bias.
Trade only in the direction of higher-timeframe alignment (avoid countertrend RSI).
Combine Z-ribbon confirmation with Composite RSI crosses to filter noise.
Use divergence labels and adaptive thresholds for risk reduction or exit timing.
Ideal for swing traders and macro momentum models seeking trend synchronization filters.
Recommended Settings
Market Mode k-Band Lookback Use Case
Stocks / ETFs Adaptive 0.85 200 Medium-term rotation filter
Crypto Adaptive 1.00 150 Volatility-responsive swing filter
Commodities Fixed 70/30 100 Mean reversion model
Alerts Included
Daily RSI crossed above/below Weekly RSI
Composite RSI > Risk-On threshold
Composite RSI < Risk-Off threshold
All RSI aligned above/below 50
Z-Score Conformity (All positive or all negative)
Overbought/Oversold triggers
Author’s Note
This indicator was designed for research and systematic confluence analysis within Mongoose Capital Labs.
It is not financial advice and should be used in combination with independent risk assessment, volume confirmation, and higher-timeframe context.
Volume Area 80 Rule Pro - Adaptive RTHSummary in one paragraph
Adaptive value area 80 percent rule for index futures large cap equities liquid crypto and major FX on intraday timeframes. It focuses activity only when multiple context gates align. It is original because the classic prior day value area traverse is fused with a daily regime classifier that remaps the operating parameters in real time.
Scope and intent
• Markets. ES NQ SPY QQQ large cap equities BTC ETH major FX pairs and other liquid RTH instruments
• Timeframes. One minute to one hour with daily regime context
• Default demo used in the publication. ES1 on five minutes
• Purpose. Trade only the balanced days where the 80 percent traverse has edge while standing aside or tightening rules during trend or shock
Originality and usefulness
• Unique fusion. Prior day value area logic plus a rolling daily regime classifier using percentile ranks of realized volatility and ADX. The regime remaps hold time end of window stop buffer and value area coverage on each session
• Failure mode addressed. False starts during strong trend or shock sessions and weak traverses during quiet grind
• Testability. All gates are visible in Inputs and debug flags can be plotted so users can verify why a suggestion appears
• Portable yardstick. The regime uses ATR divided by close and ADX percent ranks which behave consistently across symbols
Method overview in plain language
The script builds the prior session profile during regular trading hours. At the first regular bar it freezes yesterday value area low value area high and point of control. It then evaluates the current session open location the first thirty minute volume rank the open gap rank and an opening drive test. In parallel a daily series classifies context into Calm Balance Trend or Shock from rolling percentile ranks of realized volatility and ADX. The classifier scales the rules. Calm uses longer holds and a slightly wider value area. Trend and Shock shorten the window reduce holds and enlarge stop buffers.
Base measures
• Range basis. True Range smoothed over a configurable length on both the daily and intraday series
• Return basis. Not required. ATR over close is the unit for regime strength
Components
• Prior Value Area Engine. Builds yesterday value area low value area high and point of control from a binned volume profile with automatic TPO fallback and minimum integrity guards
• Opening Location. Detects whether the session opens above the prior value area or below it
• Inside Hold Counter. Counts consecutive bars that hold inside the value area after a re entry
• Volume Gate. Percentile of the first thirty minutes volume over a rolling sample
• Gap Gate. Percentile rank of the regular session open gap over a rolling sample
• Drive Gate. Opening drive check using a multiple of intraday ATR
• Regime Classifier. Percentile ranks of daily ATR over close and daily ADX classify Calm Balance Trend Shock and remap parameters
• Session windows optional. Windows follow the chart exchange time
Fusion rule
Minimum satisfied gates approach. A re entry must hold inside the value area for a regime scaled number of bars while the volume gap and drive gates allow the setup. The regime simultaneously scales value area coverage end minute time stop and stop buffer.
Signal rule
• Long suggestion appears when price opens below yesterday value area then re enters and holds for the required bars while all gates allow the setup
• Short suggestion appears when price opens above yesterday value area then re enters and holds for the required bars while all gates allow the setup
• WAIT shows implicitly when any required gate is missing
• Exit labels mark target touch stop touch or a time based close
Inputs with guidance
Setup
• Signal timeframe. Uses the chart by default
• Session windows optional. Start and end minutes inside regular trading hours
• Invert direction is not used. The logic is symmetric
Logic
• Hold bars inside value area. Typical range 3 to 12. Raising it reduces trades and favors better traverses. Lowering it increases frequency and risk of false starts
• Earliest minute since RTH open and Latest minute since RTH open. Typical range 0 to 390. Reducing the latest minute cuts late session trades
• Time stop bars after entry. Typical range 6 to 30. Larger values give setups more room
Filters
• Value area coverage. Typical range 0.70 to 0.85. Higher coverage narrows the traverse but accepts fewer days
• Bin size in ticks. Typical range 1 to 8. Larger bins stabilize noisy profiles
• Stop buffer ticks beyond edge. Typical range 2 to 20. Larger buffers survive noise
• First thirty minute volume percentile. Typical range 0.30 to 0.70. Higher values require more active opens
• Gap filter percentile. Typical range 0.70 to 0.95. Lower values block more gap days
• Opening drive multiple and bars. Higher multiple or longer bars block strong directional opens
Adaptivity
• Lookback days for regime ranks. Typical 150 to 500
• Calm RV percentile. Typical 25 to 45
• Trend ADX percentile. Typical 55 to 75
• Shock RV percentile. Typical 75 to 90
• End minute ratio in Trend and Shock. Typical 0.5 to 0.8
• Hold and Time stop scales per regime. Use values near one to keep behavior close to static settings
Realism and responsible publication
• No performance claims. Past results never guarantee future outcomes
• Shapes can move while a bar forms and settle on close
• Sessions use the chart exchange time
Honest limitations and failure modes
• Economic releases and thin liquidity can break the balance premise
• Gap heavy symbols may work better with stronger gap filters and a True Range focus
• Very quiet regimes reduce signal contrast. Consider longer windows or higher thresholds
Legal
Education and research only. Not investment advice. Test in simulation before any live use.


