BB + OBV + RSI Strategy (Enhanced + Daily Table) Script Brief – *BB + OBV + RSI Strategy (Enhanced + Daily Table)*
This TradingView Pine Script combines **Bollinger Bands (BB)**, **On-Balance Volume (OBV)**, **Relative Strength Index (RSI)**, and **Exponential Moving Average (EMA)** to help traders identify potential trend conditions and market strength.
**Key Features:**
* **Bollinger Bands** (20-period SMA ± 2 Std Dev by default) to track volatility and price extremes.
* **OBV & OBV Moving Average** to confirm buying or selling pressure.
* **RSI** to highlight overbought and oversold zones.
* **200 EMA** as a long-term trend filter.
* **Daily Comparison Table** (top-right corner):
* Displays today’s vs. yesterday’s values for Close, RSI, OBV vs MA, BB Position, and EMA Trend.
* Helps quickly assess whether momentum and trend conditions are strengthening or weakening.
**Usage:**
* The chart shows **BB lines and EMA** for real-time analysis on any timeframe.
* The **table provides higher-timeframe context** (daily values), making it easier to confirm signals across multiple timeframes.
* Best applied with backtesting and proper risk management.
ค้นหาในสคริปต์สำหรับ "daily"

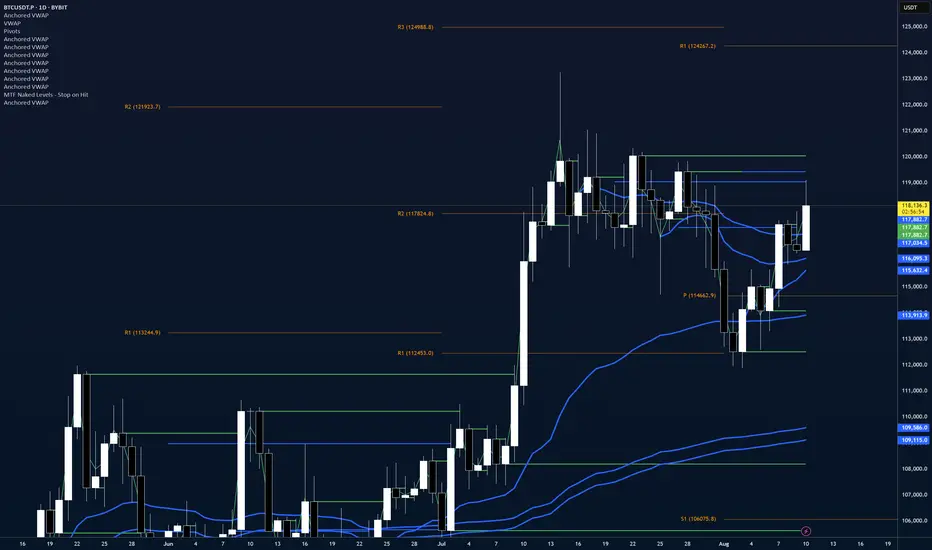
Modified - Pivot Points Standard with Daily H/L/CThis indicator plots Pivot Points Standard with six calculation methods (Traditional, Fibonacci, Woodie, Classic, DM, Camarilla) and flexible anchors (Auto/D/W/M/Q/Y and multi-year). You can restrict pivots to the current day/week/month, choose daily-based data (uses higher-timeframe OHLC; futures use settlement close) or intraday aggregation, and independently style pivots versus previous-period lines with solid/dashed/dotted types and custom widths. Per-level colors are provided (PP/R/S), with R4/R5 and S4/S5 off by default, plus optional labels showing prices positioned left or right. It also draws the previous Day/Week/Month High, Low, and Close across the current period using completed higher-timeframe values (lookahead_off with ), ensuring they always reflect the prior session/period. Rendering is optimized by limiting historical pivot sets and auto-cleaning old lines for smooth performance on any timeframe.

Dani u nedelji + midnight open @mladja123This indicator breaks the weekly timeframe into cycles and marks the midnight open for each day. It helps traders visualize weekly structure, identify key daily openings, and track market rhythm within the week. Perfect for analyzing trend patterns, swing setups, and session-based strategies.

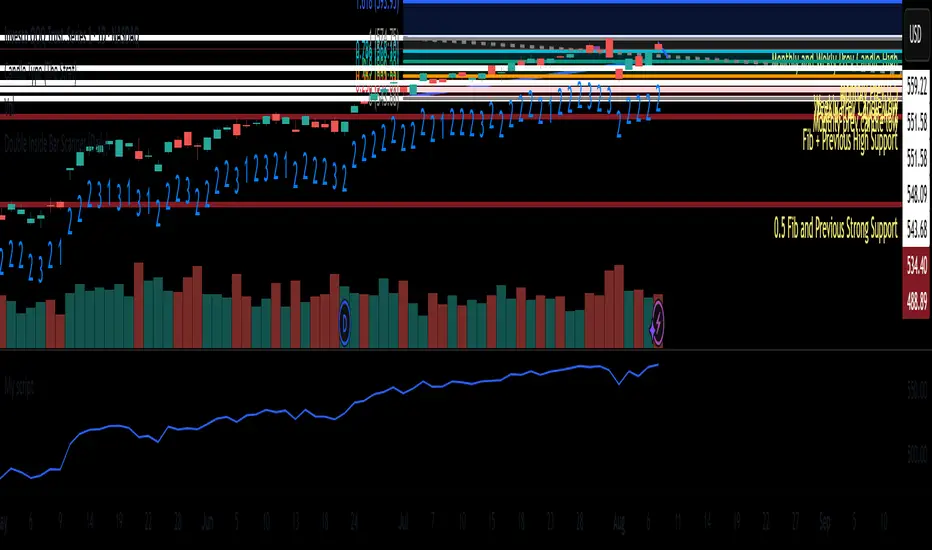
Aggressive Phase + Daily Buy Visual Screener — v6Aggressive Phase + Daily Buy Visual Screener — v6 for bullish, neutral and bearish zone identification

Average Daily Range TrackerAverage Daily Range Tracker
This indicator helps you measure volatility in real time by tracking the Average Daily Range (ADR) and comparing it to the current day’s price action.
🔑 Features
Calculates the ADR over a user-defined lookback period (default = 14 days).
Displays today’s developing range (High–Low) as the session unfolds.
Shows what % of the ADR has already been consumed intraday.
Visual progress bar makes it easy to see how close today is to its historical average range.
Optional ADR plot available in a separate pane.
📈 How traders use it
Spot when a market has already made its “typical” daily move.
Adjust intraday trade expectations: avoid chasing after the bulk of the move is done.
Use % of ADR consumed as a volatility filter for setups.
Combine with support/resistance to identify exhaustion zones.
⚙️ Customization
Lookback length for ADR calculation.
Progress bar size and color.
Optional toggle to plot ADR in its own panel.

Auto Daily High/Low/50%This indicator automatically plots the current daily high and low, as well as the midrange.

Volume Spikes + Daily VWAP SD BandsVolume Spikes + Daily VWAP SD Bands
This indicator combines volume spike detection to help traders identify potential absorption zones with daily VWAP and standard deviation bands , key price levels, continuation opportunities, and possible institutional bias.
Features:
Volume Spike Detection
Highlights candles with unusually high volume relative to a configurable SMA.
Optional filters:
Local highs/lows only (Only Use Valid Highs & Lows)
Candle shapes: Hammer / Shooter only
Candle color match: bullish spikes on green, bearish on red
Plots small circles above/below bars for bullish and bearish volume spikes.
Alerts available for both bullish and bearish spikes.
Interpretation: Volume spikes at local highs/lows can indicate absorption, where one side absorbs aggressive buying/selling pressure.
Daily VWAP
Calculates volume-weighted average price (VWAP) for the current day.
Optionally shows previous day’s VWAP for reference.
Plot lines are customizable with optional circles on lines for visual clarity.
Labels on the last bar show exact VWAP values.
Institutional Bias Insight: Price above both current and previous VWAPs may indicate bullish positioning; price below both VWAPs may indicate bearish positioning. Many professional traders consider this a clue to institutional bias, but it’s not guaranteed. Always confirm with volume, delta, or orderflow analysis.
Standard Deviation Bands
Optional x1 and x2 SD bands around the daily VWAP.
Visual fill between bands shows price volatility zones.
Can be used to identify potential support/resistance or absorption zones.
Use Case: Price bounces off first SD band may indicate continuation signals, especially when volume spikes occur at those levels.
Customizable Visuals
Colors for bullish and bearish volume spikes
VWAP and SD band colors and thickness
Optional circles and filled bands for better readability
Alerts
Bullish / Bearish Volume Spikes
Supports TradingView alert system for automated notifications
Advanced Use Cases:
Combine with Cumulative Delta or Orderflow tools to confirm true absorption zones.
Identify high-volume rejection candles signaling possible trend continuation.
Use VWAP positioning relative to price to assess potential institutional bias, keeping in mind it is probabilistic, not guaranteed.
Visualize intraday VWAP levels and volatility with SD bands for better trade timing.
Settings: Fully customizable, including volume multiplier, SMA length, session filter, candle shape, color options, and VWAP/SD display preferences.

Market Sessions & Daily Range ProThis tool is designed for market visualization. It displays the real trading sessions (Asia, Europe, and America) together with the daily range (00:00–24:00). Boxes and labels show daily highs, lows, open/close levels, and current extremes. The purpose is to provide traders with a clear visual map of how price behaves across sessions and within the daily structure.

LevelsThis Indicator is meant to plot some of the most common levels that traders use.
The display of these levels is highly customizable, as you can choose the line type , color , thickness and whether it shows you no label, price only, reduced label or full label next to the line. All labels (except for "no Label") will show the price at this level.
Also You have the option to mark the start on each timeframe with either a individually colored background or a vertical line where you can choose the line style and color.
Full List of available Levels and Optional inputs to these levels:
Previous HTF Candle Levels:
• Previous HTF Candle Open
• Previous HTF Candle High
• Previous HTF Candle Low
• Previous HTF Candle Close
Optional:
• Choose any higher timeframe
• Mark start of new HTF candle
Session Levels:
• Session Open
• Session High
• Session Low
• Session Close
Optional:
• Choose any time as start and end of your session
• Mark start of session
• Mark full session
Daily Levels:
• Current Day Open
• Current Day High
• Current Day Low
• Previous Day Open
• Previous Day High
• Previous Day Low
• Previous Day Close
Optional:
• Choose start of day (standard, NY Midnight, custom start time)
• Mark start of day
Weekly Levels:
• Current Week Open
• Current Week High
• Current Week Low
• Previous Week Open
• Previous Week High
• Previous Week Low
• Previous Week Close
Optional:
• Mark start of Week
Monthly Levels:
• Current Month Open
• Current Month High
• Current MonthLow
• Previous Month Open
• Previous Month High
• Previous Month Low
• Previous Month Close
Optional:
• Mark start of Month

Weekly and Daily EMA levelsThis Pine Script indicator provides important weekly and daily levels for lower time frame traders, whom trades based on reaction of these levels.
Dedicated to Prof Michael G
Key Features:
Multi-timeframe EMAs: Shows 12, 21, 50, 100, and 200 period EMAs from both Weekly and Daily timeframes
Horizontal dotted lines: Uses plot.style_linebr to create the dotted/dashed line effect
Works on all timeframes: The lines will appear on any chart timeframe you're viewing
Customizable: Individual toggles for each EMA period and timeframe
Settings Available:
Toggle Weekly/Daily EMAs on/off
Enable/disable individual EMA periods (12, 21, 50, 100, 200)
Customize colors for each EMA line
Adjust line width
Optional labels showing current EMA values
How to Use:
Copy the code into TradingView's Pine Editor
Click "Add to Chart"
Adjust settings in the indicator's Style tab as needed
The weekly EMAs appear with slightly more opacity (30%) while daily EMAs have higher transparency (60%) to help distinguish between timeframes. The lines will automatically update as new bars form and will be visible regardless of what timeframe you're currently viewing on your chart.

HTF Bias Signals (Daily EMA Bias + LTF EMA Cross)clean, flexible indicator (Pine v5). It defines higher-timeframe (HTF) bias from Daily and/or Weekly EMAs, then only fires entries on your chart’s timeframe when that bias agrees with a simple fast/slow EMA trigger. It also includes alertconditions so you can automate alerts.


Monthly weekly daily Naked LevelsFor example, if the day closes positive and the next day closes negative, or vice versa, you have a daily level. The next time the price returns to this level, you can consider it an S/R level.
This indicator shows these levels until the first touch.
Double Inside Bar Scanner [Daily]Double Inside Bar Scanner . Captures Double Inside based on last 2 daily Bars
Liquidity Grab Entry Signals [Daily Enhanced]Liquidity Grab Entry Signals is a powerful tool designed to detect intraday reversal opportunities around daily high/low liquidity zones.
Core features: – Plots current daily high/low levels
– Identifies price interaction with these key zones
– Confirms rejection via strong engulfing candles
– Plots real-time long/short entry signals directly on chart
– Includes alerts for both long and short setups
This script is ideal for scalpers and intraday traders looking to exploit stop hunts, liquidity sweeps, and false breakouts.
Optimized for instruments like US30, NAS100, Gold, BTC and more.
Customize the sensitivity buffer to suit your asset and timeframe.
Use this in combination with VWAP, FVG or Smart Money concepts for enhanced confirmation.
---
Built for: 1s–15m charts
Includes: Alerts + Custom Settings
Type: Non-repainting
Trade with clarity around the most manipulated price levels of the day.

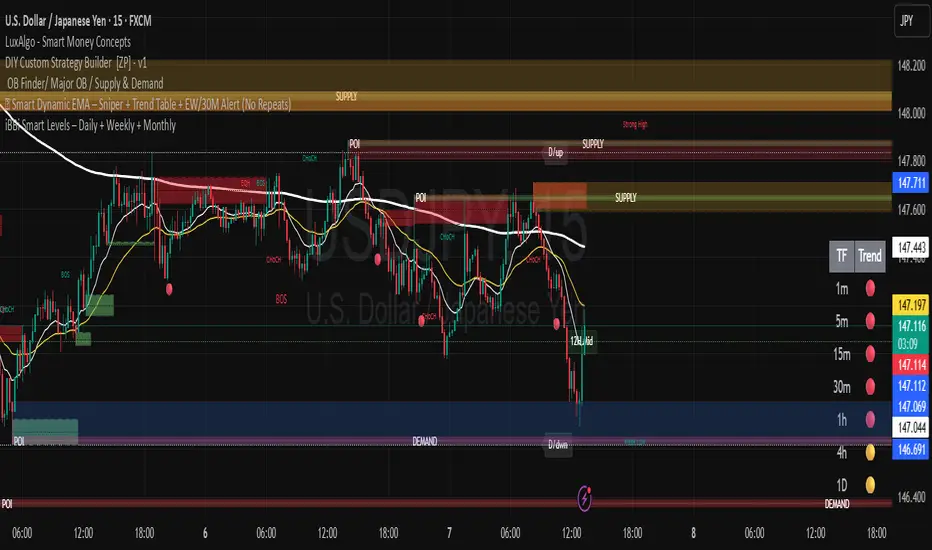
iBBi Smart Levels – Daily + Weekly + MonthlyThis is a level indicator. In trading levels make lots of difference - this indicator gives us, daily, weekly and monthly levels. Then, it gives last 12-hours high and low level. This means at any given time you will have these EIGHT LEVELS available to you.
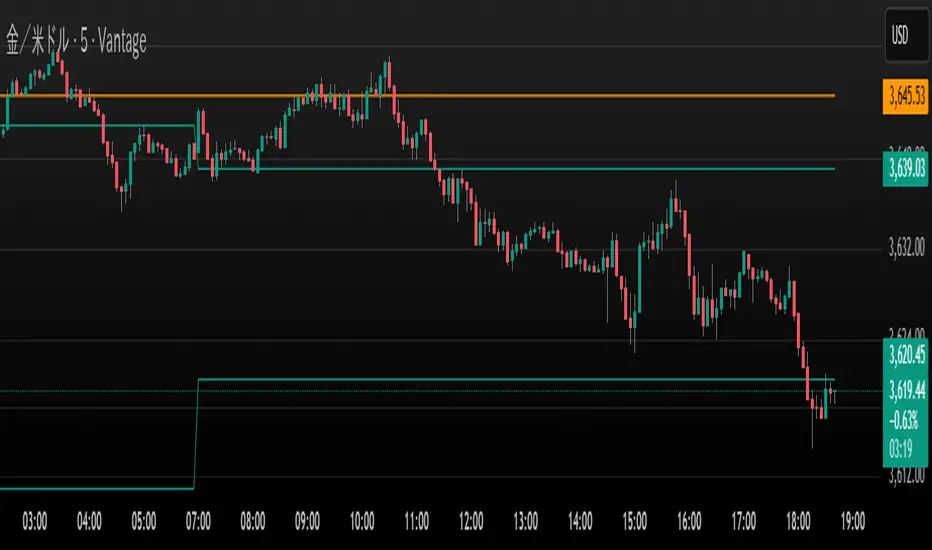
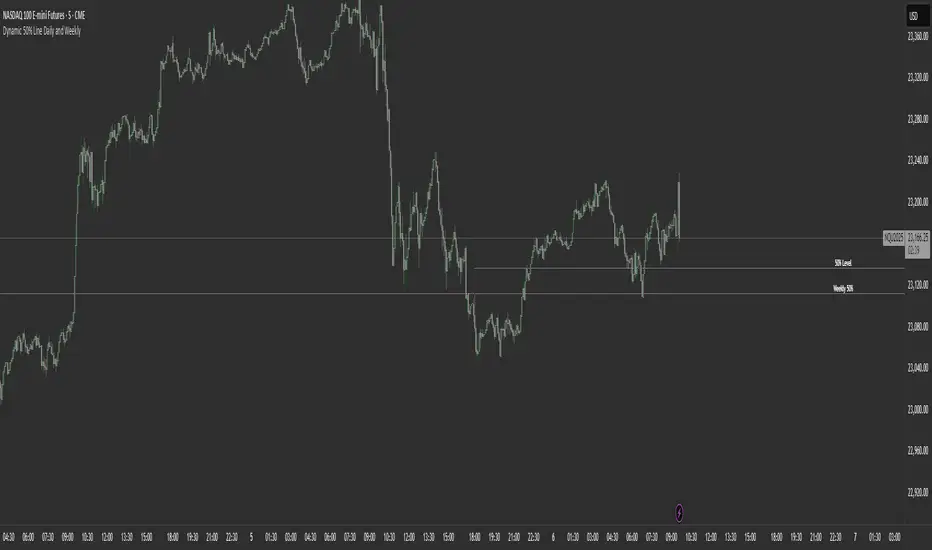
Dynamic 50% Line [Daily and Weekly Range]This indicator automatically plots the 50% retracement level (midpoint) of the daily and weekly trading ranges. It helps traders identify key support/resistance zones where price may react, offering insights into potential reversal or continuation areas.
Auction Market Theory & the 50% Level
At its core, this indicator is built on Auction Market Theory (AMT), which views price movement as an ongoing auction process where buyers and sellers compete to establish value. The 50% midpoint represents fair value—the equilibrium where price is most likely to balance before continuing its trend or reversing.
When price deviates too far from this level, it often returns to balance (mean reversion) or accepts new value (breakout). By tracking the daily and weekly 50% lines, traders can:
Identify high-probability reversal zones (where price may reject fair value).
Spot trend continuation areas (where price accepts higher/lower value).
Align with institutional order flow, as large players often use these levels for execution.
This makes the indicator particularly powerful for traders who follow volume profile, order flow, or ICT concepts, as it visually maps the market’s ongoing auction process.
Features:
✅ Automated Daily & Weekly Midpoints – Calculates the 50% level from the high/low of each session.
✅ Customizable Line Styles – Choose between solid, dotted, or dashed lines for better visibility.
✅ Clear Labeling – Optional text labels show "50% Level" or custom text at your preferred position (left, middle, or right).
✅ Flexible Styling – Adjust line colors, thickness, and text size to match your chart theme.
How It Works:
Daily 50% Line: Resets at 6 PM NY time (new trading day).
Weekly 50% Line: Resets on Sunday at 6 PM NY time (new trading week).
The midpoint is calculated as:
(High + Low) / 2
Lines extend 500 bars forward for easy visibility.
Why Use This Indicator?
Unlike static Fibonacci tools, this dynamic indicator auto-updates the 50% level as new highs/lows form, saving time and improving accuracy. Whether you trade forex, stocks, or crypto, these levels often act as strong magnets for price action.
Average Daily % Change by Weekday📊 Average Daily % Change by Weekday
This script calculates and displays the average daily percentage change for each weekday (Monday through Sunday) based on historical price data. It helps traders analyze which days tend to be bullish or bearish over a selected backtest date range.
✅ Features:
Customizable date range (From Year/Month/Day to To Year/Month/Day)
Calculates average % change for each weekday (Mon–Sun)
Supports assets that trade 7 days (e.g., crypto)
Color-coded outputs (green = positive, red = negative)
Final results shown as a table in the bottom-right corner
Works only on the 1D timeframe (daily)
🧠 How it works:
For each day within the selected date range:
The script calculates the % change as: (Close - Open) / Open * 100
Then, it groups the data by weekday and averages the values
This gives you insight into how each day of the week behaves historically for the current asset.
⚠️ Notes:
This script only works on daily (1D) timeframes.
For most accurate results, use it on assets with long trading history (e.g., BTCUSD).
Designed for educational and statistical analysis purposes.

Custom Daily Session Zones by KoenigseggCustom Daily Session Zones
🟣 Description
This indicator displays customizable trading session time zones as background highlights on your chart, on any timeframe you choose. The inline info tooltip provides the precise start and end times of the three largest market sessions—the US, the EU, and ASIA—for quick reference. It provides flexible control over session times for different days of the week, making it ideal for traders who need to visualize specific market hours or trading sessions.
🟣 Key Features
- Flexible Session Configuration: Set a common session time for all days or customize individual sessions for each day of the week
- Per-Day Control: Enable or disable sessions for specific days (Monday through Sunday)
- Color Customization: Choose unique colors for each day's session zones
- UTC Timezone Standard: All session times are defined in UTC to ensure consistency across charts
- Clean Visual Display: Non-intrusive background highlighting that doesn't interfere with price action
🟣 How to Use
- Common Session Mode: Use the default mode to apply the same session time across all enabled days
- Manual Per-Day Mode: Enable "Manual per-day sessions" to set different session times for each day
- Day Selection: Toggle individual days on/off based on your trading schedule
- Color Coding: Customize colors for each day to easily distinguish between different sessions
🟣 Technical Details
- Uses Pine Script v6 for optimal performance
- Implements proper session time detection using TradingView's built-in time functions
- Operates in UTC timezone for all session calculations
- Lightweight code that doesn't impact chart performance
🟣 Use Cases
- Highlight specific trading sessions (London, New York, Tokyo, etc.)
- Mark important market hours for your trading strategy
- Visualize different session overlaps
- Create custom trading time windows
- Track market activity during specific hours
🟣 Compatibility
- Works on all timeframes
- Compatible with all asset classes (Forex, Stocks, Crypto, Futures, etc.)
- Supports all TradingView chart types
- Responsive design that adapts to different screen sizes
🟣 Image Descriptions
- First Image (main image): Shows multiple New York Stock Exchange sessions from 1:30 p.m. to 8:00 p.m. (UTC), on the 15-minute timeframe, with each day’s zone colored differently to demonstrate the indicator’s customizable color settings.
- Second Image: A zoomed‑in fractal chart view of the same New York session on the 15-minute timeframe, illustrating how the background session zone appears even at higher detail levels.
Third Image: A close‑up of the New York session (1:30 p.m. to 8:00 p.m.) on the 3-minute timeframe, reaffirming the consistency of zone highlighting across different zoom levels.
🟣 Future Updates (v2)
In the next release, you’ll be able to define multiple session blocks per day—displaying two distinct colored zones within the same trading day. This will help you visualize when one market session ends and another begins without losing chart clarity.
🟣 Conclusion
This indicator is perfect for traders who need precise control over Market Session visualization and want to maintain a clean, professional chart appearance.
🟣 Disclaimer
This script is provided for educational and illustrative purposes only. It is not financial or trading advice, nor a recommendation to buy or sell any asset. Always conduct your own research and consult a professional before making any trading decisions.

Avg daily rangeThe Average Daily Range (ADR) is a technical indicator that measures the average price movement of a financial instrument over a specific period.

Previous Daily High/LowThe previous day’s high and low are critical price levels that traders use to identify potential support, resistance, and intraday trading opportunities. These levels represent the highest and lowest prices reached during the prior trading session and often act as reference points for future price action.
Why Are Previous Daily High/Low Important?
Support & Resistance Zones
The previous day’s low often acts as support (buyers defend this level).
The previous day’s high often acts as resistance (sellers defend this level).
Breakout Trading
A move above the previous high suggests bullish momentum.
A move below the previous low suggests bearish momentum.
Mean Reversion Trading
Traders fade moves toward these levels, expecting reversals.
Example: Buying near the previous low in an uptrend.
Institutional Order Flow
Market makers and algos often reference these levels for liquidity.
How to Use Previous Daily High/Low in Trading
1. Breakout Strategy
Long Entry: Price breaks & closes above previous high → bullish continuation.
Short Entry: Price breaks & closes below previous low → bearish continuation.
2. Reversal Strategy
Long at Previous Low: If price pulls back to the prior day’s low in an uptrend.
Short at Previous High: If price rallies to the prior day’s high in a downtrend.
3. Range-Bound Markets
Buy near previous low, sell near previous high if price oscillates between them.
Example Trade Setup
Scenario: Price opens near the previous day’s high.
Bullish Case: A breakout above it targets next resistance.
Bearish Case: Rejection at the high signals a pullback.

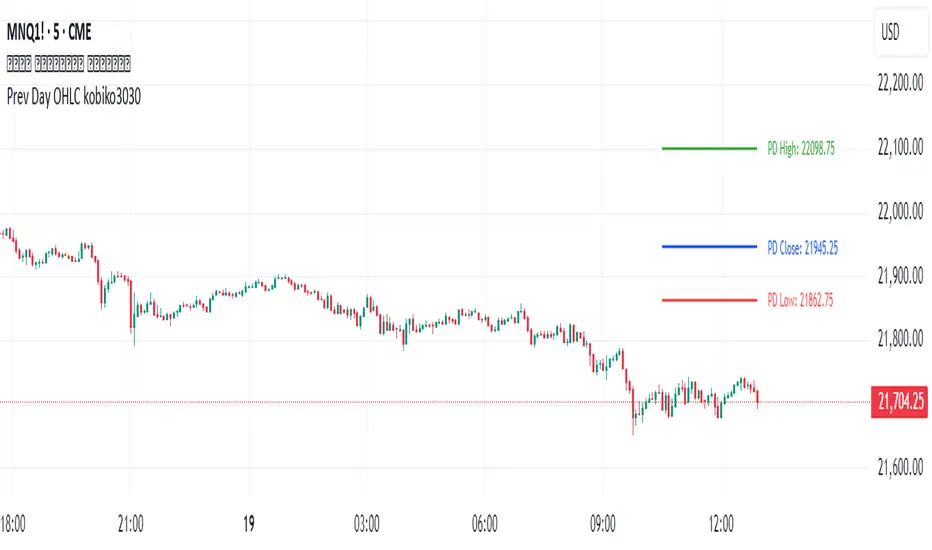
Previous Daily OHLCPrevious Daily OHLC Indicator
Overview:
This professional TradingView indicator displays the previous day's key price levels (Open, High, Low, Close, and 50% midpoint) as horizontal lines on your chart. These levels are essential for traders who use previous day data as support and resistance zones in their technical analysis.
What It Does
Displays Previous Day Levels: Automatically shows horizontal lines for yesterday's OHLC data
Real-Time Updates: Lines update dynamically each new trading day
Fully Customizable: Complete control over which levels to display and how they appear
Smart Line Management: Choose between showing lines for recent bars or across the entire chart
Professional Labels: Clear labels with optional price values for each level
Color Coded System: Distinct colors for each level type for instant recognition
Key Features
Five Important Price Levels
Previous Day Open: Yesterday's opening price - often acts as psychological level
Previous Day High: Yesterday's highest price - key resistance level for breakout trading
Previous Day Low: Yesterday's lowest price - important support level for breakdowns
Previous Day Close: Yesterday's closing price - significant reference point
50% Midpoint: Calculated midpoint between previous day's high and low - bias indicator