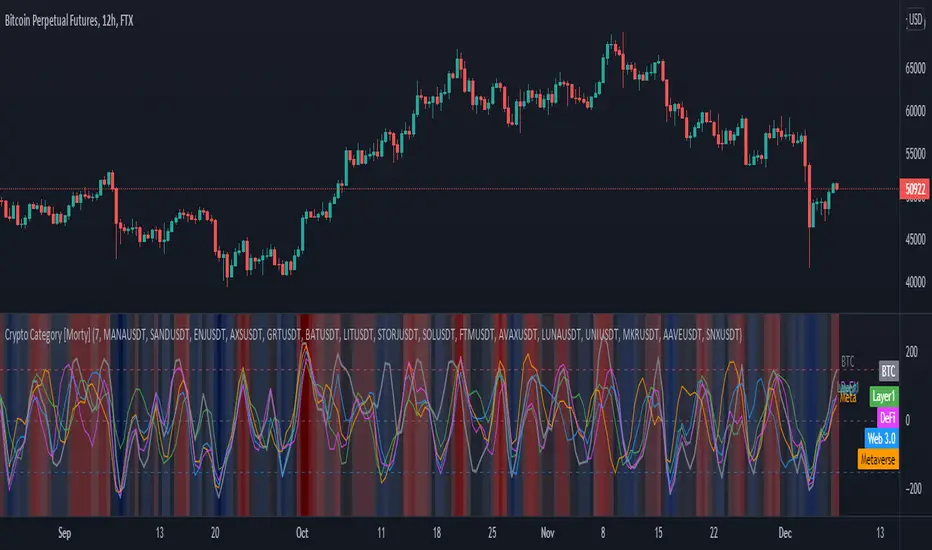
Crypto Category [Morty]This Crypto Category indicator shows an index oscillator for each cryptocurrency category.
Currently there are four categorys, include Metaverse, Web3, Layer1 and DeFi.
Each category index has four compoments and you can custom the input symbols.
The index is a Hull moving avarage of the compoments CCI. You can set the avarage period.
It also show a background heatmap based on the market sentiment which is calculated from the avarage of four indices.
ค้นหาในสคริปต์สำหรับ "crypto"
Crypto EMA Bands - Support and ResistanceEMA Bands for crypto markets shows support and resistance lines. Helps identify bull and bear market trends. SMA200 is white and turns yellow to signal pressure. Can also be useful for identifying Elliot waves and breakouts.

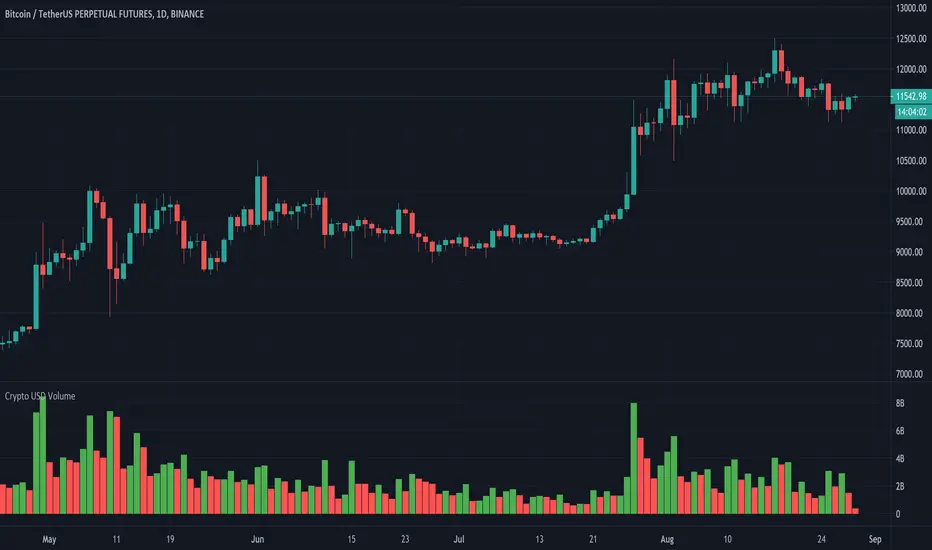
Crypto USD VolumeOften times I need to check the volume in cryptocurrency exchanges and I find myself checking which type of volume I am looking at, I need to manually make sense what the data is and converting it into USD volume which I end up going to CoinMarketCap website to verify whether my calculation is right.
Today I thought it was about time I created an automatic way to find the volume in USD Dollars. This is what this script does.
1 - It removes the base currency from the symbol (e.g., "BTCUSD", it would remove "BTC", leaving us with the "USD" part.). This is important because it helps us identify the currency the pair uses.
2 - It has different pair's variables, each is given a specific currency that the final volume is calculated from. (BTC, ETH, BNB and USD are the default currencies, for other ones, it must be added manually).
This works with all crypto symbols that include BTC, ETH, BNB and USD as currencies. If you modify it, please make sure to compare data with the exchange's one.
Crypto Market CorrelationThis script utilized some new functions in Pine Script, which compares the correlation between the current symbol to a basket of crypto indexes that are listed on the FTX exchange.
By tracking these indexes we can gauge the reaction across markets that have a different market cap. By that I mean we can have a better idea about where the money is flowing into a specific market.
This script uses data from FTX:BTCPERP, FTX:ALTPERP, FTX:MIDPERP, FTX:SHITPERP, FTX:EXCHPERP, FTX:DRGNPERP.
A value closer to 1 equals to more correlation, closer to 0 equals to less correlation.


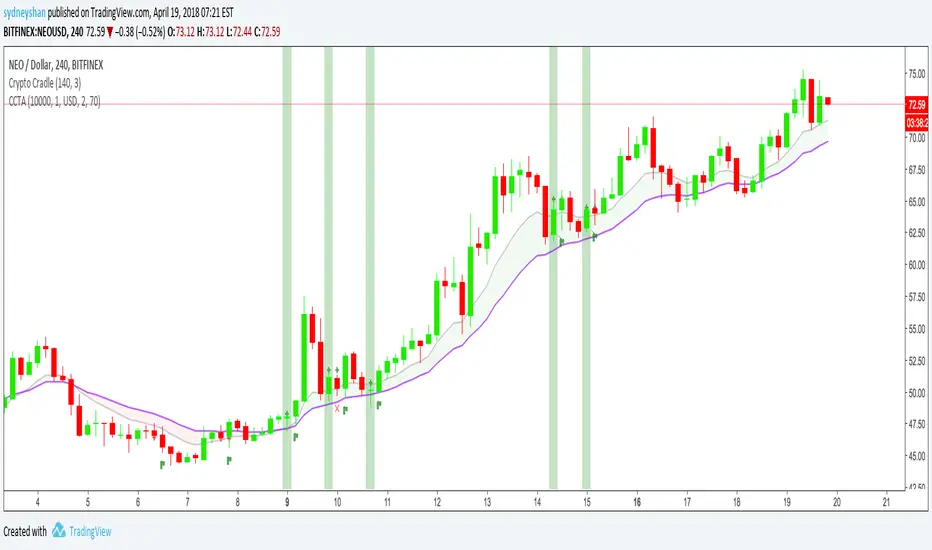
Crypto Cradle Trade AssistantThis indicator compliments the Crypto Cradle indicator by providing your entry, stop, 1:1 scale-out price, trade amount, and potential profit based on your target and scale-out strategy.
1. Ensure you have added the Crypto Cradle and Crypto Cradle Trade Assistant indicators to your chart
2. Click the cog icon to configure this indicator
3. Enter in your account balance and the % you are willing to risk on this trade (default: 1%).
3. Set your target price
4. Tweak the Trade Pair and Precision (Decimals) if required (USD/USDT only BTC & ETH coming soon)
5. Click on the 'Data Window' icon on the right-hand side of the screen and scroll down to CCTA
6. Hover over a highlighted crypto cradle candle (green for long, red for short) and a series of values will appear
Entry price
Stop price
1:1 scale out price
Amount to buy/sell (ie NEO)
Amount in traded currency (ie USD)
Target price (that you set)
Profit based on selling 50% of your bought amount when your reward equals your risk (1:1 scale-out)
Profit based on risking 1% of your portfolio
For more about the Crypto Cradle strategy, visit www.tradercobb.com
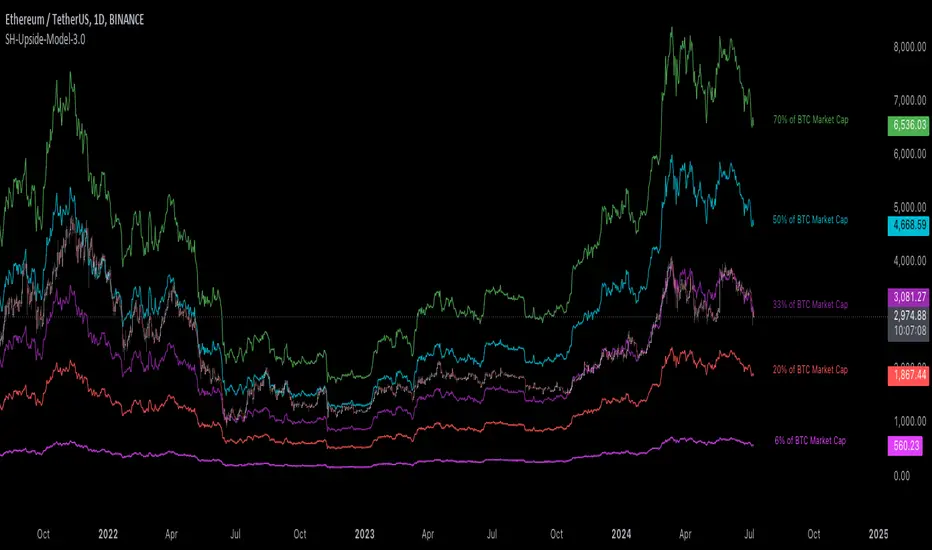
[Suitable Hope] Crypto Upside Model 3.0The "Crypto Upside Model 3.0" indicator dynamically calculates the potential price of any cryptocurrency based on various percentages of Ethereum or Bitcoin's market capitalization.
By fetching and analyzing marketcap data from TradingView sources, it allows traders to visualize potential price targets if their chosen cryptocurrency reaches specific market dominance levels. This tool is designed for daily timeframe analysis and can be used to set informed price expectations and strategic investment goals, providing valuable insights for long-term investment planning.
Why using the Crypto Upside Model 3.0?
Strategic Planning: Helps traders and investors set realistic price targets and investment goals by visualizing potential market cap scenarios.
Informed Decision-Making: Provides a data-driven approach to understanding how a cryptocurrency might perform relative to major assets like Bitcoin and Ethereum.
Customizable Analysis: Allows users to choose different comparison assets (ETH or BTC) and visualize various market cap dominance percentages, offering tailored insights.
Daily Timeframe Focus: Ideal for swing traders and long-term investors who operate on a daily analysis timeframe, providing relevant and actionable data.
Bull Markets: Identify potential price targets if your cryptocurrency's market cap increases significantly.
Bear Markets: Assess how much value could be retained relative to major cryptocurrencies.
Strategic Entry/Exit Points: Use the visualized targets to plan entry or exit points in your trading strategy.
Comparative Advantage
Dynamic Adaptation: Unlike fixed indicators, this tool adapts to any active chart, making it versatile for multiple cryptocurrencies.
Market Cap Insights: Provides a unique perspective by linking price targets to market cap dominance, a critical factor in the crypto market.
User Instructions
Setup: Add the " Upside Model 3.0" indicator to your TradingView chart.
Configuration: Use the input settings to select the comparison cryptocurrency (ETH or BTC) and enable the desired market cap percentage plots.
Analysis: The indicator will display potential price targets based on the selected market cap percentages, providing a visual guide for setting price expectations.
Limitations
Marketcap Data Availability: The indicator relies on marketcap data from TradingView, which may not be available for all cryptocurrencies. If the data is unavailable, the indicator will not function for that asset. This tool is more likely to work with older, established cryptocurrencies, as marketcap data for newer cryptocurrencies may not yet be available.
Daily Timeframe Restriction: The indicator is designed to work exclusively on the daily timeframe, limiting its applicability for intraday trading.
Assumptions of Market Dynamics: The calculations assume a direct correlation between market dominance and price, which may not account for other market dynamics and external factors influencing prices.
Data Accuracy: The accuracy of the indicator depends on the reliability of the data provided by TradingView, which may sometimes experience delays or inaccuracies.
Currently available cryptocurrencies: Bitcoin, Ethereum, Solana, Binance Coin, Cardano, Ripple, Polkadot, Avalanche, Chainlink, Litecoin, Dogecoin, Terra, Uniswap, VeChain, Stellar, Internet Computer, Hedera, Filecoin, Monero, Aave, TRON, NEAR Protocol, Compound, Maker,... For all compatible cryptocurrencies, please consult CRYPTOCAP's documentation.
Final notes
Although various sources ask a payment or user data for similar kind of private indicators, this one is entirely free and open source. "Uncanny" isn't it? I hope this indicator will provide you value. Feel free to leave a message if you have any questions or constructive feedback.
Examples of how I use this indicator
When using ETH's historical price as a reference compared to Bitcoin's marketcap, we can notice that price generally has been held between the +-30% and 50% lines of BTC's marketcap. If history is repeating again, we can expect major resistances around the 50% looking ahead into the future. This for me would be a great area to potentially reduce my ETH spot position.
When using SOL's historical price action, we can notice that the 15% line of ETH's marketcap has been a top in the previous cycle. Today SOL (July 2024), is back at this level. Could this be a top again or could price break this 15% level and head perhaps towards 30% which currently sits around $260? Time will tell.
These are 2 simple example of how I interpret the data. I'm keen to hear what other findings with other pairs you can find.
Cobra's CryptoMarket VisualizerCobra's Crypto Market Screener is designed to provide a comprehensive overview of the top 40 marketcap cryptocurrencies in a table\heatmap format. This indicator incorporates essential metrics such as Beta, Alpha, Sharpe Ratio, Sortino Ratio, Omega Ratio, Z-Score, and Average Daily Range (ADR). The table utilizes cell coloring resembling a heatmap, allowing for quick visual analysis and comparison of multiple cryptocurrencies.
The indicator also includes a shortened explanation tooltip of each metric when hovering over it's respected cell. I shall elaborate on each here for anyone interested.
Metric Descriptions:
1. Beta: measures the sensitivity of an asset's returns to the overall market returns. It indicates how much the asset's price is likely to move in relation to a benchmark index. A beta of 1 suggests the asset moves in line with the market, while a beta greater than 1 implies the asset is more volatile, and a beta less than 1 suggests lower volatility.
2. Alpha: is a measure of the excess return generated by an investment compared to its expected return, given its risk (as indicated by its beta). It assesses the performance of an investment after adjusting for market risk. Positive alpha indicates outperformance, while negative alpha suggests underperformance.
3. Sharpe Ratio: measures the risk-adjusted return of an investment or portfolio. It evaluates the excess return earned per unit of risk taken. A higher Sharpe ratio indicates better risk-adjusted performance, as it reflects a higher return for each unit of volatility or risk.
4. Sortino Ratio: is a risk-adjusted measure similar to the Sharpe ratio but focuses only on downside risk. It considers the excess return per unit of downside volatility. The Sortino ratio emphasizes the risk associated with below-target returns and is particularly useful for assessing investments with asymmetric risk profiles.
5. Omega Ratio: measures the ratio of the cumulative average positive returns to the cumulative average negative returns. It assesses the reward-to-risk ratio by considering both upside and downside performance. A higher Omega ratio indicates a higher reward relative to the risk taken.
6. Z-Score: is a statistical measure that represents the number of standard deviations a data point is from the mean of a dataset. In finance, the Z-score is commonly used to assess the financial health or risk of a company. It quantifies the distance of a company's financial ratios from the average and provides insight into its relative position.
7. Average Daily Range: ADR represents the average range of price movement of an asset during a trading day. It measures the average difference between the high and low prices over a specific period. Traders use ADR to gauge the potential price range within which an asset might fluctuate during a typical trading session.
Utility:
Comprehensive Overview: The indicator allows for monitoring up to 40 cryptocurrencies simultaneously, providing a consolidated view of essential metrics in a single table.
Efficient Comparison: The heatmap-like coloring of the cells enables easy visual comparison of different cryptocurrencies, helping identify relative strengths and weaknesses.
Risk Assessment: Metrics such as Beta, Alpha, Sharpe Ratio, Sortino Ratio, and Omega Ratio offer insights into the risk associated with each cryptocurrency, aiding risk assessment and portfolio management decisions.
Performance Evaluation: The Alpha, Sharpe Ratio, and Sortino Ratio provide measures of a cryptocurrency's performance adjusted for risk. This helps assess investment performance over time and across different assets.
Market Analysis: By considering the Z-Score and Average Daily Range (ADR), traders can evaluate the financial health and potential price volatility of cryptocurrencies, aiding in trade selection and risk management.
Features:
Reference period optimization, alpha and ADR in particular
Source calculation
Table sizing and positioning options to fit the user's screen size.
Tooltips
Important Notes -
1. The Sharpe, Sortino and Omega ratios cell coloring threshold might be subjective, I did the best I can to gauge the median value of each to provide more accurate coloring sentiment, it may change in the future.
The median values are : Sharpe -1, Sortino - 1.5, Omega - 20.
2. Limitations - Some cryptos have a Z-Score value of NaN due to their short lifetime, I tried to overcome this issue as with the rest of the metrics as best I can. Moreover, it limits the time horizon for replay mode to somewhere around Q3 of 2021 and that's with using the split option of the top half, to remain with the older cryptos.
3. For the beginner Pine enthusiasts, I recommend scimming through the script as it serves as a prime example of using key features, to name a few : Arrays, User Defined Functions, User Defined Types, For loops, Switches and Tables.
4. Beta and Alpha's benchmark instrument is BTC, due to cryptos volatility I saw no reason to use SPY or any other asset for that matter.

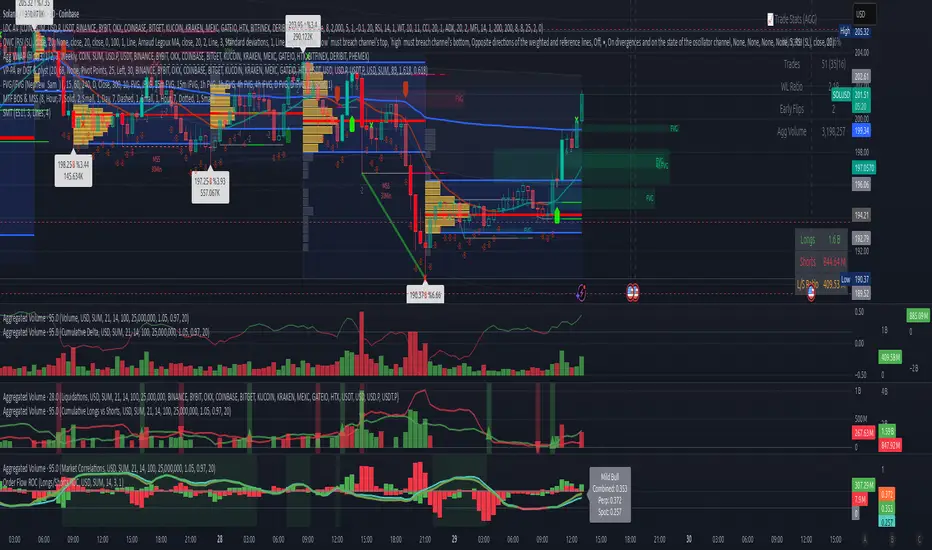
Volume Aggregated Spot & Futures -- Crypto (by plyst & more)📊 Volume Aggregated Spot & Futures - Enhanced Edition
🎯 Overview
Advanced volume aggregation indicator that combines spot and perpetual futures volume across the top 10 cryptocurrency exchanges. This enhanced version builds upon the original work by @HALDRO Project with optimized calculations and expanded functionality.
✨ Key Features
- 📈 Real-time aggregated volume from 10 major exchanges (Binance, Bybit, OKX, Coinbase, Bitget, KuCoin, Kraken, MEXC, Gate.io, HTX)
- 🔄 Multiple visualization modes: Volume, Delta, Cumulative Delta, Spot vs Perp analysis, Liquidations, OBV, and MFI
- 💱 Multi-currency support: Display volume in COIN, USD, or EUR
- 🎨 Clean, single-color bar chart showing total cumulative volume
- 📊 Multiple calculation methods: SUM, AVG, MEDIAN, VARIANCE
- 🎯 Separate spot (USDT, USD, USDC, etc.) and perpetual futures (.P contracts) tracking
🔧 Technical Improvements
✓ Corrected MFI formula for accurate money flow calculations
✓ Optimized volume aggregation logic with proper NA handling
✓ Support for 10 exchanges (up from 9)
✓ Streamlined codebase for better performance
✓ Updated perpetual contract naming conventions (.P format)
📖 Usage
Perfect for analyzing total market volume, identifying liquidation events, tracking buyer/seller pressure through delta analysis, and understanding the spot vs futures market dynamics.
🙏 Credits
Original concept and framework by @HALDRO Project. This version includes mathematical corrections, code optimizations, and expanded exchange support.
⚠️ Note
Aggregated volume is calculated from external exchange data using request.security(). Ensure your plan supports the necessary security calls for optimal performance.
Multi-Exchange VWAP Aggregator (Crypto)Description:
This advanced VWAP indicator aggregates volume data from up to 9 cryptocurrency exchanges simultaneously, providing a more accurate volume-weighted average price than single-exchange VWAP calculations.
Key Features:
Multi-Exchange Aggregation - Combines volume from Binance, Coinbase, Bybit, Bitfinex, Bitstamp, Deribit, OKEx, Phemex, and FTX
Flexible Currency Pairs - Supports both spot (USD, USDT, EUR, USDC, BUSD, DAI) and perpetual futures contracts
Standard Deviation Bands - Includes customizable 1σ, 2σ, and 3σ bands for identifying overbought/oversold levels
Multiple Reset Periods - Daily, Weekly, Monthly, or Session-based VWAP calculations
Volume Calculation Options - Choose between SUM, AVG, MEDIAN, or VARIANCE for volume aggregation
Why Use This?
Traditional VWAP indicators only use volume from a single exchange, which can be misleading in fragmented crypto markets. This indicator provides a comprehensive market-wide VWAP by aggregating volume across major exchanges, giving you a more reliable benchmark for entries, exits, and institutional price levels.
Perfect for traders who want to see where the real volume-weighted price sits across the entire crypto market, not just one exchange.

Top Crypto Above 28-Day AverageDescription
The “Top Crypto Above 28-Day Average” (CRYPTOTW) script scans a selectable universe of up to 120 top-capitalization cryptocurrencies (divided into customizable 40-symbol batches), then plots the count of those trading above their own 28-period simple moving average. It helps you gauge broad market strength and identify which tokens are showing momentum relative to their recent trend.
Key Features
• Batch Selection: Choose among “Top40,” “Mid40,” or “Low40” market-cap groups, or set a custom batch size (up to 40 symbols) to keep within the API limit.
• Dynamic Plot: Displays a live line chart of how many cryptos are above their 28-day MA on each bar.
• Reference Lines: Automatic horizontal lines at 25%, 50%, and 75% of your batch to provide quick visual thresholds.
• Background Coloration: The chart background shifts green/yellow/red based on whether more than 70%, 50–70%, or under 50% of the batch is above the MA.
• Optional Table: On the final bar, show a sortable table of up to 28 tickers currently above their 28-day MA, including current price, percent above MA, and “Above” status color-coding.
• Alerts:
• Strong Batch Performance: Fires when >70% of the batch is above the MA.
• Weak Batch Performance: Fires when <10 cryptos (i.e. <25%) are above the MA.
Inputs
• Show Results Table (show_table): Toggle the detailed table on/off.
• Table Position (table_position): Select one of the four corners for your table overlay.
• Max Cryptos to Display (max_display): Limit the number of rows in the results table.
• Current Batch (current_batch): Pick “Top40,” “Mid40,” or “Low40.”
• Batch Size (batch_size): Define the number of symbols (1–40) you want to include from the chosen batch.
How to Use
1. Add the CRYPTOTW indicator to any chart.
2. Select your batch and size to focus on the segment of the crypto market you follow.
3. Watch the plotted line to see the proportion of tokens with bullish momentum.
4. (Optional) Enable the results table to see exactly which tokens are outperforming their 28-day average.
5. Set alerts to be notified when the batch either overheats (strong performance) or cools off significantly.
Why It Matters
By tracking the share of assets riding their 28-day trend, you gain a macro-level view of market breadth—crucial for spotting emerging rallies or early signs of broad weakness. Whether you’re swing-trading individual altcoins or assessing overall market mood, this tool distills complex data into an intuitive, actionable signal.

Crypto Notes Scalping Indicator by Mohsin
**Crypto Notes Indicator**
This custom trading indicator, named "Crypto Notes," is designed to assist traders in analyzing cryptocurrency price movements. It combines two key components: the SSL (Stochastic Support and Resistance) channel and a Moving Average.
**Indicator Components:**
1. **SSL Channel:**
- The SSL channel is a technical analysis tool that helps identify potential support and resistance levels in the cryptocurrency price chart.
- The indicator calculates two values: `sslDown` and `sslUp`, which represent potential support and resistance levels, respectively.
- The SSL channel is based on a user-defined period and length, allowing traders to customize the sensitivity of the support and resistance levels.
2. **Buy and Sell Signals:**
- Buy and sell signals are generated when the `sslUp` crosses above `sslDown` (a buy signal) or when `sslUp` crosses below `sslDown` (a sell signal).
- These signals help traders identify potential entry and exit points for their cryptocurrency trades.
3. **Moving Average (MA1):**
- The indicator also includes a customizable exponential moving average (EMA) with a length defined by the user.
- This moving average (MA1) can be used to smooth out price data and identify trends in the cryptocurrency's price movement.
**How to Use:**
1. **SSL Channel:** The SSL channel visually represents potential support and resistance levels on the price chart. Traders can observe price behavior concerning these levels to make trading decisions.
2. **Buy Signals:** Buy signals are labeled as "BUY" on the chart when `sslUp` crosses above `sslDown`. This is an indication of a potential bullish trend or an opportune time to enter a long position.
3. **Sell Signals:** Sell signals are labeled as "SELL" on the chart when `sslUp` crosses below `sslDown`. This suggests a potential bearish trend or an opportune time to exit a long position or consider shorting.
4. **Moving Average (MA1):** The customizable moving average (MA1) can help traders identify trends in the cryptocurrency's price movement. When MA1 is above the price, it may suggest an uptrend, and when it's below, it may suggest a downtrend.
**Customization:**
- Traders can adjust the indicator's parameters, such as the SSL channel period, length, and the length of the EMA (MA1), to suit their specific trading strategies and preferences.
**Disclaimer:** This indicator is a tool for technical analysis and does not provide financial advice. Trading cryptocurrencies involves risks, and users should conduct thorough research and risk management before making any trading decisions.
**Note:** It's essential to thoroughly test this indicator and incorporate it into a comprehensive trading strategy before using it for actual trading.
---
Please ensure you understand the indicator's functionality and consider using it alongside other tools and analysis methods as part of your trading strategy.

[DS]Bitcoin BTC ETH and others cryptos==DESCRIPTION - English version
The purpose of this script is to show information on graph that can help your decision to buy and sell cryptos.
The script is indicated for Position Trade (Long Term - Holder) and Swing Trade (Medium term).
Position Trade it is recommended to use the Weekly (W) and Daily (D) charts, Swing trade to use the 4H and 2H charts.
It is not advisable to use this indicator with graphic time frame less than 2 hours because the noise levels of information are very high.
An alert function has been inserted in the indicator and to activate this function you will need configure it in the Tradingview.
This alert will indicate the likely points of entry and exit of the asset.
**DESCRIÇÃO - Versão em Português
A proposta deste script é mostrar no gráfico informações que possam auxiliar a sua decisão de compra e venda de cryptos.
Este script é indicado para negociação Position Trade (Longo Prazo - Holders) e Swing Trade (Médio prazo).
Para Position Trade (Holders) é indicado utilizar os gráficos Semanal (W) e Diário (D), para Swing trade utilizar os gráficos 4H e 2H.
Não é aconselhável utilizar este indicador com tempos gráficos menores que 2hs pois os níveis de ruídos nas informação são muito altos.
Foi inserido no indicador uma função de alerta e para ativar esta função, você precisará configurá-la no seu Tradingview.
Este alerta irá indicar os provaveis pontos de entrada e saída do ativo.
====================================================================================================
** English Version
====================================================================================================
█ SETUP applied to Indicator
The setup is based on the average 8, 21 and 56 of the weekly chart (taught on youtube channel: Augusto Backes)
Price above the average 8 on the weekly, indicates that the market is UP trend, below the average 8 on the weekly that the market is DOWN trend
RSI greater than 60% the market is UP trend
RSI greater than 40% and lower 60% the market is in ACCUMULATION
RSI less than 40% the market DOWN trend
The weekly average 8 is represented in GREEN (Upward Trend) and RED (Downward Trend).
The weekly average 21 is represented in LIGHT ORANGE
The weekly average 56 is represented in LIGHT PURPLE
The crossing of weekly averages 8 and 21 is represented with a GREEN (HIGH trend) and RED (LOW trend) cross - this signal is disabled on the graph but you can enable it by clicking on the graph setup
█ FUNCTION USE
(1) Average 8, 21 and 56 on Weekly - show the average 8, 21, 56 weekly on graphic (Average 8 in color red and green, 21 - light orange, 56 light purple)
(2) Crossing of averages 8 and 21 Weekly - is not active but you can activate
(3) Calculation of RSI
(4) barcolor() - mark the candles with the green color (High market) and red color (Dow market)
(5) alertcondition() - you can active this alert on Tadingview
█ BUY AND SELL POINTS - likely points
The indication of the BUY position is shown by a green arrow pointing upwards and the sell position by a red arrow pointing downwards. Buy and sell indications are obtained from the divergence in the market trend.
█ THANK TO
PineCoders for everything they do, all the tools and help they provide, and their involvement in making a better community. All PineCoders, Pine Pros and Pine Wizards, people who share their work and knowledge because of it and helping others, I am so happy and so grateful.
█ NOTE
This indicator is not a buy and sell recommendation, it indicates the most likely buy and sell points. Every purchase and sale decision is your responsibility
*****************************************************************************************************
** Versão em Português
*****************************************************************************************************
█ SETUP aplicado no Indicador
O setup está baseado na média 8, 21, e 56 do gráfico semanal
Preço acima da média 8 no semanal indica que o mercado esta em tendência de ALTA, abaixo da média 8 no semanal que o mercado está em tendência de BAIXA
RSI maior que 60% o mercado está em ALTA
RSI maior que 40% e menor 60% o mercado está em ACUMULAÇÃO
RSI menor que 40% o mercado está em BAIXA
A média 8 semanal está representadas nas cores VERDE (Tendência de Alta) e VERMELHA (Tendência de Baixa).
A média 21 semanal está representada na cor laranja claro
A média 56 semanal está representada na cor roxa claro
O cruzamento das médias 8 e 21 semanal esta representado com uma cruz VERDE (Tendência de ALTA) e VERMELHA (Tendência de BAIXA) - este sinal esta desativado no gráfico mas você pode ativá-lo clicando no setup do gráfico
█ FUNÇÕES UTILIZADAS
(1) Média 8, 21 e 56 no Semanal - mostra a média 8, 21, e 56 no gráfico
(2) Cruzamento das médias 8 e 21 Semanal - não está ativo mas você pode ativá-lo
(3) Cálculo do RSI
(4) barcolor() - marca a vela (Candle) com a cor verde (Mercado em Alta) e a cor vermelha (Mercado em Baixa)
(5) alertcondition () - você pode ativar o alerta no Tradingview
█ PONTOS DE COMPRA E VENDA - prováveis pontos
A indicação da posição de COMPRA é apresentada por uma seta na cor verde apontada para cima e a posição de VENDA por uma seta na cor vermelha apontada para baixo. As indicações de compra e venda são obtidas a partir da divergência na tendência do mercado.
█ OBRIGADO PARA
PineCoders por tudo o que fazem, todas as ferramentas e ajuda que fornecem, e seu envolvimento em fazer uma comunidade melhor. Todos os PineCoders, Pine Pros e Pine Wizards, pessoas que compartilham seu trabalho e conhecimento por causa dele e ajudando os outros, estou muito feliz e muito grato.
█ NOTA
Este indicador não é uma recomendação de compra e venda ele indica os pontos mais prováveis de compra e venda. Toda decisão de compra e venda é de sua responsabilidade

Coin Prediction Filter - Free Cryptohopper WidgetWelcome to our Tradingview coin prediction filter.
We designed this script to give Cryptohopper users a possibility to decide which coins they want to trade. Because a basic rule says that you should never go against the trend. You can take the code and adjust it to your prefered trading pairs.
Smartgrow-Trading is a community project with the aim of developing the best and most successful trading strategies and sharing them with the community.
The basic idea of this script is to use a higher timeframe trend indicator and apply it on the top 40 coins. We recommend to use it within the 2h candles, but of cause you can use it in other timeframes as well. As result you receive a list of coins for the use within cryptohopper. Because, never trade against the trend.
If there are questions, write them into the comments or contact us directly over the direct message or social media. Happy Trading!

Hopper Trigger - Free Cryptohopper WidgetWelcome to our Tradingview cryptohopper trigger widget.
We designed this script to give Cryptohopper users the possibility to set up an alarm when btc is trending down. Cause of the BTCs behavior as the supertrend coin for the market it is better to turn your hopper off or be extremly careful when BTC is trending down. We implemented to types of alarms, because atm its not possible to automate using them to deactivate your hopper. On Alarm setup could be used to send signals every minute to trigger a push notification on your App or to trigger your Alexa. The other type of alarm only sends one single signal for normal purposes.
We recommend using this indicator in the 30 minute or 1 hour timeframe and to deactivate your hopper and deleting all positions when a alarm is signaling. The risk of a larger drop is very high in this marketphase. Never take an drop again using this approach. Little drawdown in bearish or ranging times but high reward in bullish times.
Smartgrow-Trading is a community project with the aim of developing the best and most successful trading strategies and sharing them with the community.
The basic idea of this script is to calculate how far an coin is away from its ATH , to gave warning signals for deactivating coins after they reached there ATH . So it could also be used for other coins and pairs.
If there are questions, write them into the comments or contact us directly over the direct message or social media. Happy Trading!

Heikin Ashi + Price Action Crypto LONG StrategyThis is a simple and efficient crypto strategy, designed for big timeframes like 12/24h.
On history it beats buy and hold strategy in many ocasions, and because of a low DD, pyramid can be used to elevate our winnings while still keeping a low DD < 40% avg.
For the purpose of this example, I used 100% of the capital on each trades, together with a comission of 0.1%
Warning : THERE IS NO STOP LOSS ON THIS STRATEGY ,USE IT AT YOUR OWN RISK
This strategy is made with inside Heikin Ashi candles , together with some price actions logics like for long Close > High and green candle and High > High .
We exit when we have a red candle and the current close is lower than the previous Low
If you have any questions, message me in private !

Crypto Options Confluence Overlay Crypto Options Confluence Overlay is a decision-first options framework designed to help crypto traders answer one core question clearly and consistently:
Should I trade CALLs, PUTs, or stand down today?
This indicator does not attempt to price options or replace Greeks. Instead, it focuses on timing, directional bias, and structured exits, using a confluence of price, volatility, momentum, and higher-timeframe context on the daily chart.
It is designed specifically for crypto options and perpetuals, where volatility is high and overstaying trades is often more dangerous than missing them.
What This Indicator Shows
1️⃣ Directional Bias (CALL / PUT / NO-TRADE)
CALL → bullish directional environment
PUT → bearish directional environment
NO-TRADE → mixed alignment (stand down)
This bias is derived from:
Mean trend alignment
Momentum structure (Stoch RSI behavior)
Volatility context (ATR + deviation bands)
Optional weekly directional filter
2️⃣ Timing Window
The indicator highlights whether a trade window is ACTIVE, BUILDING, or OFF.
ACTIVE → valid timing environment
BUILDING → momentum approaching, but not ready
OFF → no timing edge present
This prevents entering trades too early or after momentum has already passed.
3️⃣ Preferred Entry Zone (PEZ)
Shaded zones visually guide where entries are statistically cleaner, rather than chasing price.
Green PEZ → preferred CALL entry region
Red PEZ → preferred PUT entry region
These zones are informational — they help assess entry quality, not force entries.
4️⃣ Primary Exit (Early Profit Zone)
Instead of encouraging traders to hold for a full ATR move, the indicator introduces a Primary Exit, which represents a partial ATR objective.
This:
Reduces emotional decision-making
Encourages consistent profit capture
Aligns better with how options premiums often move
The Primary Exit is intentionally designed as a realistic exit, not a maximum move target.
5️⃣ ATR Target & Risk Context
For traders who want structure:
ATR Target → extended move reference
Band-based Risk Line → invalidation zone
These are context tools, not mandatory holds.
6️⃣ Confidence Score
Each trade environment is scored (e.g., 2/4, 3/4) based on alignment factors.
Higher scores indicate cleaner conditions, not guaranteed outcomes.
How to Use the Indicator (Model Trade Example)
Example: CALL Trade
Bias: CALL
Window: ACTIVE
Confidence: 3/4 or higher
Price Location: Inside or near GREEN PEZ
Entry: Near PEZ during the active window
Primary Exit: At the Primary Exit line
Optional Runner: Toward ATR target if momentum remains strong
Risk: Below the Band-1 risk line
If bias flips to NO-TRADE or PUT, the trade is considered invalid.
Example: PUT Trade
The same process applies in reverse:
Red PEZ
Downside Primary Exit
Risk above Band-1 high
What This Indicator Is — and Is Not
✔ Is
A structured decision engine
Designed for crypto options behavior
Focused on timing + exits
Effective for avoiding bad trades
✖ Is Not
A signal-only indicator
A replacement for position sizing
A guarantee of profit
A strategy that forces constant trading
Recommended Use
Daily timeframe
Liquid crypto pairs
Options or perpetual traders
Traders who value discipline over frequency
Final Note
This indicator will often say NO-TRADE — by design.
Standing down is considered a valid, successful outcome.

Crypto Anchored VWAP (Swing High/Low)Crypto Anchored VWAP (Swing High/Low)
This indicator provides an automatic Anchored VWAP system designed specifically for highly volatile assets such as cryptocurrencies (ETH, BTC, SOL, etc.).
Unlike traditional AVWAP tools that require manual date input, this script automatically anchors VWAP to the most recent swing high and swing low, making it ideal for real-time trend tracking and intraday/4H structure analysis.
How It Works
The script detects local swing lows and swing highs based on user-defined swing length.
When a new swing point appears, an Anchored VWAP is initialized from that specific candle.
As price evolves, the AVWAP dynamically becomes:
A trend boundary
A fair-value line
A mean-reversion attractor
Traders can use these levels to identify:
Trend continuation
Breakout confirmation
Mean reversion pullbacks
Overextended expansions
Included Features
✔ Auto-Anchored VWAP from swing low
✔ Auto-Anchored VWAP from swing high
✔ Standard deviation bands (1σ) for volatility context
✔ Designed for Crypto 4H / 1H / 15m
✔ Works on any asset & any timeframe
How To Use
1. Trend Direction
Price above Swing-Low VWAP → Bullish bias
Price below Swing-High VWAP → Bearish bias
2. Trade Setups
Break → Retest → Hold above AVWAP = Trend continuation long
Reject from AVWAP / σ band = Mean-reversion short setup
AVWAP zone → High probability liquidity reaction
3. Volatility Bands
Price touching +1σ = extension
Price returning to 0σ = mean reversion
Price breaking −1σ = trend weakening
Inputs
Swing Length: determines sensitivity of swing high/low detection
(Default: 5)
Best Use Cases
ETH 4H trend following
BTC structure shifts
Altcoin volatility filtering
Identifying institutional "cost basis" zones
Confirming breakouts / fakeouts
Notes
This is not a trading system by itself but a structural tool meant to help traders understand trend and value location. Always combine AVWAP with market structure, volume, and risk management.
Disclaimer
This script is for educational and informational purposes only. It does not constitute financial advice or a recommendation to buy or sell any asset. Use at your own discretion.

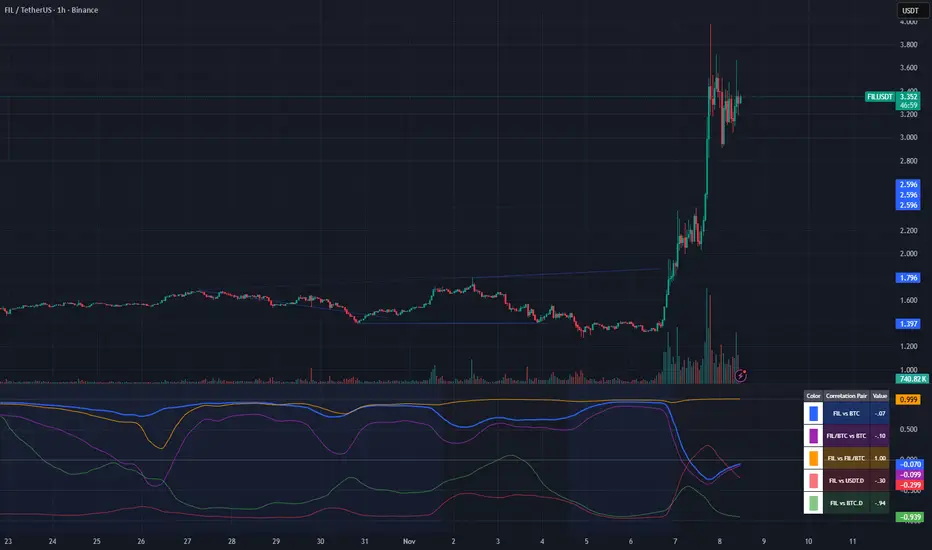
Crypto Correlation Oscillator# Crypto Correlation Oscillator
**Companion indicator for Tri-Align Crypto Trend**
## Overview
The Crypto Correlation Oscillator helps you identify **alpha opportunities** and **market regime changes** by showing how closely your coin follows Bitcoin and other assets over time. It displays rolling correlations as an oscillator in a separate pane below your price chart.
## What It Does
This indicator calculates **Pearson correlations** between different trading pairs on a rolling window (default: 100 bars). Correlations range from **-1.0** (perfect inverse relationship) to **+1.0** (perfect positive relationship), with **0** meaning no correlation.
### The 5 Correlation Lines
1. **Blue (thick line) - Coin vs BTC**: The most important metric
- **High correlation (>0.7)**: Your coin is just following BTC - no independent movement
- **Low correlation (<0.3)**: Your coin has **alpha** - it's moving independently from BTC
- **Negative correlation**: Your coin moves opposite to BTC (rare but powerful)
2. **Purple - Coin/BTC vs BTC**: Inverse relationship check
- **Negative values**: When BTC rises, your coin weakens relative to BTC
- **Positive values**: When BTC rises, your coin strengthens against BTC
3. **Orange - Coin vs Coin/BTC**: Structural consistency check
- Shows how well the Coin/USDT and Coin/BTC pairs maintain their mathematical relationship
- Unusual values can indicate liquidity issues or market inefficiencies
4. **Light Red - Coin vs USDT.D** (optional): Stablecoin dominance correlation
- Shows how your coin correlates with USDT dominance
- Useful for understanding flight-to-safety dynamics
5. **Light Green - Coin vs BTC.D** (optional): Bitcoin dominance correlation
- Shows how your coin correlates with BTC dominance
- Helps identify altcoin season vs BTC dominance cycles
## How to Read It
### Finding Alpha Opportunities
- **Low blue line (<0.3)**: Your coin is decoupled from BTC → potential alpha
- **Blue line dropping**: Coin is gaining independence from BTC
- **Blue line spiking to >0.9**: Coin is a "BTC clone" with no independent movement
### Regime Change Detection
- **Blue line crossing 0.5**: Major shift in correlation behavior
- **Purple line turning negative**: Coin starting to weaken when BTC rises (warning sign)
- **Sharp correlation changes**: Market structure is shifting - adjust strategy
### Visual Zones
- **Blue background**: High correlation zone (>0.7) - coin just following BTC
- **Red background**: Inverse correlation zone (<-0.5) - coin moving opposite to BTC
### Reference Lines
- **+1.0 / -1.0**: Perfect correlation boundaries (dotted gray)
- **+0.5 / -0.5**: Moderate correlation thresholds (dotted gray)
- **0.0**: Zero correlation line (solid gray)
## Dynamic Legend
The legend table (top-right) automatically shows the actual symbol names based on your chart:
- **Example on SOLUSDT**: Shows "SOL vs BTC", "SOL/BTC vs BTC", "SOL vs SOL/BTC", etc.
- **Color boxes**: Match the plot colors for easy identification
- **Live values**: Current correlation numbers update in real-time
- **Tooltips**: Hover over labels for interpretation guidance
## Configuration
### Key Inputs
- **Correlation Lookback** (default: 100): Number of bars for rolling correlation window
- Shorter = more reactive, noisier
- Longer = smoother, slower to detect changes
- **Correlation Smoothing** (default: 5): EMA smoothing period for raw correlations
- Reduces noise while preserving trends
- **Symbol Detection**: Auto-detects symbols from your chart, or use manual overrides
- **Dominance Pairs**: Toggle USDT.D and BTC.D correlations on/off
## Usage Tips
1. **Combine with main Tri-Align indicator**: Use correlation for context, Tri-Align for entry/exit signals
2. **Watch for divergences**: Correlation changing while price moves in sync can signal upcoming shift
3. **Adjust lookback period**: Use shorter (50-70) for day trading, longer (150-200) for position trading
4. **Focus on the blue line**: It's your primary alpha indicator
## Technical Details
- **Calculation**: Pearson correlation coefficient with EMA smoothing
- **Data source**: Close prices from `request.security()` (multi-timeframe capable)
- **Update frequency**: Every bar on your selected timeframe
- **Overlay**: False (displays in separate pane)
## Quick Interpretation Guide
| Blue Line Value | Interpretation | Action |
|----------------|----------------|--------|
| > 0.9 | Coin is a BTC clone | Avoid - no alpha opportunity |
| 0.7 - 0.9 | High correlation | Standard altcoin behavior |
| 0.3 - 0.7 | Moderate correlation | Some independence emerging |
| < 0.3 | Low correlation | **Strong alpha opportunity** |
| < 0 | Inverse correlation | Rare - potential hedge asset |
| Purple Line | Interpretation |
|-------------|----------------|
| Strongly negative | Coin weakens when BTC rises - risky |
| Near zero | Coin/BTC pair moves independently of BTC |
| Positive | Coin strengthens with BTC - ideal |
## Version History
### v1.0 (Initial Release)
- Pearson correlation calculation with configurable lookback
- 5 correlation pairs: Coin vs BTC, Coin/BTC vs BTC, Coin vs Coin/BTC, USDT.D, BTC.D
- EMA smoothing to reduce noise
- Visual zones for high/inverse correlation
- Dynamic legend with symbol name extraction
- Auto-symbol detection matching main Tri-Align indicator
Relative Crypto Dominance Polar Chart [LuxAlgo]The Relative Crypto Dominance Polar Chart tool allows traders to compare the relative dominance of up to ten different tickers in the form of a polar area chart, we define relative dominance as a combination between traded dollar volume and volatility, making it very easy to compare them at a glance.
🔶 USAGE
The use is quite simple, traders just have to load the indicator on the chart, and the graph showing the relative dominance will appear.
The 10 tickers loaded by default are the major cryptocurrencies by market cap, but traders can select any ticker in the settings panel.
Each area represents dominance as volatility (radius) by dollar volume (arc length); a larger area means greater dominance on that ticker.
🔹 Choosing Period
The tool supports up to five different periods
Hourly
Daily
Weekly
Monthly
Yearly
By default, the tool period is set on auto mode, which means that the tool will choose the period depending on the chart timeframe
timeframes up to 2m: Hourly
timeframes up to 15m: Daily
timeframes up to 1H: Weekly
timeframes up to 4H: Monthly
larger timeframes: Yearly
🔹 Sorting & Sizing
Traders can sort the graph areas by volatility (radius of each area) in ascending or descending order; by default, the tickers are sorted as they are in the settings panel.
The tool also allows you to adjust the width of the chart on a percentage basis, i.e., at 100% size, all the available width is used; if the graph is too wide, just decrease the graph size parameter in the settings panel.
🔹 Set your own style
The tool allows great customization from the settings panel, traders can enable/disable most of the components, and add a very nice touch with curved lines enabled for displaying the areas with a petal-like effect.
🔶 SETTINGS
Period: Select up to 5 different time periods from Hourly, Daily, Weekly, Monthly and Yearly. Enable/disable Auto mode.
Tickers: Enable/disable and select tickers and colors
🔹 Style
Graph Order: Select sort order
Graph Size: Select percentage of width used
Labels Size: Select size for ticker labels
Show Percent: Show dominance in % under each ticker
Curved Lines: Enable/disable petal-like effect for each area
Show Title: Enable/disable graph title
Show Mean: Enable/disable volatility average and select color

Open Interest (Multiple Exchanges for Crypto)On some cryptocurrencies and exchanges the OI data is nonexistent or deplorable. With this indicator you can see OI data from multiple exchanges (or just the best one) from USD,USDT, or USD+USDT pairs whether you are using a perpetuals chart or not.
Hope you all like it!
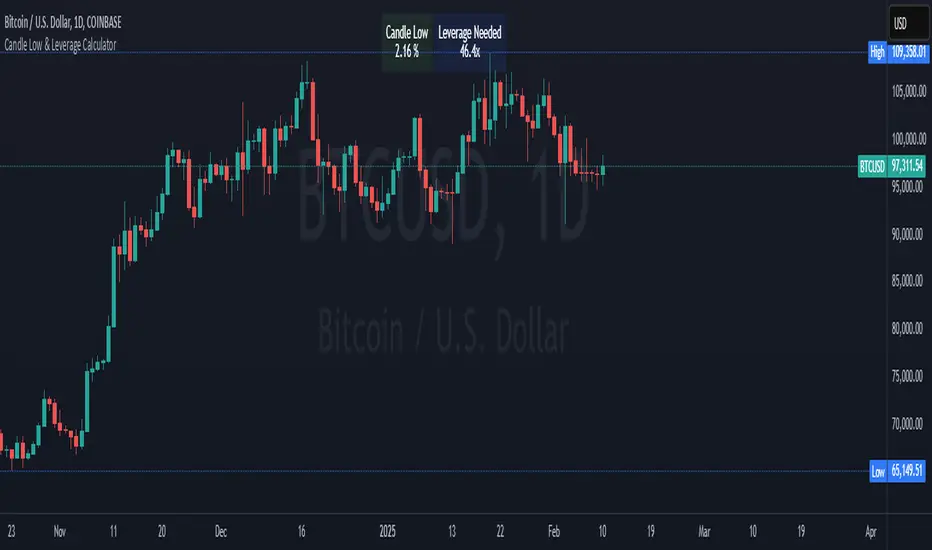
Crypto Candle Low Leverage TrackerCrypto Candle Low Leverage Tracker
The Candle Low Leverage Indicator is a powerful tool for long position traders seeking to manage risk effectively when using leverage. By evaluating the current candle's low price, this indicator helps traders make more informed decisions about potential entry points, stop losses, and leverage levels. The indicator matches the low of the candle to the leverage needed for liquidation, giving you a clear view of how leverage impacts your position.
This indicator provides two critical insights:
% from Candle Low: Tracks how much the price has moved from the low of the current candle. For long position traders, this percentage is crucial for understanding how far the price has come off the low and deciding whether it’s safe to enter a position or if further price action is needed.
Leverage Needed: Estimates the leverage required to reach the candle's low as the liquidation price. Long traders can use this information to adjust leverage to a safer level, ensuring they don’t overexpose themselves to liquidation risks by matching leverage to the candle’s low.
Key Features:
Customizable table positioning (top, middle, bottom).
Toggle options to show/hide % from Candle Low and Leverage Needed.
Visual indicators with color changes: green for positive change, red for negative change, and blue for leverage requirements.
Ideal for long traders, this tool helps evaluate market conditions, manage risks, and calculate the best leverage to use in long trades, ensuring that leverage aligns with the candle’s low to prevent unnecessary liquidations.