TT ToniTrading Adjustable Price Fee Band [%]Simple but perfectly functional indicator with Trading fee bands.
Crypto Trading is with fees and very small trades often don't make sense due to the fees we need to pay. With this band you can visualize your fees before entering a trade and take smarter decisions for tight daytrading and scalping.
You type in the fee for just one trade, the Taker Fee for a Market Order. The bands show the fees in % times 2, so what you will pay for opening and closing the trade in reality. The band therefore shows the real break-even point, with included payed fees.
It additionally helps taking trading decisions or not with very small trades (Scalping).
You can smooth the bands if you want and you can addtionally show the true datapoints if you prefer smoothend bands. I recommend no bigger smoothing than 2, if you don't want to show the datapoints. Additionally you can fill the band, and of course adjust transperency, colour and all the general TradingView stuff.
Fee Overview in the current market for the indicator input field:
BingX with 10% fee reduction code = 0,045 %
BingX: Normal = 0,050 %
Bitget, ByBit, BitUnix, Blofin, Phemex: Normal = 0,060 %
Bitget, ByBit, BitUnix, Blofin, Phemex: with 20% fee reduction code = 0,048 %
Have fun Trading, Happy Profits!
Greetings
ToniTrading
ค้นหาในสคริปต์สำหรับ "crypto"

Weekend Hunter Ultimate v6.2 Weekend Hunter Ultimate v6.2 - Automated Crypto Weekend Trading System
OVERVIEW:
Specialized trading strategy designed for cryptocurrency weekend markets (Saturday-Sunday) when institutional traders are typically offline and market dynamics differ significantly from weekdays. Optimized for 15-minute timeframe execution with multi-timeframe confluence analysis.
KEY FEATURES:
- Weekend-Only Trading: Automatically activates during configurable weekend hours
- Dynamic Leverage: 5-20x leverage adjusted based on market safety and signal confidence
- Multi-Timeframe Analysis: Combines 4H trend, 1H momentum, and 15M execution
- 10 Pre-configured Crypto Pairs: BTC, ETH, LINK, XRP, DOGE, SOL, AVAX, PEPE, TON, POL
- Position & Risk Management: Max 4 concurrent positions, -30% account protection
- Smart Trailing Stops: Protects profits when approaching targets
RISK MANAGEMENT:
- Maximum daily loss: 5% (configurable)
- Maximum weekend loss: 15% (configurable)
- Per-position risk: Capped at 120-156 USDT
- Emergency stops for flash crashes (8% moves)
- Consecutive loss protection (4 losses = pause)
TECHNICAL INDICATORS:
- CVD (Cumulative Volume Delta) divergence detection
- ATR-based dynamic stop loss and take profit
- RSI, MACD, Bollinger Bands confluence
- Volume surge confirmation (1.5x average)
- Weekend liquidity adjustments
INTEGRATION:
- Designed for Bybit Futures (0.075% taker fee)
- WunderTrading webhook compatibility via JSON alerts
- Minimum position size: 120 USDT (Bybit requirement)
- Initial capital: $500 recommended
TARGET METRICS:
- Win rate target: 65%
- Average win: 5.5%
- Average loss: 1.8%
- Risk-reward ratio: ~3:1
IMPORTANT DISCLAIMERS:
- Past performance does not guarantee future results
- Leveraged trading carries substantial risk of loss
- Weekend crypto markets have 13% of normal liquidity
- Not suitable for traders who cannot afford to lose their entire investment
- Requires continuous monitoring and adjustment
USAGE:
1. Apply to 15-minute charts only
2. Configure weekend hours for your timezone
3. Set up webhook alerts for automation
4. Monitor performance table in top-right corner
5. Adjust parameters based on your risk tolerance
This is an experimental strategy for educational purposes. Always test with small amounts first and never invest more than you can afford to lose completely.

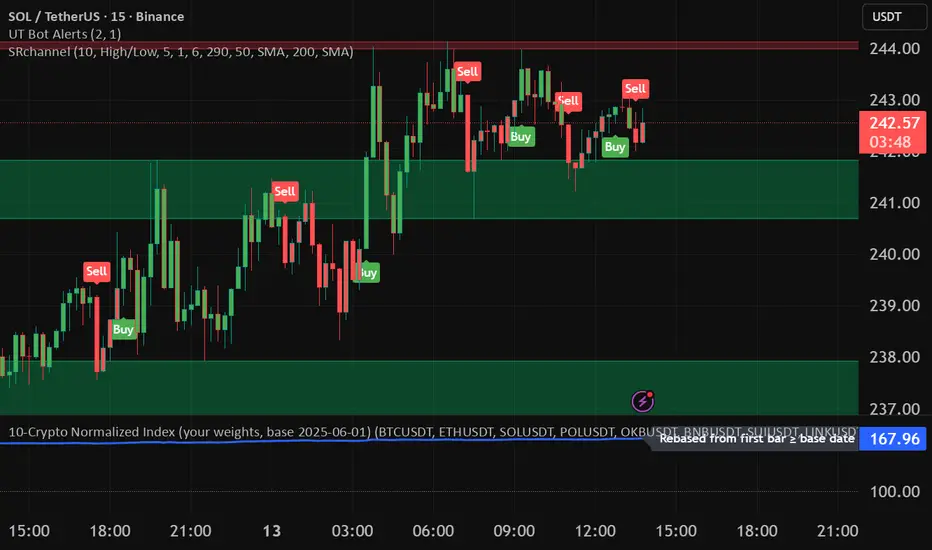
10-Crypto Normalized IndexOverview
This indicator builds a custom index for up to 10 cryptocurrencies and plots their combined trend as a single line. Each coin is normalized to 100 at a user-selected base date (or at its first available bar), then averaged (equally or by your custom weights). The result lets you see the market direction of your basket at a glance.
How it works
For each symbol, the script finds a base price (first bar ≥ the chosen base date; or the first bar in history if base-date normalization is off).
It converts the current price to a normalized value: price / base × 100.
It then computes a weighted average of those normalized values to form the index.
A dotted baseline at 100 marks the starting point; values above/below 100 represent % performance vs. the base.
Key inputs
Symbols (10 max): Default set: BTC, ETH, SOL, POL, OKB, BNB, SUI, LINK, 1INCH, TRX (USDT pairs). You can change exchange/quote (keep all the same quote, e.g., all USDT).
Weights: Toggle equal weights or enter custom weights. Custom weights are auto-normalized internally, so they don’t need to sum to 1.
Base date: Year/Month/Day (default: 2025-06-01). Turning normalization off uses each symbol’s first available bar as its base.
Smoothing: Optional SMA to reduce noise.
Show baseline: Toggle the horizontal line at 100.
Interpretation
Index > 100 and rising → your basket is up since the base date.
Index < 100 and falling → down since the base date.
Use shorter timeframes for intraday sentiment, higher timeframes for swing/trend context.
Default basket & weights (editable)
Order: BTC, ETH, SOL, POL, OKB, BNB, SUI, LINK, 1INCH, TRX.
Default custom weight factors: 30, 30, 20, 10, 10, 5, 5, 5, 5, 5 (auto-normalized).
Base date: 2025-06-01.
Hilly 3.0 Advanced Crypto Scalping Strategy - 1 & 5 Min ChartsHow to Use
Copy the Code: Copy the script above.
Paste in TradingView: Open TradingView, go to the Pine Editor (bottom of the chart), paste the code, and click “Add to Chart.”
Check for Errors: Verify no errors appear in the Pine Editor console. The script uses Pine Script v5 (@version=5).
Select Timeframe:
1-Minute Chart: Use defaults (emaFastLen=7, emaSlowLen=14, rsiLen=10, rsiOverbought=80, rsiOversold=20, slPerc=0.5, tpPerc=1.0, useCandlePatterns=false, patternLookback=10).
5-Minute Chart: Adjust to emaFastLen=9, emaSlowLen=21, rsiLen=14, rsiOverbought=75, rsiOversold=25, slPerc=0.8, tpPerc=1.5, useCandlePatterns=true, patternLookback=10.
Apply to Chart: Use a liquid crypto pair (e.g., BTC/USDT, ETH/USDT on Binance or Coinbase).
Verify Signals:
Green “BUY” or “EMA BUY” labels and triangle-up arrows below candles for bullish signals (EMA crossovers, bullish engulfing, hammer, doji, morning star, three white soldiers, double bottom).
Red “SELL” or “EMA SELL” labels and triangle-down arrows above candles for bearish signals (EMA crossovers, bearish engulfing, shooting star, doji, evening star, three black crows, double top).
Green/red background highlights for signal candles.
Backtest: Use TradingView’s Strategy Tester to evaluate performance over 1–3 months, checking Net Profit, Win Rate, and Drawdown.
Demo Test: Run on a demo account to confirm signal visibility and performance before trading with real funds.

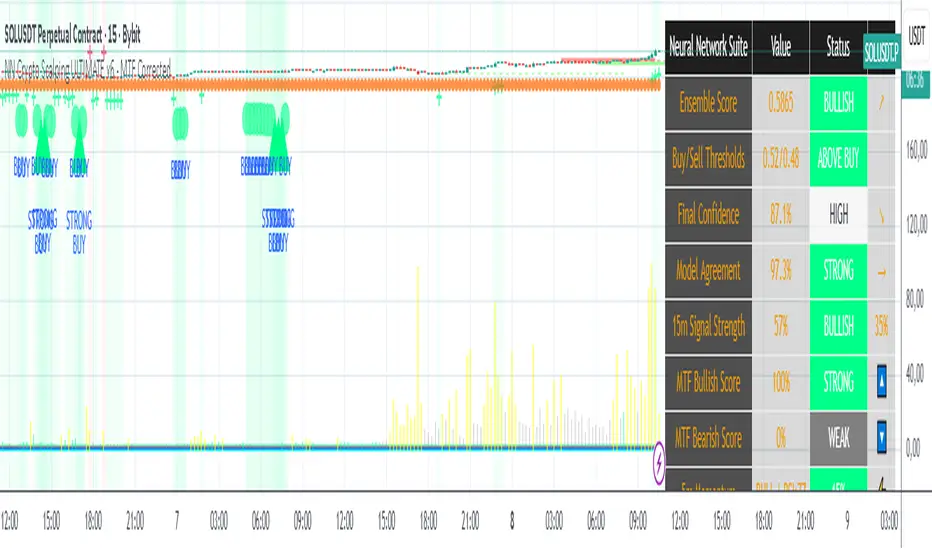
NN Crypto Scalping ULTIMATE v6 - MTF mapercivNeural Network Crypto Trading System v6.1
Complete Technical Documentation
Author
: Neural Network Ensemble Trading System
Version
: 6.1 - MTF Corrected & Bias Fixed
Date
: January 2025
Platform
: TradingView PineScript v6
Executive Summary
The
Neural Network Crypto Trading System v6.1
is an advanced algorithmic trading system that combines three specialized neural networks into an intelligent ensemble to generate cryptocurrency trading signals. The system integrates multi-timeframe analysis, crypto-specific optimizations, dynamic risk management, and continuous learning to maximize performance in highly volatile markets.
Key Features:
Ensemble of 3 specialized Neural Networks
(Primary, Momentum, Volatility)
Multi-Timeframe Analysis
with 5 timeframes (5m, 15m, 1h, 4h, 1D)
22 Advanced Features
for each model
Anti-repainting
guaranteed with confirmed data
8 Market Regime
automatic detections
6 Signal Levels
(Strong/Moderate/Weak Buy/Sell)
Professional dashboard
with 15+ real-time metrics
Intelligent alert system
with webhook integration
MS - Crypto RSI-Based Trading StrategyThis is a comprehensive trend-following and momentum-based strategy designed for the cryptocurrency market. It combines multiple leading indicators to filter out market noise and generate high-quality buy and sell signals.
Key Indicators:
Moving Average (MA): To determine the main trend direction.
Relative Strength Index (RSI): To measure momentum and identify overbought/oversold conditions.
Directional Movement Index (DMI): To confirm the strength of the trend.
Volume & ATR: To validate market interest and filter out excessive volatility.
Buy Conditions (All Must Be True):
Price and Trend Alignment: The current price is above the MA50 (with a 5% buffer).
Momentum Confirmation: The RSI is between 50 and 70.
Trend Strength: The +DI is greater than the -DI.
Market Interest: Volume is 1.5 times its moving average.
Low Volatility: The ATR is below its average.
Sell Conditions (Any One Is True):
Trend Reversal: The price drops below the MA50 (with a 5% buffer).
Momentum Loss: The RSI drops below 45.
Trend Weakness: The -DI crosses above the +DI.
Market Fatigue: Volume drops below 50% of its moving average.
High Volatility: The ATR is above its average.
Disclaimer: This is a backtesting tool and not financial advice. Past performance is not an indicator of future results. Always use proper risk management and conduct your own research before trading.

Trojan Cycle: Dip & Profit Hunter📉 Crypto is changing. Your signals should too.
This script doesn’t try to outguess price — it helps you track capital rotation and flow behavior in alignment with the evolving macro structure of the digital asset market.
Trojan Cycle: Dip & Profit Hunter is a signal engine built to support and validate the capital rotation models outlined in the Trojan Cycle and Synthetic Rotation theses — available via RWCS_LTD’s published charts
It is not a classic “buy low, sell high” tool. It is a structural filter that uses price/volume statistics to surface accumulation zones, synthetic traps, and macro context shifts — all aligned with the institutionalization of crypto post-2024.
🧠 Purpose & Value
Crypto no longer follows the retail-led, halving-driven pattern of 2017 or 2021.
Instead, institutional infrastructure, regulatory filters, and equity-market Trojan horses define the new path of capital.
This tool helps you visualize that path by interpreting behavior through statistical imbalances and real-time momentum signals.
Use it to:
Track where capital is accumulating or exiting
Identify signals consistent with true cycle rotation (vs. synthetic traps)
Validate your macro view with real-time statistical context
🔍 How It Works
The engine combines four signal layers:
1. Z-Score Logic
- Measures how far price and volume have deviated from their mean
- Detects dips, blowoffs, and exhaustion zones
2. Percentile Logic
- Compares current price and volume to historical rank distribution
- Flags statistically rare conditions (e.g. bottom 10% price, top 90% volume)
3. Combined Context Engine
- Integrates both models to generate one of 36 unique output states
- Each state provides a labeled market context (e.g., 🟢 Confluent Buy, 🔴 Confluent Sell, 🧨 Synthetic Trap )
4. Momentum Spread & Divergence
- Measures whether price is leading volume (trap risk) or volume is leading price (accumulation)
- Outputs intuitive momentum context with emoji-coded alerts
📋 What You See
🧠 Contextual Table UI with key Z-Scores, percentiles, signals, and market commentary
🎯 Emoji-coded signals to quickly grasp high-probability setups or risk zones
🌊 Optional overlays: price/volume divergence, momentum spread
🎨 Visual table customization (size, position) and chart highlights for signal clarity
🔔 Alert System
✅ Single dynamic alert using alert() that only fires when signal context changes
Prevents alert fatigue and allows clean webhook/automation integration
🧭 Use Cases
For macro cycle traders: Track where we are in the Trojan Cycle using statistical context
For thesis explorers: Use the 36-output signal map to match against your rotation thesis
For capital rotation watchers: Identify structural setups consistent with ETF-driven or compliance-filtered flow
For narrative skeptics: Avoid synthetic altseason traps where volume lags or flow dries up
🧪 Suggested Pairing for Thesis Validation
To use this tool as part of a thesis-confirmation framework , pair it with:
BTC.D — Bitcoin Dominance
ETH/BTC — Ethereum strength vs. Bitcoin
TOTALE100/ETH — Altcoin strength relative to ETH
RWCS_LTD’s published charts and macro cycle models
🏁 Final Note
Crypto has matured. So should your signals.
This tool doesn’t try to game the next 2 candles. It helps you understand the current phase in a compliance-filtered, institutionalized rotation model.
It’s not built for hype — it’s built for conviction.
Explore the thesis → Validate the structure → Trade with clarity.
🚨 Disclaimer
This script is not financial advice. It is an analytical tool designed to support market structure research and rotation thesis validation. Use this as part of a broader framework including technical structure, dominance charts, and macro data.

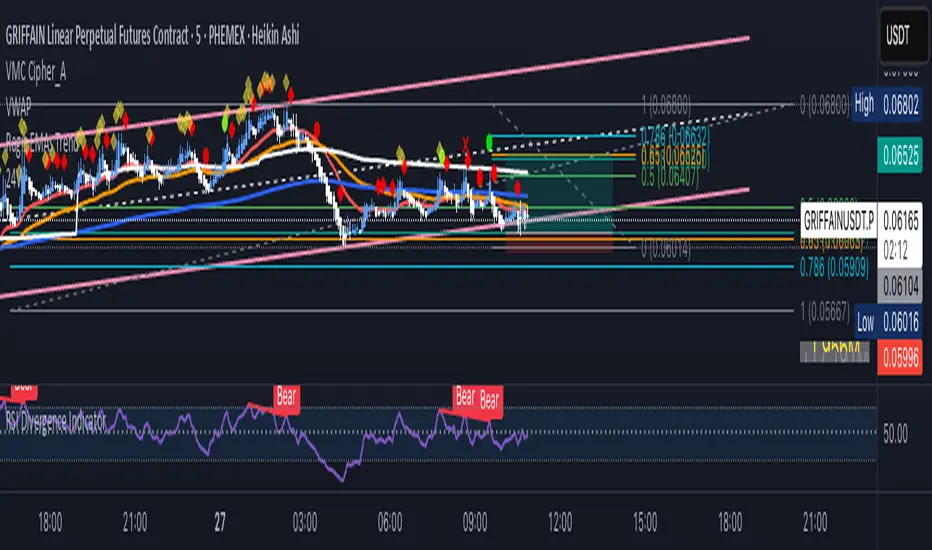
Mutanabby_AI | ATR+ | Trend-Following StrategyThis document presents the Mutanabby_AI | ATR+ Pine Script strategy, a systematic approach designed for trend identification and risk-managed position entry in financial markets. The strategy is engineered for long-only positions and integrates volatility-adjusted components to enhance signal robustness and trade management.
Strategic Design and Methodological Basis
The Mutanabby_AI | ATR+ strategy is constructed upon a foundation of established technical analysis principles, with a focus on objective signal generation and realistic trade execution.
Heikin Ashi for Trend Filtering: The core price data is processed via Heikin Ashi (HA) methodology to mitigate transient market noise and accentuate underlying trend direction. The script offers three distinct HA calculation modes, allowing for comparative analysis and validation:
Manual Calculation: Provides a transparent and deterministic computation of HA values.
ticker.heikinashi(): Utilizes TradingView's built-in function, employing confirmed historical bars to prevent repainting artifacts.
Regular Candles: Allows for direct comparison with standard OHLC price action.
This multi-methodological approach to trend smoothing is critical for robust signal generation.
Adaptive ATR Trailing Stop: A key component is the Average True Range (ATR)-based trailing stop. ATR serves as a dynamic measure of market volatility. The strategy incorporates user-defined parameters (
Key Value and ATR Period) to calibrate the sensitivity of this trailing stop, enabling adaptation to varying market volatility regimes. This mechanism is designed to provide a dynamic exit point, preserving capital and locking in gains as a trend progresses.
EMA Crossover for Signal Generation: Entry and exit signals are derived from the interaction between the Heikin Ashi derived price source and an Exponential Moving Average (EMA). A crossover event between these two components is utilized to objectively identify shifts in momentum, signaling potential long entry or exit points.
Rigorous Stop Loss Implementation: A critical feature for risk mitigation, the strategy includes an optional stop loss. This stop loss can be configured as a percentage or fixed point deviation from the entry price. Importantly, stop loss execution is based on real market prices, not the synthetic Heikin Ashi values. This design choice ensures that risk management is grounded in actual market liquidity and price levels, providing a more accurate representation of potential drawdowns during backtesting and live operation.
Backtesting Protocol: The strategy is configured for realistic backtesting, employing fill_orders_on_standard_ohlc=true to simulate order execution at standard OHLC prices. A configurable Date Filter is included to define specific historical periods for performance evaluation.
Data Visualization and Metrics: The script provides on-chart visual overlays for buy/sell signals, the ATR trailing stop, and the stop loss level. An integrated information table displays real-time strategy parameters, current position status, trend direction, and key price levels, facilitating immediate quantitative assessment.
Applicability
The Mutanabby_AI | ATR+ strategy is particularly suited for:
Cryptocurrency Markets: The inherent volatility of assets such as #Bitcoin and #Ethereum makes the ATR-based trailing stop a relevant tool for dynamic risk management.
Systematic Trend Following: Individuals employing systematic methodologies for trend capture will find the objective signal generation and rule-based execution aligned with their approach.
Pine Script Developers and Quants: The transparent code structure and emphasis on realistic backtesting provide a valuable framework for further analysis, modification, and integration into broader quantitative models.
Automated Trading Systems: The clear, deterministic entry and exit conditions facilitate integration into automated trading environments.
Implementation and Evaluation
To evaluate the Mutanabby_AI | ATR+ strategy, apply the script to your chosen chart on TradingView. Adjust the input parameters (Key Value, ATR Period, Heikin Ashi Method, Stop Loss Settings) to observe performance across various asset classes and timeframes. Comprehensive backtesting is recommended to assess the strategy's historical performance characteristics, including profitability, drawdown, and risk-adjusted returns.
I'd love to hear your thoughts, feedback, and any optimizations you discover! Drop a comment below, give it a like if you find it useful, and share your results.

8/30 SMA Pullback + ATR Exits (Crypto)A tryout using LLM to see if it can apply to bots using SMA pullbacks with ATR exits for crypto

FEDFUNDS Rate Divergence Oscillator [BackQuant]FEDFUNDS Rate Divergence Oscillator
1. Concept and Rationale
The United States Federal Funds Rate is the anchor around which global dollar liquidity and risk-free yield expectations revolve. When the Fed hikes, borrowing costs rise, liquidity tightens and most risk assets encounter head-winds. When it cuts, liquidity expands, speculative appetite often recovers. Bitcoin, a 24-hour permissionless asset sometimes described as “digital gold with venture-capital-like convexity,” is particularly sensitive to macro-liquidity swings.
The FED Divergence Oscillator quantifies the behavioural gap between short-term monetary policy (proxied by the effective Fed Funds Rate) and Bitcoin’s own percentage price change. By converting each series into identical rate-of-change units, subtracting them, then optionally smoothing the result, the script produces a single bounded-yet-dynamic line that tells you, at a glance, whether Bitcoin is outperforming or underperforming the policy backdrop—and by how much.
2. Data Pipeline
• Fed Funds Rate – Pulled directly from the FRED database via the ticker “FRED:FEDFUNDS,” sampled at daily frequency to synchronise with crypto closes.
• Bitcoin Price – By default the script forces a daily timeframe so that both series share time alignment, although you can disable that and plot the oscillator on intraday charts if you prefer.
• User Source Flexibility – The BTC series is not hard-wired; you can select any exchange-specific symbol or even swap BTC for another crypto or risk asset whose interaction with the Fed rate you wish to study.
3. Math under the Hood
(1) Rate of Change (ROC) – Both the Fed rate and BTC close are converted to percent return over a user-chosen lookback (default 30 bars). This means a cut from 5.25 percent to 5.00 percent feeds in as –4.76 percent, while a climb from 25 000 to 30 000 USD in BTC over the same window converts to +20 percent.
(2) Divergence Construction – The script subtracts the Fed ROC from the BTC ROC. Positive values show BTC appreciating faster than policy is tightening (or falling slower than the rate is cutting); negative values show the opposite.
(3) Optional Smoothing – Macro series are noisy. Toggle “Apply Smoothing” to calm the line with your preferred moving-average flavour: SMA, EMA, DEMA, TEMA, RMA, WMA or Hull. The default EMA-25 removes day-to-day whips while keeping turning points alive.
(4) Dynamic Colour Mapping – Rather than using a single hue, the oscillator line employs a gradient where deep greens represent strong bullish divergence and dark reds flag sharp bearish divergence. This heat-map approach lets you gauge intensity without squinting at numbers.
(5) Threshold Grid – Five horizontal guides create a structured regime map:
• Lower Extreme (–50 pct) and Upper Extreme (+50 pct) identify panic capitulations and euphoria blow-offs.
• Oversold (–20 pct) and Overbought (+20 pct) act as early warning alarms.
• Zero Line demarcates neutral alignment.
4. Chart Furniture and User Interface
• Oscillator fill with a secondary DEMA-30 “shader” offers depth perception: fat ribbons often precede high-volatility macro shifts.
• Optional bar-colouring paints candles green when the oscillator is above zero and red below, handy for visual correlation.
• Background tints when the line breaches extreme zones, making macro inflection weeks pop out in the replay bar.
• Everything—line width, thresholds, colours—can be customised so the indicator blends into any template.
5. Interpretation Guide
Macro Liquidity Pulse
• When the oscillator spends weeks above +20 while the Fed is still raising rates, Bitcoin is signalling liquidity tolerance or an anticipatory pivot view. That condition often marks the embryonic phase of major bull cycles (e.g., March 2020 rebound).
• Sustained prints below –20 while the Fed is already dovish indicate risk aversion or idiosyncratic crypto stress—think exchange scandals or broad flight to safety.
Regime Transition Signals
• Bullish cross through zero after a long sub-zero stint shows Bitcoin regaining upward escape velocity versus policy.
• Bearish cross under zero during a hiking cycle tells you monetary tightening has finally started to bite.
Momentum Exhaustion and Mean-Reversion
• Touches of +50 (or –50) come rarely; they are statistically stretched events. Fade strategies either taking profits or hedging have historically enjoyed positive expectancy.
• Inside-bar candlestick patterns or lower-timeframe bearish engulfings simultaneously with an extreme overbought print make high-probability short scalp setups, especially near weekly resistance. The same logic mirrors for oversold.
Pair Trading / Relative Value
• Combine the oscillator with spreads like BTC versus Nasdaq 100. When both the FED Divergence oscillator and the BTC–NDQ relative-strength line roll south together, the cross-asset confirmation amplifies conviction in a mean-reversion short.
• Swap BTC for miners, altcoins or high-beta equities to test who is the divergence leader.
Event-Driven Tactics
• FOMC days: plot the oscillator on an hourly chart (disable ‘Force Daily TF’). Watch for micro-structural spikes that resolve in the first hour after the statement; rapid flips across zero can front-run post-FOMC swings.
• CPI and NFP prints: extremes reached into the release often mean positioning is one-sided. A reversion toward neutral in the first 24 hours is common.
6. Alerts Suite
Pre-bundled conditions let you automate workflows:
• Bullish / Bearish zero crosses – queue spot or futures entries.
• Standard OB / OS – notify for first contact with actionable zones.
• Extreme OB / OS – prime time to review hedges, take profits or build contrarian swing positions.
7. Parameter Playground
• Shorten ROC Lookback to 14 for tactical traders; lengthen to 90 for macro investors.
• Raise extreme thresholds (for example ±80) when plotting on altcoins that exhibit higher volatility than BTC.
• Try HMA smoothing for responsive yet smooth curves on intraday charts.
• Colour-blind users can easily swap bull and bear palette selections for preferred contrasts.
8. Limitations and Best Practices
• The Fed Funds series is step-wise; it only changes on meeting days. Rapid BTC oscillations in between may dominate the calculation. Keep that perspective when interpreting very high-frequency signals.
• Divergence does not equal causation. Crypto-native catalysts (ETF approvals, hack headlines) can overwhelm macro links temporarily.
• Use in conjunction with classical confirmation tools—order-flow footprints, market-profile ledges, or simple price action to avoid “pure-indicator” traps.
9. Final Thoughts
The FEDFUNDS Rate Divergence Oscillator distills an entire macro narrative monetary policy versus risk sentiment into a single colourful heartbeat. It will not magically predict every pivot, yet it excels at framing market context, spotting stretches and timing regime changes. Treat it as a strategic compass rather than a tactical sniper scope, combine it with sound risk management and multi-factor confirmation, and you will possess a robust edge anchored in the world’s most influential interest-rate benchmark.
Trade consciously, stay adaptive, and let the policy-price tension guide your roadmap.

1EMA + 1MACD + 1RSI Crypto Strategy AB 092Title: EMA + MACD + RSI Crypto Strategy
Overview:
This is a trend-following and momentum-based crypto trading strategy built for 1H, 4H, and 1D timeframes, combining three proven indicators:
EMA 50 & EMA 200 Crossover – identifies long-term trend direction.
MACD Crossover (12, 26, 9) – confirms momentum shift.
RSI Filter (14) – avoids overbought/oversold traps and refines entries.
Buy Entry Conditions:
EMA 50 > EMA 200 (Golden Cross)
MACD line crosses above signal line
RSI is between 45 and 70
Sell Entry Conditions:
EMA 50 < EMA 200 (Death Cross)
MACD line crosses below signal line
RSI is between 30 and 55
Risk Management:
Configurable Take Profit and Stop Loss percentages via inputs.
Default: 3% TP, 1.5% SL (adjustable based on timeframe and asset volatility).
Best For:
Intraday trades on 1H (BTC, ETH, SOL)
Swing trades on 4H
Position entries on 1D (top 50 altcoins)
This script includes visual Buy/Sell signals, alert conditions, and customizable SL/TP logic — making it a clean, actionable, and reliable strategy for crypto traders.

Price Exhaustion Envelope [BackQuant]Price Exhaustion Envelope
Visual preview of the bands:
What it is
The Price Exhaustion Envelope (PEE) is a multi‑factor overextension detector wrapped inside a dynamic envelope framework. It measures how “tired” a move is by blending price stretch, volume surges, momentum and acceleration, plus optional RSI divergence. The result is a composite exhaustion score that drives both on‑chart signals and the adaptive width of three optional envelope bands around a smoothed baseline. When the score spikes above or below your chosen threshold, the script can flag exhaustion, paint candles, tint the background and fire alerts.
How it works under the hood
Exhaustion score
Price component: distance of close from its mean in standard deviation units.
Volume component: normalized volume pressure that highlights unusual participation.
Momentum component: rate of change and acceleration of price, scaled by their own volatility.
RSI divergence (optional): bullish and bearish divergences gently push the score lower or higher.
Mode control: choose Price, Volume, Momentum or Composite. Composite averages the main pieces for a balanced view.
Energy scale (0 to 100)
The composite score is pushed through a logistic transform to create an “energy” value. High energy (above 70 to 80) signals a move that may be running hot, while very low energy (below 20 to 30) points to exhaustion on the downside.
Envelope engine
Baseline: EMA of price over the main lookback length.
Width: base width is standard deviation times a multiplier.
Type selector:
• Static keeps the width fixed.
• Dynamic expands width in proportion to the absolute exhaustion score.
• Adaptive links width to the energy reading so bands breathe with market “heat.”
Smoothing: a short EMA on the width reduces jitter and keeps bands pleasant to trade around.
Band architecture
You can toggle up to three symmetric bands on each side of the baseline. They default to 1.0, 1.6 and 2.2 multiples of the smoothed width. Soft transparent fills create a layered thermograph of extension. The outermost band often maps to true blow‑off extremes.
On‑chart elements
Baseline line that flips color in real time depending on where price sits.
Up to three upper and lower bands with progressive opacity.
Triangle markers at fresh exhaustion triggers.
Tiny warning glyphs at extreme upper or lower breaches.
Optional bar coloring to visually tag exhausted candles.
Background halo when energy > 80 or < 20 for instant context.
A compact info table showing State, Score, Energy, Momentum score and where price sits inside the envelope (percent).
How to use it in trading
Mean reversion plays
When price pierces the outer band and an exhaustion marker prints, look for reversal candles or lower‑timeframe confirmation to fade the move back toward the baseline.
For conservative entries, wait for the composite score to roll back under the threshold or for energy to drop from extreme to neutral.
Set stops just beyond the extreme levels (use extreme_upper and extreme_lower as natural invalidation points). Targets can be the baseline or the opposite inner band.
Trend continuation with smart pullbacks
In strong trends, the first tag of Band 1 or Band 2 against the dominant direction often offers low‑risk continuation entries. Use energy readings: if energy is low on a pullback during an uptrend, a bounce is more likely.
Combine with RSI divergence: hidden bullish divergence near a lower band in an uptrend can be a powerful confirmation.
Breakout filtering
A breakout that occurs while the composite score is still moderate (not exhausted) has a higher chance of follow‑through. Skip signals when energy is already above 80 and price is punching the outer band, as the move may be late.
Watch env_position (Envelope %) in the table. Breakouts near 40 to 60 percent of the envelope are “healthy,” while those at 95 percent are stretched.
Scaling out and risk control
Use exhaustion alerts to trim positions into strength or weakness.
Trail stops just outside Band 2 or Band 3 to stay in trends while letting the envelope expand in volatile phases.
Multi‑timeframe confluence
Run the script on a higher timeframe to locate exhaustion context, then drill down to a lower timeframe for entries.
Opposite signals across timeframes (daily exhaustion vs. 5‑minute breakout) warn you to reduce size or tighten management.
Key inputs to experiment with
Lookback Period: larger values smooth the score and envelope, ideal for swing trading. Shorter values make it reactive for scalps.
Exhaustion Threshold: raise above 2.0 in choppy assets to cut noise, drop to 1.5 for smooth FX pairs.
Envelope Type: Dynamic is great for crypto spikes, Adaptive shines in stocks where volume and volatility wave together.
RSI Divergence: turn off if you prefer a pure price/volume model or if divergence floods the score in your asset.
Alert set included
Fresh upper exhaustion
Fresh lower exhaustion
Extreme upper breach
Extreme lower breach
RSI bearish divergence
RSI bullish divergence
Hook these to TradingView notifications so you get pinged the moment a move hits exhaustion.
Best practices
Always pair exhaustion signals with structure. Support and resistance, liquidity pools and session opens matter.
Avoid blindly shorting every upper signal in a roaring bull market. Let the envelope type help you filter.
Use the table to sanity‑check: a very high score but mid‑range env_position means the band may still be wide enough to absorb more movement.
Backtest threshold combinations on your instrument. Different tickers carry different volatility fingerprints.
Final note
Price Exhaustion Envelope is a flexible framework, not a turnkey system. It excels as a context layer that tells you when the crowd is pressing too hard or when a move still has fuel. Combine it with sound execution tactics, risk limits and market awareness. Trade safe and let the envelope breathe with the market.

SCPEM - Socionomic Crypto Peak Model (0-85 Scale)SCPEM Indicator Overview
The SCPEM (Socionomic Crypto Peak Evaluation Model) indicator is a TradingView tool designed to approximate cycle peaks in cryptocurrency markets using socionomic theory, which links market behavior to collective social mood. It generates a score from 0-85 (where 85 signals extreme euphoria and high reversal risk) and plots it as a blue line on the chart for visual backtesting and real-time analysis.
#### How It Works
The indicator uses technical proxies to estimate social mood factors, as Pine Script cannot fetch external data like sentiment indices or social media directly. It calculates a weighted composite score on each bar:
- Proxies derive from price, volume, and volatility data.
- The raw sum of factor scores (max ~28) is normalized to 0-85.
- The score updates historically for backtesting, showing mood progression over time.
- Alerts trigger if the score exceeds 60, indicating high peak probability.
Users can adjust inputs (e.g., lengths for RSI or pivots) to fine-tune for different assets or timeframes.
Metrics Used (Technical Proxies)
Crypto-Specific Sentiment
Approximated by RSI (overbought levels indicate greed).
Social Media Euphoria
Based on volume relative to its SMA (spikes suggest herding/FOMO).
Broader Social Mood Proxies
Derived from ATR volatility (high values signal uncertain/mixed mood).
Search and Cultural Interest Proxied by OBV trend (rising accumulation implies growing interest).
Socionomic Wildcard
Uses Bollinger Band width (expansion for positive mood, contraction for negative).
Elliott Wave Position
Counts recent price pivots (more swings indicate later wave stages and exhaustion).
Session Status Table📌 Session Status Table
Session Status Table is an indicator that displays the real-time status of the four major trading sessions:
* 🇯🇵 Asia (Tokyo)
* 🇬🇧 London
* 🇺🇸 New York AM
* 🇺🇸 New York PM
It shows which sessions are currently open, how much time remains until they open or close, and optionally sends alerts in advance.
🧩 Features:
* Real-time session table — shows the status of each session on the chart.
* Color-coded statuses:
* 🟢 Green – Session is open
* 🔴 Red – Session is closed
* ⚪ Gray – Weekend
* Countdown timers until session open or close.
* User alerts — receive a notification a custom number of minutes before a session starts.
⚙️ Customization:
* Table position — fully configurable.
* Session colors — customizable for open, closed, and weekend states.
* Session labels — customizable with icons.
* Notifications:
* Enabled through TradingView's Alerts panel.
* User-defined lead time before session opens.
🕒 Time Zones:
All times are calculated in UTC to ensure consistency across different markets and regions, avoiding discrepancies from time zones and daylight saving time.
🚨 How to enable alerts:
1. Open the "Alerts" panel in TradingView.
2. Click "Create Alert".
3. In the condition dropdown, choose "Session Status Table".
4. Set to any alert() trigger.
5. Save — you'll be notified a set number of minutes before each session begins.
ℹ️ Technical Notes:
* Built with Pine Script version 6.
* Logically divided into clear sections: inputs, session calculations, table rendering, and alerts.
* Optimized for performance and reliability on all timeframes.
Ideal for traders who use session activity in their strategies — especially in Forex, crypto, and futures markets.

PORTFOLIO TABLE Full [Titans_Invest]PORTFOLIO TABLE Full
This is a complete table for monitoring your assets or cryptocurrencies in your SPOT wallet without needing to access your broker’s website or app.
⯁ HOW TO USE THIS TABLE❓
Simply select the asset and enter the amount you hold.
The table will display the value of each asset and the total value of your portfolio.
You can monitor up to 19 assets in real time.
⯁ CONVERT VALUES
You can also enable and select a currency for conversion.
For example, cryptocurrencies are calculated in US dollars by default, but you can choose euros as the conversion currency.
The values originally in dollars will then be displayed in euros.
⯁ TRACK THE DAILY VARIATION OF YOUR PORTFOLIO
You’ll be able to monitor your portfolio’s raw daily variation in real time.
🔶 Track your Portfolio in real time:
🔶 Add your local Currency to Convert Values:
🔶 Follow your Portfolio Live:
___________________________________________________________
📜 SCRIPT : PORTFOLIO TABLE Full
🎴 Art by : @Titans_Invest & @DiFlip
👨💻 Dev by : @Titans_Invest & @DiFlip
🎑 Titans Invest — The Wizards Without Gloves 🧤
✨ Enjoy!
___________________________________________________________
o Mission 🗺
• Inspire Traders to manifest Magic in the Market.
o Vision 𐓏
• To elevate collective Energy 𐓷𐓏

Aggregated Open Interest [Alpha Extract]The Aggregated Open Interest indicator provides a comprehensive view of open interest across multiple cryptocurrency exchanges, allowing traders to monitor institutional positioning and market sentiment. By aggregating data from major exchanges like Binance, BitMEX, and Kraken, this indicator offers valuable insights into potential price movements and market shifts.
🔶 CALCULATION
The indicator processes open interest data through multiple analytical methods:
Exchange Aggregation: Collects and normalizes open interest data from multiple exchanges (Binance, BitMEX, Kraken) with proper currency normalization.
Multi-Mode Analysis: Calculates various metrics including raw open interest values, OI change, OI delta, volume-weighted delta, and OI RSI.
Divergence Detection: Uses pivot point analysis to identify divergences between price action and open interest movements.
Activity Assessment: Tracks bullish and bearish activity patterns by correlating open interest changes with price movements.
Formula:
Aggregate OI = Sum of normalized open interest from selected exchanges
OI Change = Current OI - Previous OI
OI Delta = Net change in open interest across timeframes
OI Delta × Volume = OI Delta weighted by relative volume
OI RSI = Relative Strength Index applied to open interest values
OI Heatmap = Multi-timeframe visualization of OI changes across 7 distinct periods
🔶 DETAILS
Visual Features:
Open Interest: Candlestick representation of aggregated open interest
OI Change: Histogram showing period-to-period changes
OI Delta: Histogram displaying net OI movements
OI Delta × Volume: Volume-weighted OI delta for enhanced signals
OI RSI: Oscillator showing overbought/oversold OI conditions
OI Heatmap: Multi-timeframe visualization showing OI changes across 7 periods (3, 5, 8, 13, 21, 34, and 55 days)
Divergence Detection: Color-coded markers (teal for bullish, red for bearish) highlighting significant divergences between price and open interest
Analysis Table: Real-time summary of key metrics including aggregate OI, recent changes, and bullish/bearish activity.
Interpretation:
Increasing Open Interest + Rising Price: Strong bullish trend confirmation
Increasing Open Interest + Falling Price: Strong bearish trend confirmation
Decreasing Open Interest + Rising Price: Weak bullish trend (potential reversal)
Decreasing Open Interest + Falling Price: Weak bearish trend (potential reversal)
Divergences: Signal potential trend exhaustion and reversals when price moves in one direction while open interest moves in the opposite direction
Heatmap: Provides at-a-glance insight into open interest trends across multiple timeframes, with green bars indicating rising OI and red bars indicating falling OI
🔶 EXAMPLES
Trend Confirmation: Rising open interest accompanying a price increase confirms strong bullish momentum with institutional backing.
Example: During January-February 2025, rising OI during price advances confirms institutional participation in the uptrend.
Bearish Divergence: Price makes a higher high while open interest makes a lower high, signaling potential trend reversal.
Example: Red markers appear at market tops where price continues higher but open interest fails to confirm, preceding significant corrections.
Bullish Divergence : Price makes a lower low while open interest makes a higher low, indicating potential bottoming.
Example: Teal markers appear at market bottoms where price continues lower but open interest fails to confirm, preceding significant rallies.
OI Heatmap Analysis : Multiple timeframes showing consistent red signals across short to long-term periods indicate strong institutional selling pressure.
Example: When all 7 periods (3-55 days) show red during a price uptrend, this signals institutional selling into retail strength, often preceding major corrections.
🔶 SETTINGS
Customization Options:
Data Sources: Toggle different exchanges (Binance USDT/USD/BUSD, BitMEX USD/USDT, Kraken USD)
Display Mode: Choose between Open Interest, OI Change, OI Delta, OI Delta × Volume, OI RSI, and OI Heatmap
Currency Units: Display in USD or base cryptocurrency (COIN)
Analysis Tools: Moving Average (length and color), RSI (length and color)
Divergence Detection: Enable/disable signals, adjust lookback period and threshold percentage, customize bullish/bearish divergence colors
OI Heatmap Colors: Customize bullish (green) and bearish (red) signal colors for the multi-timeframe heatmap visualization
The Aggregated Open Interest indicator provides traders with comprehensive insights into institutional positioning across major exchanges, helping identify potential trend continuations, reversals, and key market turning points driven by smart money movements. The addition of the OI Heatmap feature enables traders to quickly visualize open interest trends across multiple timeframes, providing valuable context for institutional positioning over different market cycles.

Volume Profile & Smart Money Explorer🔍 Volume Profile & Smart Money Explorer: Decode Institutional Footprints
Master the art of institutional trading with this sophisticated volume analysis tool. Track smart money movements, identify peak liquidity windows, and align your trades with major market participants.
🌟 Key Features:
📊 Triple-Layer Volume Analysis
• Total Volume Patterns
• Directional Volume Split (Up/Down)
• Institutional Flow Detection
• Real-time Smart Money Tracking
• Historical Pattern Recognition
⚡ Smart Money Detection
• Institutional Trade Identification
• Large Block Order Tracking
• Smart Money Concentration Periods
• Whale Activity Alerts
• Volume Threshold Analysis
📈 Advanced Profiling
• Hourly Volume Distribution
• Directional Bias Analysis
• Liquidity Heat Maps
• Volume Pattern Recognition
• Custom Threshold Settings
🎯 Strategic Applications:
Institutional Trading:
• Track Big Player Movements
• Identify Accumulation/Distribution
• Follow Smart Money Flow
• Detect Institutional Trading Windows
• Monitor Block Orders
Risk Management:
• Identify High Liquidity Windows
• Avoid Thin Market Periods
• Optimize Position Sizing
• Track Market Participation
• Monitor Volume Quality
Market Analysis:
• Volume Pattern Recognition
• Smart Money Flow Analysis
• Liquidity Window Identification
• Institutional Activity Cycles
• Market Depth Analysis
💡 Perfect For:
• Professional Traders
• Volume Profile Traders
• Institutional Traders
• Risk Managers
• Algorithmic Traders
• Smart Money Followers
• Day Traders
• Swing Traders
📊 Key Metrics:
• Normalized Volume Profiles
• Institutional Thresholds
• Directional Volume Split
• Smart Money Concentration
• Historical Patterns
• Real-time Analysis
⚡ Trading Edge:
• Trade with Institution Flow
• Identify Optimal Entry Points
• Recognize Distribution Patterns
• Follow Smart Money Positioning
• Avoid Thin Markets
• Capitalize on Peak Liquidity
🎓 Educational Value:
• Understand Market Structure
• Learn Volume Analysis
• Master Institutional Patterns
• Develop Market Intuition
• Track Smart Money Flow
🛠️ Customization:
• Adjustable Time Windows
• Flexible Volume Thresholds
• Multiple Timeframe Analysis
• Custom Alert Settings
• Visual Preference Options
Whether you're tracking institutional flows in crypto markets or following smart money in traditional markets, the Volume Profile & Smart Money Explorer provides the deep insights needed to trade alongside the biggest players.
Transform your trading from retail guesswork to institutional precision. Know exactly when and where smart money moves, and position yourself ahead of major market shifts.
#VolumeProfile #SmartMoney #InstitutionalTrading #MarketAnalysis #TradingView #VolumeAnalysis #CryptoTrading #ForexTrading #TechnicalAnalysis #Trading #PriceAction #MarketStructure #OrderFlow #Liquidity #RiskManagement #TradingStrategy #DayTrading #SwingTrading #AlgoTrading #QuantitativeTrading

RSI+ Crypto Smart Strategy by Ignotus ### **RSI+ Crypto Smart Strategy by Ignotus**
**Description:**
The **RSI+ Crypto Smart Strategy by Ignotus** is an advanced and visually enhanced version of the classic **Relative Strength Index (RSI)**, developed by the **Crypto Smart** community. This indicator is designed to provide traders with a clear and actionable view of market momentum, overbought/oversold conditions, and potential reversal points. With its sleek design, customizable settings, and intuitive visual signals, this tool is perfect for traders who want to align their strategies with the principles of the **Crypto Smart** methodology.
Whether you're a beginner or an experienced trader, this indicator simplifies technical analysis while offering powerful insights into market behavior. It combines traditional RSI calculations with advanced visual enhancements and natural language interpretations, making it easier than ever to interpret market conditions at a glance.
---
### **Key Features:**
1. **Enhanced RSI Visualization:**
- The RSI line dynamically changes color based on its position relative to the 50-level midpoint:
- **Green** for bullish momentum (RSI > 50).
- **Red** for bearish momentum (RSI < 50).
- Overbought (default: 70) and oversold (default: 30) levels are clearly marked with customizable colors and shaded clouds for better visibility.
2. **Customizable Settings:**
- Adjust the RSI period, overbought/oversold thresholds, and background transparency to match your trading style.
- Fine-tune pivot lookback ranges and other parameters to adapt the indicator to different timeframes and assets.
3. **Interactive Information Table:**
- A compact, easy-to-read table provides real-time data on the current RSI value, its direction (▲, ▼, →), and a natural language interpretation of market conditions.
- Choose from three text sizes (small, medium, large) to optimize readability.
4. **Natural Language Interpretations:**
- The indicator includes a detailed explanation of the RSI's current state in plain English:
- Momentum trends (bullish, bearish, or neutral).
- Overbought/oversold warnings with potential reversal alerts.
- Clear guidance on whether the market is trending or ranging.
5. **Visual Buy/Sell Signals:**
- Triangles (▲ for buy, ▼ for sell) highlight potential entry and exit points based on RSI crossovers and divergence patterns.
- Configurable alerts notify you in real-time when key signals are triggered.
6. **Improved Aesthetics:**
- Clean, modern design with customizable colors for lines, clouds, and backgrounds.
- Dynamic shading and transparency options enhance chart clarity without cluttering the workspace.
---
### **How to Use This Indicator:**
- **Overbought/Oversold Zones:** Use the RSI's overbought (above 70) and oversold (below 30) zones to identify potential reversal points. Look for confirmation from price action or other indicators before entering trades.
- **Momentum Analysis:** Monitor the RSI's position relative to the 50-level midpoint to gauge bullish or bearish momentum.
- **Trend Identification:** Combine the RSI's readings with price trends to confirm the strength and direction of the market.
- **Entry/Exit Signals:** Use the visual signals (triangles) to spot potential entry and exit points. These signals are particularly useful for swing traders and scalpers.
---
### **Why Choose RSI+ Crypto Smart Strategy?**
This indicator is more than just an RSI—it's a complete tool designed to streamline your trading process. By focusing on clarity, customization, and actionable insights, the **RSI+ Crypto Smart Strategy** empowers traders to make informed decisions quickly and confidently. Whether you're trading cryptocurrencies, stocks, or forex, this indicator adapts seamlessly to your needs.
---
### **Developed by Crypto Smart:**
The **RSI+ Crypto Smart Strategy by Ignotus** is part of the **Crypto Smart** ecosystem, a community-driven initiative aimed at providing innovative tools and strategies for traders worldwide. Our mission is to simplify technical analysis while maintaining the depth and precision required for successful trading.
If you find this indicator helpful, please leave a review and share it with fellow traders! Your feedback helps us continue developing cutting-edge tools for the trading community.
---
### **Disclaimer:**
This indicator is a technical analysis tool and should not be considered financial advice. Trading involves risk, and past performance is not indicative of future results. Always conduct your own research and consult with a financial advisor before making trading decisions. Use of this indicator is at your own risk.

Ragi's 24h volumeThis script is a TradingView Pine Script indicator that displays the 24-hour trading volume for a given asset. It provides both the native volume of the asset and, if the asset is not already listed on Binance, also displays the 24-hour volume from Binance (if applicable). Here's a breakdown of the key components:
Volume Calculation:
It sums the volume data over different time frames: 1-minute, 5-minute (for daily charts), or 60-minute intervals.
The volume is calculated based on the asset's volume type (either "quote" volume or a calculated value of close * volume).
For crypto assets, if the volume data is unavailable, it raises an error.
Binance Volume:
If the asset is not from Binance, the script fetches 24-hour volume data from Binance for that symbol, ensuring it is using the correct currency rate.
Display:
The indicator displays a table with the 24-hour volume in the chosen position on the chart (top, middle, or bottom).
The table displays the current exchange's volume, and if applicable, the Binance volume.
The volume is color-coded based on predefined thresholds:
Attention: Displays a warning color for volumes exceeding the attention level.
Warning: Shows an alert color for volumes above the warning threshold.
Normal: Displays in standard color when the volume is lower than the warning level.
The text and background color are customizable, and users can adjust the text size and position of the table.
User Inputs:
The script allows customization of table text size, position, background color, and volume thresholds for attention and warning.
In summary, this indicator is designed to track and display 24-hour volume on a chart, with additional volume information from Binance if necessary, and provides visual cues based on volume levels to help traders quickly assess trading activity.
Buy Signal Forex & Crypto v0 ImprovedPurpose of the Script:
This script is designed to generate buy and sell signals for trading Forex and cryptocurrencies by analyzing price trends using exponential moving averages (EMAs), volatility, and volume filters. The signals are displayed as arrows on the chart.
What the Script Does
Input Settings:
The script allows the user to configure various settings, such as the lengths of EMAs, a higher timeframe for trend confirmation, and thresholds for volume and volatility (ATR - Average True Range).
Key settings:
5 EMA Length – Length of the short-term EMA.
13 EMA Length – Length of the medium-term EMA.
26 EMA Length – Length of the long-term EMA.
21 EMA Length – Used for trend confirmation on a higher timeframe.
Higher Timeframe – Lets you select a timeframe (e.g., daily) for confirming the overall trend.
ATR Threshold – Filters out signals when the market's volatility is too low.
Volume Filter – Ensures sufficient trading activity before generating signals.
Calculating EMAs (Exponential Moving Averages):
Four EMAs are calculated:
ema5 (short-term), ema13 (medium-term), ema26 (long-term), and ema21 (higher timeframe confirmation).
These EMAs help determine price trends and crossovers, which are critical for identifying buy and sell opportunities.
Trend Confirmation Using a Higher Timeframe:
The 21 EMA on the higher timeframe (e.g., daily) is used to confirm the overall direction of the market.
Defining Signal Conditions:
Buy Signal:
A buy signal is generated when:
ema5 crosses above ema13 (indicating a bullish trend).
ema5 crosses above ema26 (stronger bullish confirmation).
The closing price is above ema5, ema13, ema26, and the 21 EMA on the higher timeframe.
The market's volatility (ATR) is above the defined threshold.
The volume meets the conditions or volume filtering is disabled.
Sell Signal:
A sell signal is generated when:
ema5 crosses below ema13 (indicating a bearish trend).
ema5 crosses below ema26 (stronger bearish confirmation).
The closing price is below ema5, ema13, ema26, and the 21 EMA on the higher timeframe.
The market's volatility (ATR) is above the defined threshold.
The volume meets the conditions or volume filtering is disabled.
Volume Filtering:
Ensures there’s enough trading activity by comparing the current volume to a 20-period moving average of volume.
Persistent Variables:
These variables (crossed13 and crossed13Sell) help track whether the short-term EMA (ema5) has crossed the medium-term EMA (ema13). This prevents false or repeated signals.
Displaying Signals on the Chart:
Buy signals are displayed as green upward arrows below the price.
Sell signals are displayed as red downward arrows above the price.
How It Helps Traders:
This script provides visual cues for potential entry and exit points by combining moving average crossovers, volatility, volume, and higher timeframe trend confirmation. It works well for trending markets and ensures signals are filtered for stronger conditions to reduce noise.

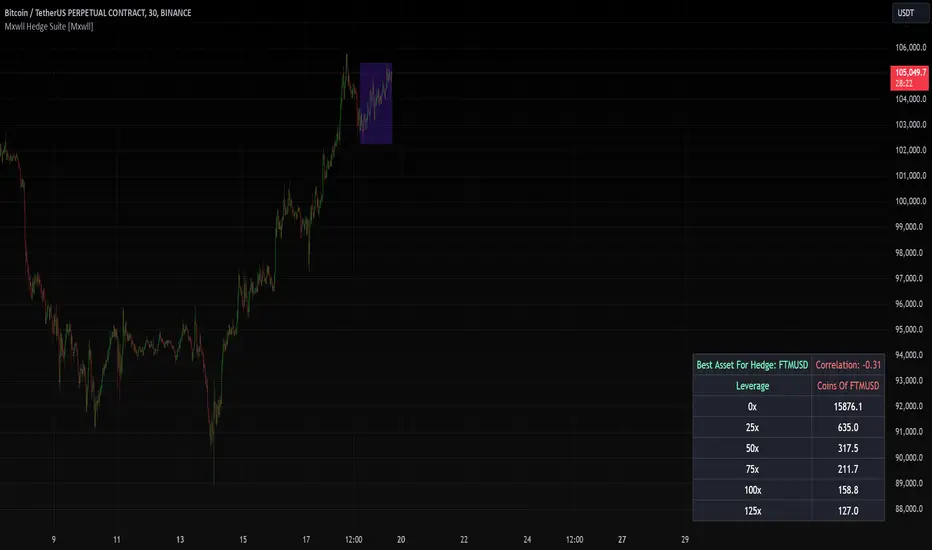
Mxwll Hedge Suite [Mxwll]Hello Traders!
The Mxwll Hedge Suite determines the best asset to hedge against the asset on your chart!
By determining correlation between the asset on your chart and a group of internally listed assets, the Mxwll Hedge Suite determines which asset from the list exhibits the highest negative correlation, and then determines exactly how many coins/shares/contracts of the asset must be bought to achieve a perfect 1:1 hedge!
The image above exemplifies the process!
The purple box on the chart shows the eligible price action used to determine correlation between the asset on my chart (BTCUSDT.P) and the list of cryptocurrencies that can be used as a hedge!
From this price action, the coin determined to have to greatest negative correlation to BTCUSDT.P is FTMUSD.
The image above further outlines the hedge table located in the bottom-right corner of your chart!
The hedge table shows exactly how many coins you’d need to purchase for the hedge asset at various leverages to achieve a perfect 1:1 hedge!
Hedge Suite works on any asset on any timeframe!
And that’s all! A short and sweet script that is hopefully helpful to traders looking to hedge their positions with a negatively correlated asset!
Thank you, Traders!
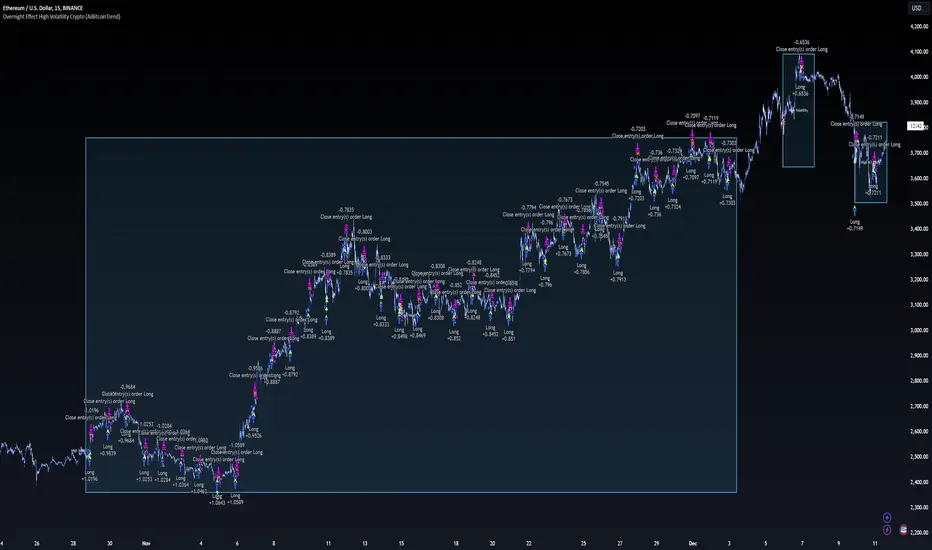
Overnight Effect High Volatility Crypto (AiBitcoinTrend)👽 Overview of the Strategy
This strategy leverages the overnight effect in the cryptocurrency market, specifically targeting the two-hour window from 21:00 UTC to 23:00 UTC. The strategy is designed to be applied only during periods of high volatility, which is determined using historical volatility data. This approach, inspired by research from Padyšák and Vojtko (2022), aims to capitalize on statistically significant return patterns observed during these hours.
Deep Backtesting with a High Volatility Filter
Deep Backtesting without a High Volatility Filter
👽 How the Strategy Works
Volatility Calculation:
Each day at 00:00 UTC, the strategy calculates the 30-day historical volatility of crypto returns (typically Bitcoin). The historical volatility is the standard deviation of the log returns over the past 30 days, representing the market's recent volatility level.
Median Volatility Benchmark:
The median of the 30-day historical volatility is calculated over a 365-day period (one year). This median acts as a benchmark to classify each day as either:
👾 High Volatility: When the current 30-day volatility exceeds the median volatility.
👾 Low Volatility: When the current 30-day volatility is below the median.
Trading Rule:
If the day is classified as a High Volatility Day, the strategy executes the following trades:
👾 Buy at 21:00 UTC.
👾 Sell at 23:00 UTC.
Trade Execution Details:
The strategy uses a 0.02% fee per trade.
Each trade is executed with 25% of the available capital. This allocation helps manage risk while allowing for compounding returns.
Rationale:
The returns during the 22:00 and 23:00 UTC hours have been found to be statistically significant during high volatility periods. The overnight effect is believed to drive this phenomenon due to the asynchronous closing hours of global financial markets. This creates unique trading opportunities in the cryptocurrency market, where exchanges remain open 24/7.
👽 Market Context and Global Time Zone Impact
👾 Why 21:00 to 23:00 UTC?
During this window, major traditional financial markets are closed:
NYSE (New York) closes at 21:00 UTC.
London and European markets are closed during these hours.
Asian markets (Tokyo, Hong Kong, etc.) open later, leaving this window largely unaffected by traditional trading flows.
This global market inactivity creates a period where significant moves can occur in the cryptocurrency market, particularly during high volatility.
👽 Strategy Parameters
Volatility Period: 30 days.
The lookback period for calculating historical volatility.
Median Period: 365 days.
The lookback period for calculating the median volatility benchmark.
Entry Time: 21:00 UTC.
Adjust this to your local time if necessary (e.g., 16:00 in New York, 22:00 in Stockholm).
Exit Time: 23:00 UTC.
Adjust this to your local time if necessary (e.g., 18:00 in New York, 00:00 midnight in Stockholm).
👽 Benefits of the Strategy
Seasonality Effect:
The strategy captures consistent patterns driven by the overnight effect and high volatility periods.
Risk Reduction:
Since trades are executed during a specific window and only on high volatility days, the strategy helps mitigate exposure to broader market risk.
Simplicity and Efficiency:
The strategy is moderately complex, making it accessible for traders while offering significant returns.
Global Applicability:
Suitable for traders worldwide, with clear guidelines on adjusting for local time zones.
👽 Considerations
Market Conditions: The strategy works best in a high-volatility environment.
Execution: Requires precise timing to enter and exit trades at the specified hours.
Time Zone Adjustments: Ensure you convert UTC times accurately based on your location to execute trades at the correct local times.
Disclaimer: This information is for entertainment purposes only and does not constitute financial advice. Please consult with a qualified financial advisor before making any investment decisions.
ETH Signal 15m
This strategy uses the Supertrend indicator combined with RSI to generate buy and sell signals, with stop loss (SL) and take profit (TP) conditions based on ATR (Average True Range). Below is a detailed explanation of each part:
1. General Information BINANCE:ETHUSDT.P
Strategy Name: "ETH Signal 15m"
Designed for use on the 15-minute time frame for the ETH pair.
Default capital allocation is 15% of total equity for each trade.
2. Backtest Period
start_time and end_time: Define the start and end time of the backtest period.
start_time = 2024-08-01: Start date of the backtest.
end_time = 2054-01-01: End date of the backtest.
The strategy will only run when the current time falls within this specified range.
3. Supertrend Indicator
Supertrend is a trend-following indicator that provides buy or sell signals based on the direction of price changes.
factor = 2.76: The multiplier used in the Supertrend calculation (increasing this value makes the Supertrend less sensitive to price movements).
atrPeriod = 12: Number of periods used to calculate ATR.
Output:
direction: Determines the buy/sell direction based on Supertrend.
If direction decreases, it signals a buy (Long).
If direction increases, it signals a sell (Short).
4. RSI Indicator
RSI (Relative Strength Index) is a momentum indicator, often used to identify overbought or oversold conditions.
rsiLength = 12: Number of periods used to calculate RSI.
rsiOverbought = 70: RSI level considered overbought.
rsiOversold = 30: RSI level considered oversold.
5. Entry Conditions
Long Entry:
Supertrend gives a buy signal (ta.change(direction) < 0).
RSI must be below the overbought level (rsi < rsiOverbought).
Short Entry:
Supertrend gives a sell signal (ta.change(direction) > 0).
RSI must be above the oversold level (rsi > rsiOversold).
The strategy will only execute trades if the current time is within the backtest period (in_date_range).
6. Stop Loss (SL) and Take Profit (TP) Conditions
ATR (Average True Range) is used to calculate the distance for Stop Loss and Take Profit based on price volatility.
atr = ta.atr(atrPeriod): ATR is calculated using 12 periods.
Stop Loss and Take Profit are calculated as follows:
Long Trade:
Stop Loss: Set at close - 4 * atr (current price minus 4 times the ATR).
Take Profit: Set at close + 2 * atr (current price plus 2 times the ATR).
Short Trade:
Stop Loss: Set at close + 4 * atr (current price plus 4 times the ATR).
Take Profit: Set at close - 2.237 * atr (current price minus 2.237 times the ATR).
Summary:
This strategy enters a Long trade when the Supertrend indicates an upward trend and RSI is not in the overbought region. Conversely, a Short trade is entered when Supertrend signals a downtrend, and RSI is not oversold.
The trade is exited when the price reaches the Stop Loss or Take Profit levels, which are determined based on price volatility (ATR).
Disclaimer:
The content provided in this strategy is for informational and educational purposes only. It is not intended as financial, investment, or trading advice. Trading in cryptocurrency, stocks, or any financial markets involves significant risk, and you may lose more than your initial investment. Past performance is not indicative of future results, and no guarantee of profit can be made. You should consult with a professional financial advisor before making any investment decisions. The creator of this strategy is not responsible for any financial losses or damages incurred as a result of following this strategy. All trades are executed at your own risk.
