Sequentially Filtered Moving AverageThe previously proposed sequential filter aimed to filter variations lower than a certain period, this allowed to remove noisy variations and retain only the closing price values that occurred after a consecutive up/down, however because of the noisy nature of the closing price large filtering was impossible, in order to tackle to this problem the same indicator using a simple moving average as input is proposed, this allow for smoother results.
We will see that the proposed indicator can provide an alternative moving average that could be used as slow moving average in crossover systems.
The Indicator
The length parameter as the same function as the one described in the sequential filter post, however here length also control the period of the moving average used input, in short larger values of length will return a smoother but less reactive output.
In blue the moving average with length = 200, and in red the moving average with length = 50.
It is interesting to see how the moving average remain flat during ranging/flat market periods
Unfortunately like the sequential filter the sequentially filtered moving average (SFMA) is not affected by large short term variations such as gaps or short term volatile events. This is because of the nature of the sequential filter to ignore movements amplitude and only focus on the variation period.
Moving Average Crossover System
The SFMA is equal to a simple moving average of period length when a consecutive up/down sequence of size length has occurred, else the SFMA is equal to its precedent value, therefore we could expect less crosses between a fast moving average and the SFMA as slow moving average.
We can see on the figure above that the fast moving average of period 50 (in green) cross more with the slow moving average of period 200 (in red) than with the SFMA of period 200 (in blue).
Crosses can occur at the same time as with the classical slow moving average (in red) or a bit later.
Conclusion
A new moving average based on the recently proposed sequential filter has been proposed, it can be seen that under a moving average crossover system the proposed moving average seems to be more effective at producing less crosses without necessarily doing it with an excessive lag, in fact the moving average has either lag (length-1)/2 or lag length .
In the future it could be interesting to provide an hybrid alternative that take into account volatility as well as variations period.
Thanks for reading !
ค้นหาในสคริปต์สำหรับ "crossover债券是什么"

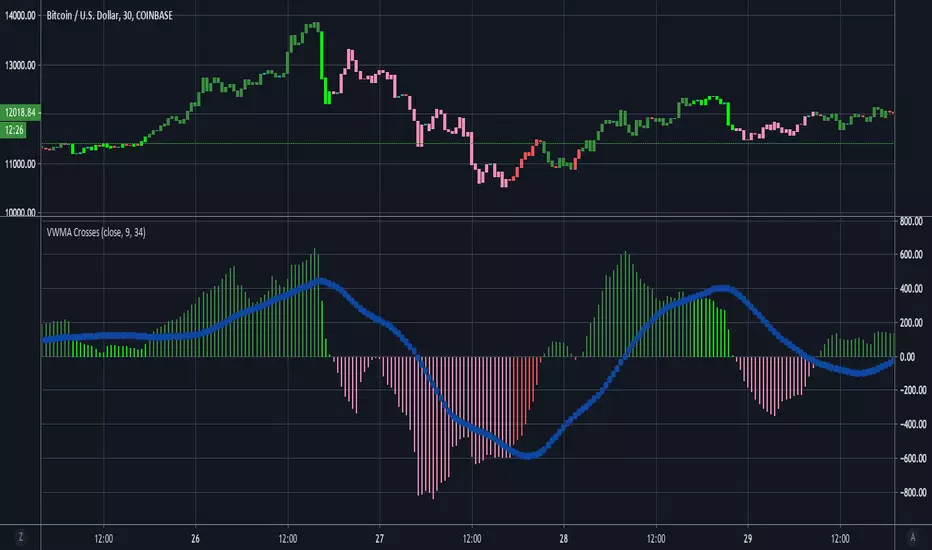
VWMA CrossesThis is a simple tool that gives traders a simple visual representation of Volume-Weighted Moving Average ( VWMA ) crossovers that is pretty similar to the MACD . We don't typically trade solely based on the VWMA , but it is definitely one of our go-to tools when combining multiple indicators.
When trading with VWMA's, it is common to enter a position when the fast VWMA crosses over the slow VWMA . In other words, the fast VWMA was previously less than the slow VWMA and is now greater in value than the slow VWMA . Conversely, traders often exit their positions when the fast VWMA crosses under the slow VWMA .
This tool plots the absolute value of the difference between the fast and slow VWMA's as a histogram. When the difference between the fast and slow VWMA's is greater than zero (meaning fast > slow), then the bars are green. The bars then turn red when the fast VWMA is less than the slow VWMA . The blue circle-line is a Simple Moving Average of the difference between the two lines.
Here's a quick guide to interpreting the chart:
if (fast VWMA > slow VWMA ) and (difference < sma of differences)
then color = lime green
if (fast VWMA > slow VWMA ) and (difference > sma of differences)
then color = dark green
if (fast VWMA < slow VWMA ) and (difference < sma of differences)
then color = light red
if (fast VWMA < slow VWMA ) and (difference > sma of differences)
then color = dark red
~Happy Trading~
The 6 Line Death PunchIf you are looking to discover what trend you are in, you need to first what direction the price is going in...
I've been using and testing a mixture of EMA's and SMA's for a long time and I've found that these ones are by far the best.
EMA 3
EMA 8
MA 20
EMA 55
MA 100
MA 200
EMA 3 & 8 Crossover is a good method for confirming a coin going to the upside or to the downside.
EMA 8 is known as the Trigger Line (trademarked brand) as one of the fib numbers it shows good support or resistance of a trend.
MA 20 universal way of seeing trend direction in the stock market, works well with crypto too.
EMA 55, another trusty fib number. Works very well and could trade off that alone as support and resistance.
MA 100 and MA 200. Long ranged moving averages which govern the overall longer-term trend.
LONG ENTRY
Option 1 - 3/8 crossover
Option 2 - Candles above EMA 8
Option 3 - Candles above MA 20
Option 4 - Candles Above EMA 55.
SHORT ENTRY
Option 1 - 3/8 crossover
Option 2 - Candles below EMA 8
Option 3 - Candles below MA 20
Option 4 - Candles below EMA 55.

Amazing Crossover SystemEntry Rules
BUY when the 5 EMA crosses above the 10 EMA from underneath and the RSI crosses above the 50.0 mark from the bottom.
SELL when the 5 EMA crosses below the 10 EMA from the top and the RSI crosses below the 50.0 mark from the top.
Make sure that the RSI did cross 50.0 from the top or bottom and not just ranging tightly around the level.
How to setup Alert:
1) Add the Amazing Crossover System to your chart via Indicators
2) Find your currency pair
3) Set the timeframe on the chart to 1 hour
4) Press 'Alt + A' (create alert shortcut)
5) Set the following criteria for the alert:
Condition = 'Amazing Crossover System', Plot, ' BUY Signal'
The rest of the alert can be customized to your preferences
5) Repeat steps 1 - 4, but set the Condition = 'Amazing Crossover System', Plot, ' SELL Signal'

Chaikin Oscillator w/ crossovers [seiglerj]Added background shading to system Chaikin Oscillator to show crossovers more easily.

[RS]Moving Average Cross System V0moving average crossover with added functions:
if you want crossover with price set ma1 length to 1, or use as dual ma with both lengths, ability to turn ma's on and off leaving the crossover signals behind, ability to chose ma mode (sma, ema, rma, wma, vwma, swma and alma), ability to chose source (open, high, low, close, hl2, hlc3 or ohlc4).

EMA + MACD Sequential Crossover MNQ BBCbest works for 100 or 1000 tick chart for nasdaq 100.
9 21 ema crossover with macd crossover
Publisher BBCKPS

Script_Algo - High Low Range MA Crossover Strategy🎯 Core Concept
This strategy uses modified moving averages crossover, built on maximum and minimum prices, to determine entry and exit points in the market. A key advantage of this strategy is that it avoids most false signals in trendless conditions, which is characteristic of traditional moving average crossover strategies. This makes it possible to improve the risk/reward ratio and, consequently, the strategy's profitability.
📊 How the Strategy Works
Main Mechanism
The strategy builds 4 moving averages:
Two senior MAs (on high and low) with a longer period
Two junior MAs (on high and low) with a shorter period
Buy signal 🟢: when the junior MA of lows crosses above the senior MA of highs
Sell signal 🔴: when the junior MA of highs crosses below the senior MA of lows
As seen on the chart, it was potentially possible to make 9X on the WIFUSDT cryptocurrency pair in just a year and a half. However, be careful—such results may not necessarily be repeated in the future.
Special Feature
Position closing priority ❗: if an opposite signal arrives while a position is open, the strategy first closes the current position and only then opens a new one
⚙️ Indicator Settings
Available Moving Average Types
EMA - Exponential MA
SMA - Simple MA
SSMA - Smoothed MA
WMA - Weighted MA
VWMA - Volume Weighted MA
RMA - Adaptive MA
DEMA - Double EMA
TEMA - Triple EMA
Adjustable Parameters
Senior MA Length - period for long-term moving averages
Junior MA Length - period for short-term moving averages
✅ Advantages of the Strategy
🛡️ False Signal Protection - using two pairs of modified MAs reduces the number of false entries
🔄 Configuration Flexibility - ability to choose MA type and calculation periods
⚡ Automatic Switching - the strategy automatically closes the current position when receiving an opposite signal
📈 Visual Clarity - all MAs are displayed on the chart in different colors
⚠️ Disadvantages and Risks
📉 Signal Lag - like all MA-based strategies, it may provide delayed signals during sharp movements
🔁 Frequent Switching - in sideways markets, it may lead to multiple consecutive position openings/closings
📊 Requires Optimization - optimal parameters need to be selected for different instruments and timeframes
💡 Usage Recommendations
Backtest - test the strategy's performance on historical data
Optimize Parameters - select MA periods suitable for the specific trading instrument
Use Filters - add additional filters to confirm signals
Manage Risks - always use stop-loss and take-profit orders.
You can safely connect to the exchange via webhook and enjoy trading.
Good luck and profits to everyone!!

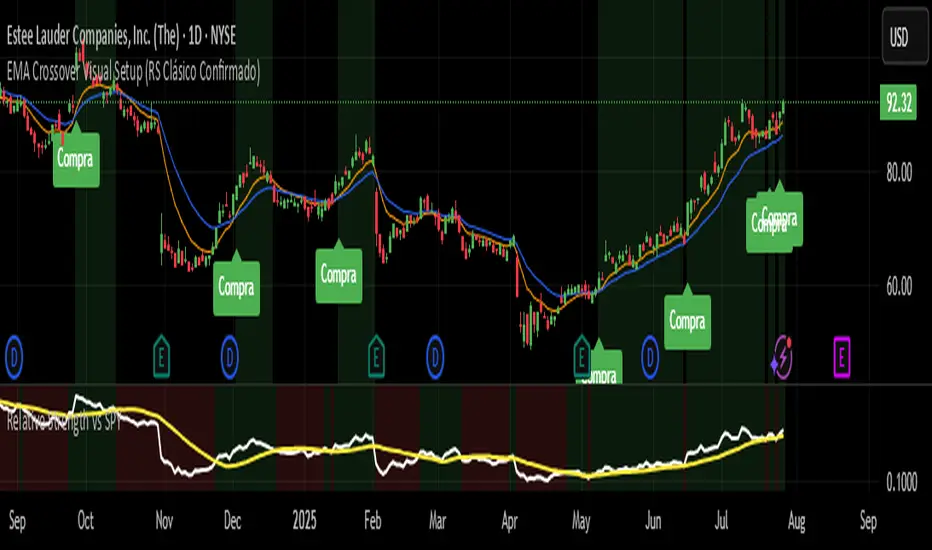
EMA Crossover Visual Setup (RS Clásico Confirmado)Overview
This script is designed to visually highlight classic swing trading setups based on the crossover of exponential moving averages (EMAs), with additional confirmation using Relative Strength (RS) compared to a benchmark asset (e.g., SPY).
The goal is to identify bullish momentum shifts that align both with technical structure (EMA crossover) and relative outperformance, helping traders focus on strong stocks in strong markets.
Logic
A signal is triggered when the following conditions are met:
The fast EMA (e.g., 10) crosses above the slow EMA (e.g., 20).
The closing price is above a third EMA (e.g., 50) to confirm bullish structure.
The asset's Relative Strength (RS) versus a benchmark is confirmed manually, based on an RSI comparison (not calculated inside the script).
The script is meant to be used alongside manual RS confirmation, using a secondary chart or overlay of the RS ratio.
Features
Visual labels and markers for clean charting of valid entry setups
Fully customizable EMA lengths
Optional highlighting of candle patterns near entry
Ideal for use with top-down analysis and watchlist filtering
Suggested Use
Works best on daily and 4H charts for swing trading setups
Combine with volume and price action analysis for higher probability trades
Use manual RS validation: confirm that the RSI of the selected stock is stronger than the RSI of SPY (or any benchmark of your choice)
Notes
This script does not execute trades or include stop loss/take profit logic, as it is intended for discretionary traders who want to visually scan for opportunities.
It also does not calculate RS internally, allowing flexibility in how you define strength (RS line, RSI comparison, or price ratio).
THF Crossover and Trend Signals Golden & Death Cross with VolumeScript Overview:
This Pine Script is designed to assist traders in identifying key buy/sell signals and major trend changes on the chart using Exponential Moving Averages (EMA) and Simple Moving Averages (SMA), as well as visualizing Golden Cross and Death Cross events. The script also includes a volume indicator to highlight the volume trading activity in relation to the price movements.
Key Features:
1. Moving Averages:
EMA 21: Exponential Moving Average over a 21-period, shown in green.
EMA 50: Exponential Moving Average over a 50-period, shown in yellow.
SMA 50: Simple Moving Average over a 50-period, shown in red.
SMA 200: Simple Moving Average over a 200-period, shown in blue.
2. Signals:
Buy Signal: Generated when EMA 21 crosses above SMA 50, indicating a potential upward trend. Displayed with a green label below the price bar.
Sell Signal: Generated when EMA 21 crosses below SMA 50, indicating a potential downward trend. Displayed with a red label above the price bar.
3. Golden Cross (Bullish Trend):
A Golden Cross occurs when EMA 50 crosses above SMA 200, which often signals the start of a long-term upward trend. The signal is displayed with a yellow label below the price bar.
4. Death Cross (Bearish Trend):
A Death Cross occurs when EMA 50 crosses below SMA 200, which often signals the start of a long-term downward trend. The signal is displayed with a blue label above the price bar.
5. Volume Indicator:
The volume is plotted as colored columns. Green indicates higher volume than the 20-period moving average, and red indicates lower volume.
A Volume Moving Average (SMA 20) is also plotted to compare volume changes over time.
How the Script Works:
1. The EMA and SMA lines are plotted on the chart, providing a visual representation of the short- and long-term trends.
2. Buy/Sell signals are triggered based on the crossover between EMA 21 and SMA 50, helping to identify potential entry and exit points.
3. The Golden Cross and Death Cross indicators highlight major trend reversals based on the crossover between EMA 50 and SMA 200, providing clear visual cues for long-term trend changes.
4. Volume is displayed alongside price movements, offering insight into the strength or weakness of a trend.
Key Customizations:
Moving Average Periods: Users can modify the lengths of the EMAs and SMAs for customized analysis.
Volume Moving Average Period: The script allows for adjustment of the volume moving average period to suit different market conditions.
Signal Visibility: The size and color of the buy, sell, Golden Cross, and Death Cross signals can be easily customized to make them more prominent on the chart.
Conclusion:
This script is ideal for traders looking to combine price action with volume analysis, using key technical indicators such as EMA, SMA, Golden Cross, and Death Cross to make informed decisions in trending markets.
---
This explanation covers all aspects of the script and provides a clear understanding of its functionality, which is helpful for sharing the script or using it as an educational resource.

RSI Crossover Signal Companion - Alerts + Visuals🔷 RSI Crossover Signal Companion — Alerts + Visuals
The Relative Strength Index (RSI) is a momentum oscillator that measures the speed and change of recent price movements. It helps traders identify overbought or oversold conditions, possible trend reversals, and momentum strength.
This utility builds on TradingView’s classic Relative Strength Index (RSI) by adding real-time alerts and triangle markers when the RSI crosses its own moving average — a common technique for early momentum detection.
It is designed as a lightweight, visual companion tool for traders using RSI/MA crossover logic in manual or semi-automated strategies.
🔍 Features
✅ Preserves the full original RSI layout, including:
• Gradient fill and overbought/oversold zones
• Standard RSI input settings (length, source, etc.)
• MA smoothing options with user-defined type and length
🔺 Adds visual triangle markers:
🔼 Up triangle when RSI crosses above its MA
🔽 Down triangle when RSI crosses below its MA
📢 Built-in alerts for RSI/MA crosses:
“RSI Crossed Above MA”
“RSI Crossed Below MA”
📈 How to Use
This script is ideal for:
• Spotting early momentum shifts
• Confirming entries or exits in other systems (price action, trendlines, breakouts)
• Building alert-based automation (webhooks, bots, etc.)
Popular use cases:
• Combine with trend indicators like MA200 or MA12
• Use in confluence with price structure and divergence
• Validate breakout moves with momentum confirmation
⚙️ Customization
RSI length, MA length, MA type, and source are fully adjustable
Triangle marker size, shape, and color can be edited under Style
Alerts are pre-built and ready for use

Ultimate Moving Average Crossover Indicator by SAMQUANT📈 Ultimate Moving Average Crossover Indicator | All-in-One MA Strategy
Unlock the power of multiple moving averages in one versatile indicator designed to give you clear, actionable signals in any market condition.
📌 Key Features:
- Supports **all major moving averages**:
- **SMA, EMA, WMA, HMA, RMA, DEMA, TEMA**, and more.
- Each MA is **fully customizable** with different lengths and types for ultimate flexibility.
- **Binary Long/Short signals** based on crossover logic—perfect for alerts, strategies, or discretionary trading.
- **Dynamic background coloring**:
- **Green** for bullish trends
- **Red** for bearish trends
Quickly gauge market direction at a glance.
---
🚀 Why Use This Indicator?
✅ Combines the strength of all major MA types
✅ Customizable to fit any trading style—scalping, swing, or trend following
✅ Built-in alerts ready for your next trade
✅ Visually intuitive with built-in signal clarity
✅ Excellent tool for **confluence-based** strategies
---
Great trades start with great tools. Clarity, precision, and flexibility—this indicator brings it all to your charts. Trade smarter, not harder.
---
> ⚠️ **Disclaimer:**
This script is intended for **educational and informational purposes only**. It does not constitute financial advice. Past performance is not indicative of future results. Always practice sound risk management and test strategies thoroughly before using real capital.

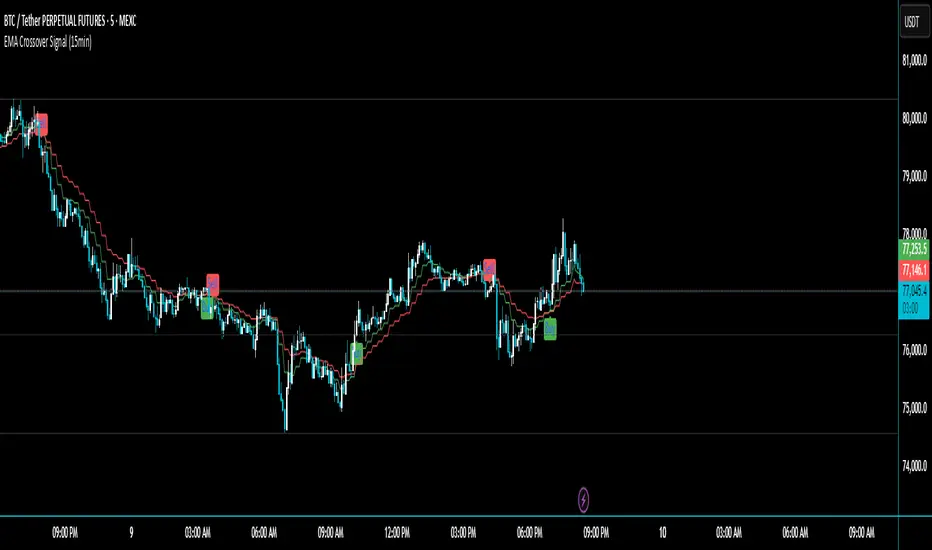
EMA Crossover Signal (15min)📈 EMA Crossover Signal (15min)
This indicator generates Buy and Sell signals based on a simple yet effective Exponential Moving Average (EMA) crossover strategy, strictly evaluated on the 15-minute timeframe.
✅ Strategy:
Buy Signal: Triggered when the 5 EMA crosses above the 10 EMA.
Sell Signal: Triggered when the 5 EMA crosses below the 10 EMA.
📌 Features:
Signals are evaluated using 15-minute data, regardless of your current chart timeframe.
Clear Buy/Sell labels are displayed directly on the chart.
Optional plotting of the 5 EMA and 10 EMA from the 15-minute chart for visual confirmation.
This tool is ideal for traders who want to follow short-term momentum shifts with high clarity and precision.
Prev Day High EMA Crossover with 7-Day SMA Trailing StopPrev Day High EMA Crossover with 7-Day SMA Trailing Stop
Overview
This indicator is designed for traders who seek high-probability breakout trades using a combination of Exponential Moving Averages (EMAs), the previous day's high, and a 7-day Simple Moving Average (SMA) trailing stop. It helps identify bullish and bearish crossover signals while ensuring confirmation with price action above or below key levels.
How It Works
1. Entry Signals:
✅ Bullish Entry:
The 9 EMA crosses above the 15 EMA (bullish momentum).
The price is above the previous day’s high (confirming a breakout).
The candle closes above the open (bullish confirmation).
✅ Bearish Entry:
The 9 EMA crosses below the 15 EMA (bearish momentum).
The price is below the previous day’s high (confirming a failure to break higher).
The candle closes below the open (bearish confirmation).
2. Exit Strategy (Trailing Stop):
📌 Long Exit: If in a long trade, exit when the price closes below the 7-day SMA.
📌 Short Exit: If in a short trade, exit when the price closes above the 7-day SMA.

VWAP and MA Crossover SignalsDescription: The VWAP and 20 MA Crossover Indicator is a powerful trading tool designed to capitalize on trend reversals and momentum shifts. This indicator overlays two key technical analysis tools on the price chart: the Volume Weighted Average Price (VWAP) and the 20-period Moving Average (MA).
Functionality:
VWAP: Represents the average price a security has traded at throughout the day, based on volume and price. It is a measure of the market's trend and trading volume.
20 MA: Offers a smoothed average of the closing prices over the last 20 periods, providing a glimpse of the underlying trend.
Signals:
Buy Signal: Generated when the VWAP crosses above the 20-period MA, suggesting an upward momentum and a potential bullish trend reversal.
Sell Signal: This occurs when the VWAP crosses below the 20-period MA, indicating a downward momentum and a potential bearish trend reversal.
Usage: This indicator is ideal for traders focusing on intraday and swing trading strategies, providing clear visual cues for entry and exit points based on the interaction between VWAP and the 20 MA. By identifying key crossover points, traders can make informed decisions about potential bullish or bearish movements in the market.
Application: To use this indicator, simply add it to your TradingView chart setup. The buy and sell signals will be displayed directly on the chart, allowing for easy interpretation and quick action. Adjust the settings to fit your specific trading strategy or market conditions.

Simplified MA Crossover indicatorThis is my first script, it is really simple logic and you probably saw something similar before. Is a crossover indicator between 2 Moving Average, one fast MA and the second slow MA.
Inputs you can adjust:
- 8 different source of MA's
- lenght of the MA's
- 7 different types of MA's ("EMA", "SMA", "RMA", "WMA", "DEMA", "TEMA", "HMA")
- 3 smoothing level of the fast MA
- plotting fast MA into the chart
- plotting crossover triangle shapes
I really enjoed the creation of this simple concept indicator, maybe not the fastest because of his nature but I liked work on it. I am sure is a good base to improve, study and try new idea.
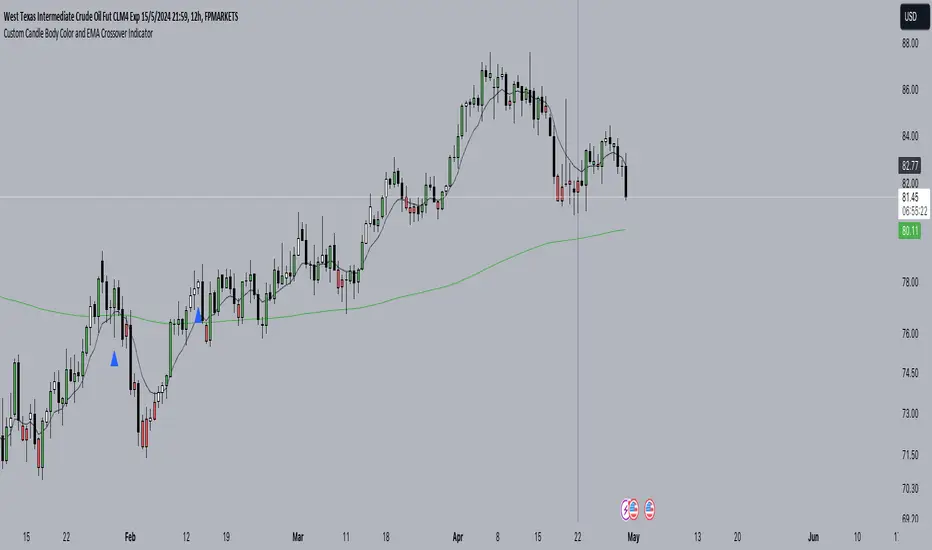
Custom Candle Body Color and EMA Crossover IndicatorWe determine if the price is below EMA 9 by comparing the close price with EMA 9.
We determine if the current candle body is huge compared to the previous candle's body.
We plot EMA 9 in black color and EMA 200 in green color.
We plot blue triangles below the bars for EMA crossover above and red triangles above the bars for EMA crossover below.
We set the color of the candle body to red if the price is below EMA 9 and to green if the price is above EMA 9, only when the current candle body is huge compared to the previous candle's body.
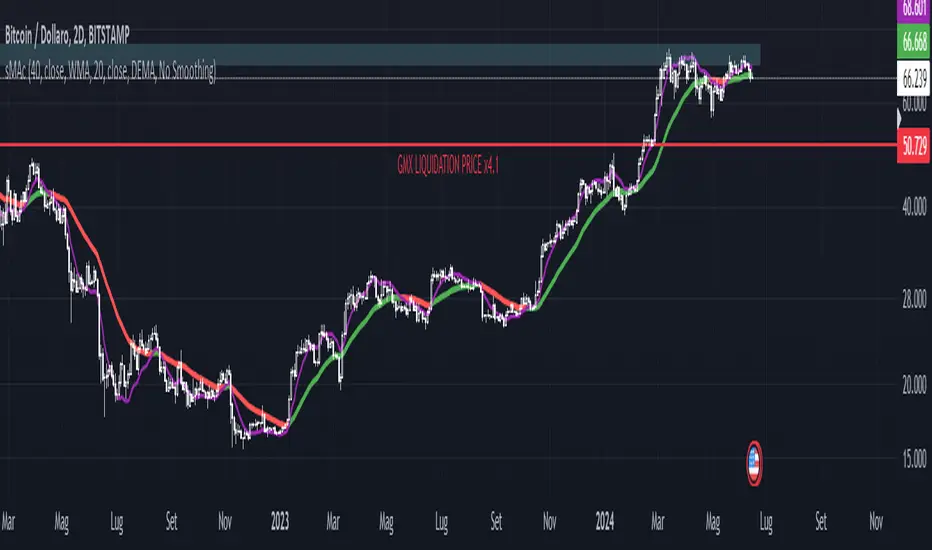
RSI SMA Crossover StrategyOverview
RSI SMA Crossover Strategy works the same way as traditional MA crossover strategies, but using RSI instead of price. When RSI crosses over the SMA, a long position is opened (buy). When RSI crosses under the SMA, the long position is closed (sell).
This strategy can be very effective when the right inputs are used (see below). Be sure to use the backtesting tool to determine the optimal parameters for a given asset/timeframe.
Inputs/Parameters
RSI Length: length for RSI calculation (default = 50)
SMA Length: length for SMA calculation (default = 25)
Strategy Properties
Initial Capital = $1000
No default properties are defined for Slippage, Commission, etc, so be sure to set these values to get accurate backtesting results. This script is being published open-source for a reason - save yourself a copy and adjust the settings as you like!
Backtesting Results
Testing on Bitcoin (all time index) 1D chart, with all default parameters.
$1,000 initial investment on 10/07/2010 turns into almost $2.5 billion as of 08/30/2022 (compared to $334 million if the initial investment was held over the same period)
Remember, results can vary greatly based on the variables mentioned above, so always be sure to backtest.

LoTek - CT Moving Average Crossover Indicator - MTF [CT/LoTek]This is a shameless fork of Caretaker's excellent CT MAC indicator. This indicator has 2 new features. I've added the ability to select a different timeframe for each moving average. This way you can set a Daily 10, or a weekly 20 or any other of your favorite lines and it will always be there on your chart. The other new features is the ability to select VWMA as well as SMA and EMA for each moving average. VWMA is pretty nice to watch as well, and with 9 moving averages to mix and match, I'm sure you'll find something worth keeping.
To fork this, I created a new "resolution" variable for each MA. I also created a new function that uses the request.security call to get the specific timeframe resolution. I backtested this with CT's OG script and the numbers stay the same... but I have a sneaky suspicion that VWMAs are not showing proper crossover values. So keep that in mind. The drawn lines are fine, but the crossover data when using VWMA may be off. I wrote the new function to default to EMA, so if it fails at VWMA, it will just show you EMA data.
Let's see, what else... please tell me if you find any bugs or want any other features baked in.

EMA crossover (daily TF)This strategy is only applicable for daily timeframe only. EMAs have been smoothened out to make sure to include volatility glitches that may occur. I have used following conditions:
>EMA crossover of two frames already occurred
> Significant volume in the candle
> Candles are properly bullish or bearish not doji
> price is near EMA crossover
> trading stoploss to reduce risk as price follows the trend
Positive feedbacks are welcome for incorporation.
NSE:SRF

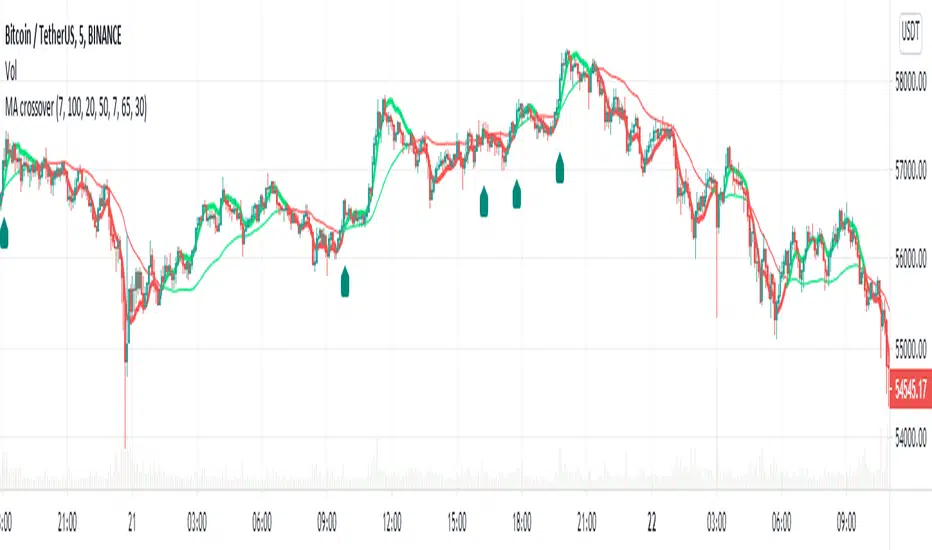
MA Crossover Alerts for Small Quick Profits on 3commas/DCA botDear fellow 3commas users,
This is a the most basic Moving Average crossover technique generating Buy Alerts.
This is especially written for those of you who want to link this basic crossover strategy with your 3commas DCA bot .
Buy Alerts
Moving averages available:
- Simple Moving Average (SMA)
- Exponential Moving Average (EMA)
- Weighted Moving Average (WMA)
- Hull Moving Average (HullMA)
- Volume Weighted Moving Average (VMWA)
- Running Moving Average (RMA)
- Triple Exponential Moving Average (TEMA)
Recommended settings for using with 3commas DCA bot:
Interval:
3m to 15m
3commas bot setup:
- TP/TTP: 0.3%/0.1%,
- Base Order: Your choice ,
- Safety Order: 1.2 * Base order
- Safety Order Volume Scale: 1.2,
- Safety Order Step Scale: 1.5,
- Max Active Deals: Your choice ,
- Price Deviation to Open Safety Order (% from initial order): 0.2%,
- Max Safety Trades Count: 7,
- Simulatenous Deals per Same Pair: 3
> Create Alert with Buy Alert and link it to your bot "Message for deal start signal"
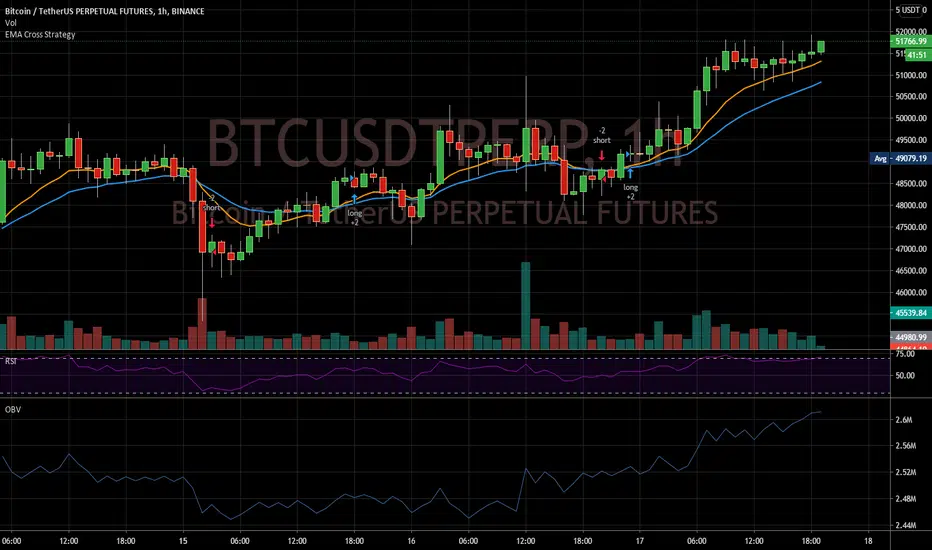
EMA Cross StrategyThis double EMA crossover strategy aims to illustrate a good strategy design.
It is currently the only published script that:
supports a proper date picker for the backtest period
is able to test in short and long mode only