ค้นหาในสคริปต์สำหรับ "crossover债券是什么"
FuTech : MACD Crossovers Advanced Alert Lines=============================================================
Indicator : FuTech: MACD Crossovers Advanced Alert Lines
Overview:
The "FuTech: MACD Crossovers Advanced Alert Lines" indicator is designed to assist traders in identifying key technical patterns using the :-
1. MACD (Moving Average Convergence Divergence) and
2. Golden/Death Crossovers
By visualizing these indicators directly on the chart with advanced lines, it helps traders make more informed decisions on when to enter or exit trades.
=============================================================
Key Features of "FuTech: MACD Crossovers Advanced Alert Lines":
1. MACD Crossovers:
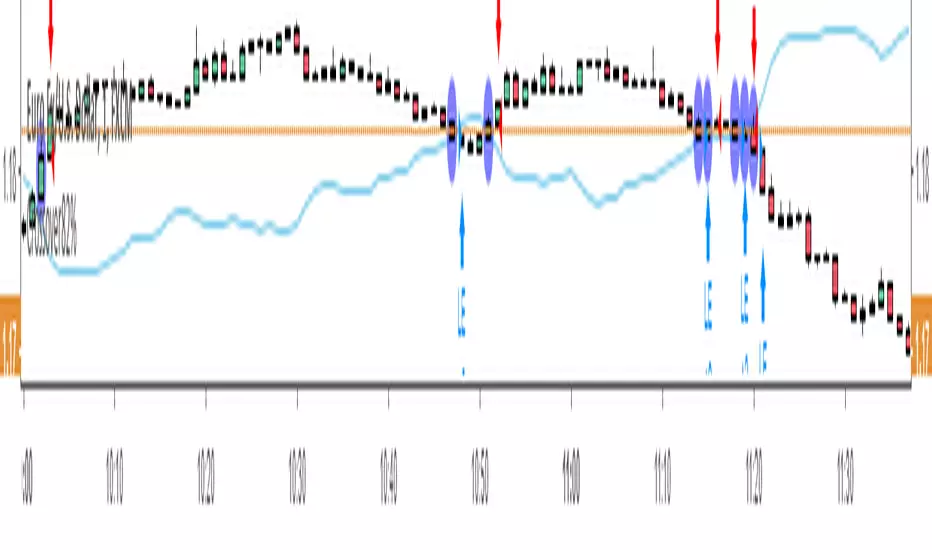
a) The MACD is one of the most widely used indicators for identifying momentum shifts and potential buy/sell signals. This indicator plots vertical lines on the chart whenever the MACD line crosses the signal line.
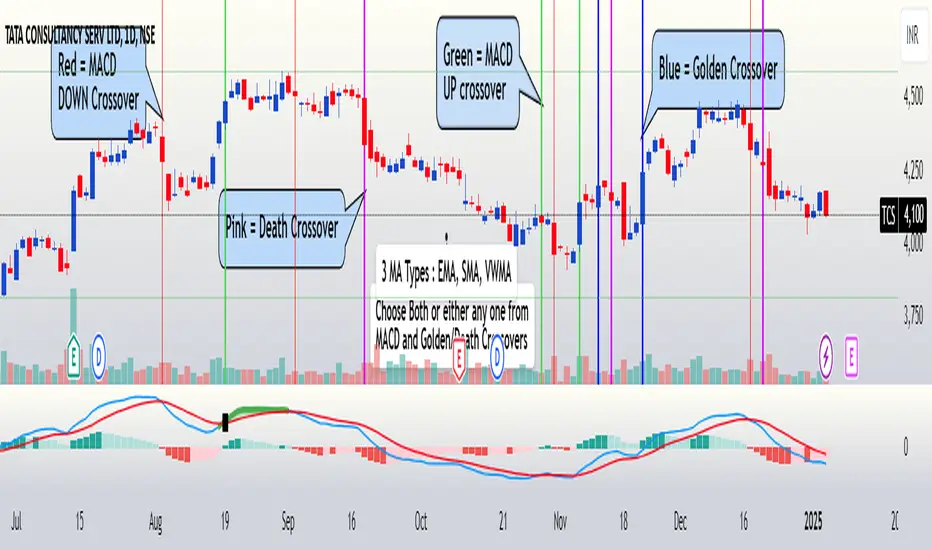
b) Upward Crossover (Bullish Signal) : When the MACD line crosses above the signal line, a green vertical line will appear, indicating a potential buying opportunity.
c) Downward Crossover (Bearish Signal) : When the MACD line crosses below the signal line, a red vertical line will appear, signaling a potential selling opportunity.
2. Golden Cross & Death Cross:
a) The Golden Cross occurs when the price moves above a long-term moving average (like the 50-day moving average), signaling a potential upward trend.
b) The Death Cross occurs when the price moves below a long-term moving average, signaling a potential downward trend.
c) These crossovers are displayed with customizable lines on the chart to easily spot when the market is shifting direction.
d) Golden Cross (Bullish Signal) : A blue vertical line appears when the price crosses above the selected long-term moving average.
e) Death Cross (Bearish Signal) : A purple vertical line appears when the price crosses below the selected long-term moving average.
=============================================================
Customization Options:
This indicator offers several customization options to suit your trading preferences:
1) MACD Settings:
a) Choose between different moving average types (EMA, SMA, or VWMA) for calculating the MACD.
b) Adjust the lengths of the fast, slow, and signal MACD periods.
c) Control the width and color of the vertical lines drawn on the chart for both up and down crossovers.
2) Golden Cross / Death Cross Settings:
a) Select the moving average type for the Golden Cross / Death Cross (EMA, SMA, or VWMA).
b) Define the lookback period for calculating the Golden Cross / Death Cross.
c) Customize the appearance of the Golden and Death Cross lines, including their width and color.
You can use both as well as either of the MACD lines or Golden Crossover / Death Crossover Lines respectively as per your trading strategies
=============================================================
How "FuTech: MACD Crossovers Advanced Alert Lines" indicator Works:
a) The indicator monitors the price and calculates the MACD and Golden/Death Crosses.
b) When the MACD line crosses above or below the signal line, or when the price crosses above or below the long-term moving average, it plots a vertical line on the chart.
c) These lines help traders quickly spot potential turning points in the market, providing clear signals to act upon.
=============================================================
Use Case:
a) Swing Traders: The indicator is useful for spotting momentum shifts and trend reversals, helping you time entries and exits for short- to medium-term trades.
b) Long-Term Traders: The Golden and Death Cross signals help identify major trend changes, giving insights into potential market shifts.
=============================================================
Why Use This "FuTech: MACD Crossovers Advanced Alert Lines" Indicator ?
a) Clear Visuals : The vertical lines provide clear and easy-to-spot signals for MACD crossovers and Golden/Death Crosses.
b) Customizable : Adjust settings for your personal trading strategy, whether you're focusing on short-term momentum or long-term trend shifts.
c) Supports Decision Making : With its advanced line plotting and customizable features, this indicator helps you make quicker and more informed trading decisions.
=============================================================
How to Use:
a) MACD Crossovers: Look for green lines to signal potential buying opportunities (when the MACD line crosses above the signal line) and red lines for selling opportunities (when the MACD line crosses below the signal line).
b) Golden Cross / Death Cross: Use the blue lines to confirm when a positive trend may begin (Golden Cross) and purple lines to warn when a negative trend may start (Death Cross).
=============================================================
Conclusion:
"FuTech: MACD Crossovers Advanced Alert Lines" indicator combines two powerful technical analysis tools, the MACD and Golden/Death Crosses, to provide clear, actionable signals on your chart.
By customizing the appearance of these signals and combining them with your trading strategy, you can enhance your decision-making process and improve your trading outcomes.
=============================================================
Thank you !
Jai Swaminarayan Dasna Das !
He Hari ! Bas Ek Tu Raji Tha !
=============================================================
TeoTrading 38 - Moving Average Crossover - Long-ShortWith this indicator you can obtain the percent of gain / loss of each trade based on Moving Average Crossover.
Prints different types of moving Average: SMA , EMA , WMA and VWMA.
It is usefull to view in only few minutes differents crossovers.
The crossver´s in LONG Trades are indicated with:
"P": Positive Crossover. Open a Long Trade.
Green: Negative Crossover with gain. Close the Long Trade.
Red: Negative Crossover with Loss. Close the Long Trade.
The crossver´s in SHORT Trades are indicated with:
"N": Negative Crossover. Open a Short Trade.
Green: Positive Crossover with gain. Close the Short Trade.
Red: Positive Crossover with Loss. Close the Short Trade.
The Percents of gain and loss are indicated in the Labels.
Input Parameters:
Type of Trade: Long/Short.
Type_: Type of Moving Average.
PrintPrice: Enable open value print.
Fast: Fast Moving Average.
Slow: Slow Moving Average.
This indicator does not generate recommendations to buy or to sell. It was designed ONLY for educational purposes.

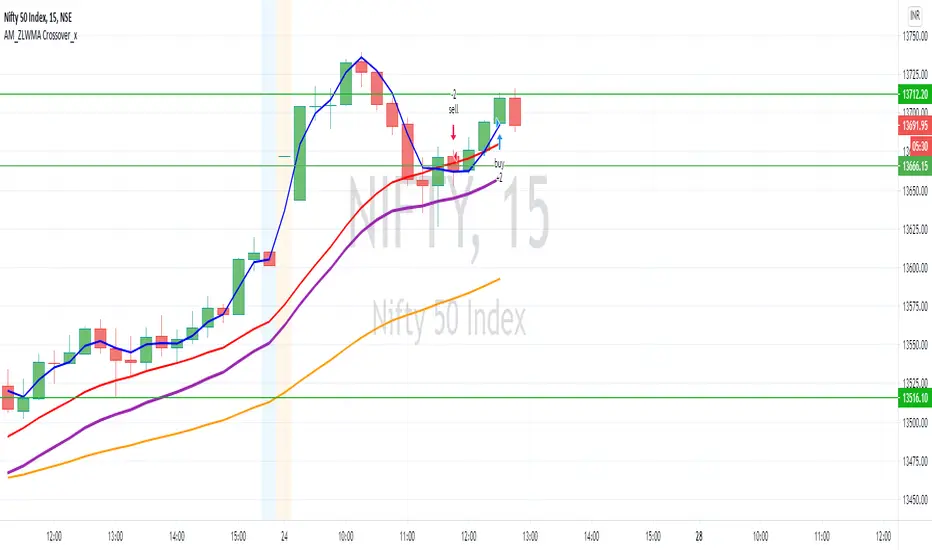
AM_ZLWMA Crossover_xDear All,
Please find updated version of Zero lag WMA crossover. In addition to this added 20/50 EMA to get better results.
Settings:
ZLWMA = 8 identified by Blue line
Fast WMA = 21 identified by Red line
EMA Period 20/50
How to Trade:
Buy: Wait for positive crossover (Blue cross above Red) to happen trade can be taken there but to get better results post crossover once price move above EMA 20 then buy can be initiated.
Sell: Wait for negative crossover (Blue cross below Red) to happen trade can be taken there but to get better results post crossover once price move below EMA 20 then sell can be initiated.
Reason to wait for confirmation of price action above / Below moving average is most of the time it happens that even after crossover happens sometimes it was just a pull back and from there it could be a possibility for reversal. Once price action confirms moving above / below EMA20 then trade will be initiated.
Please comment and ask for any doubt
jma + dwma crossoverThis crossover system was originally conceptualized by Jurik Research and made public to the world on their website .
The indicator consists of the faster Jurik Moving Average (JMA) and the slower Double Weighted Moving Average (DWMA). A long signal is shown when the JMA line crosses above the DWMA line (indicating a possible reversal in trend). A short signal is shown when the JMA line crosses below the DWMA line. Take profit signals are shown when the JMA line reverses directions. Alerts for signals are included in this indicator.
The default settings are not optimized for any timeframe. Both JMA and DWMA lines are defaulted to hidden.
Credit to @everget for the re-creation of the Jurik Moving Average in pinecsript.

EMA CrossoversUseful for identifying and receiving alerts about uptrends and downtrends.
This script uses two Exponential Moving Averages (EMAs) to find price uptrends and downtrends. An Exponential Moving Average (EMA) is a type of moving average that places a greater weight and significance on the most recent data points. The script produces uptrend and downtrend signals based on crossovers and divergences between the two EMAs, the user will be able to spot a trend change (when the EMAs crossover) and to determine the strength of the current trend (when the EMAs diverge). It is also posible to get alerts for uptrends and downtrends on the web and mobile app with sound and pop-ups as well as via email. The optimal time to enter and exit the market can be concluded from this trend changes.
The user can set their own EMAs, by default they are set to 21 and 55 periods for medium and long term respectively. When the medium term EMA crosses below the long term EMA the asset is in a downtrend and the price will decline, and when the medium term EMA crosses above the long term EMA the asset is in an uptrend and price will increase.
This scripts plots the following indicators and signals on the chart to help the user to identify trends:
1.- Medium and long term EMAs as lines overlaid on the price chart.
2.- Up green triangles above bars when the price is on an uptrend and down red triangles below bars when the price is on a downtrend.
3.- Arrows with text to indicate the start of an uptrend or downtrend.
The user can enable and disable the indicators and signals as well as set colors and shapes to their liking.
This script also lets the user create alerts for uptrends and downtrends. To create a new alert using this script follow this instructions:
1.- Once you added this script to your chart, go to the alerts panel (right on web or bottom tool bar on the mobile app) and add a new alert (alarm clock icon with a plus sign).
2.- A modal window will open. On the “Condition” dropdown menu select “EMA Crossovers”.
3.- On the next dropdown menu (right below the “Condition” one) you can select from two types of alerts “Uptrend started” and “Downtrend started”.
4.- Lastly you can set all the normal alert options and create the alert.

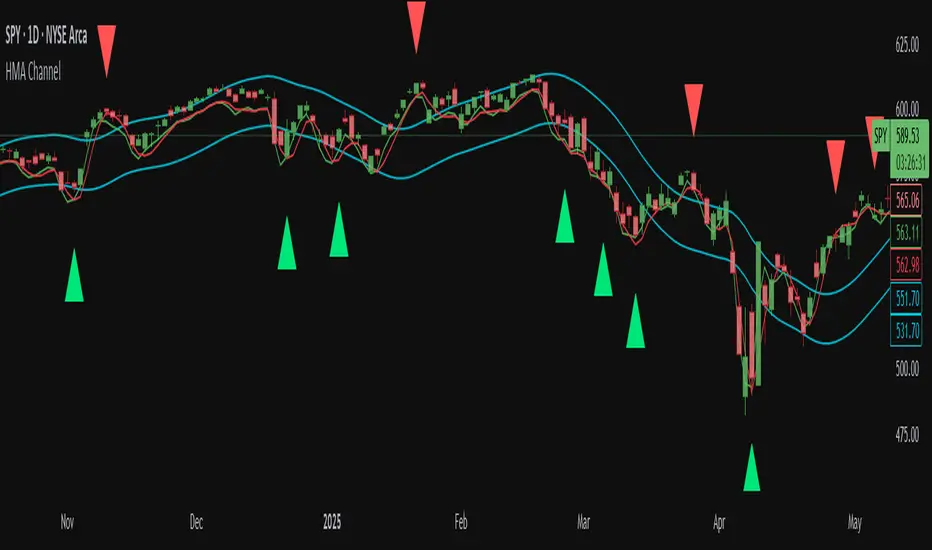
Hull MA Channel with Filtered CrossoversI've created an indicator that let's you create a HMA channel with 2 displaced HMA (A/B). As well as a HMA crossover set (C/D).
Here's how it works:
The HMA crossovers from C and D will not signal unless they are outside of the channel of A and B. As a matter of fact, NO buy signal whatsoever will occur above the channel and NO sell signal will occur below the channel.
The crossover HMA pair (C/D) can have their lengths adjusted to the 0.00 decimal point for VERY fine tuning of the crossovers.
(edit-it doesn't fine tune to the .00. This must not be a feature that is able to be utilized. I tried) The length adjustment still works to the nearest whole number. The .00 are mute :(
In keeping with that same logic, you can adjust the displacement of the channel independently to the 0.00 decimal, again for VERY fine tuning.
This is great for reversals while eliminating noise from false signals, keeping the chart nice and clean. Should be used in combination with other indicators for the best confirmations.
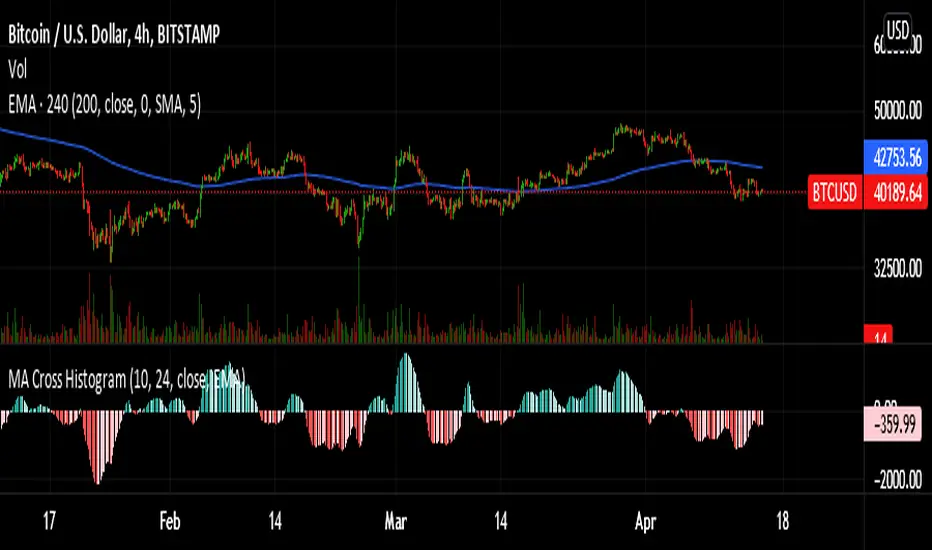
Moving Average Crossover Histogram IndicatorA modified version of the MACD indicator. As its name suggests, this is a moving average crossover indicator but the difference in values between moving averages is represented by a histogram. It subtracts the value of a fast MA and slow MA then the result is represented in a histogram which makes it easier for you to identify and visualize every moving average crossover.
If you use moving average crossover as your buy/sell signal this indicator is for you.
You could use this indicator instead of using two moving averages on your main chart. Really convenient, easy to use, and make your chart clutter-free. You could set the fast and slow MA values also the moving average types according to your trading style.
Hope you like it. :)
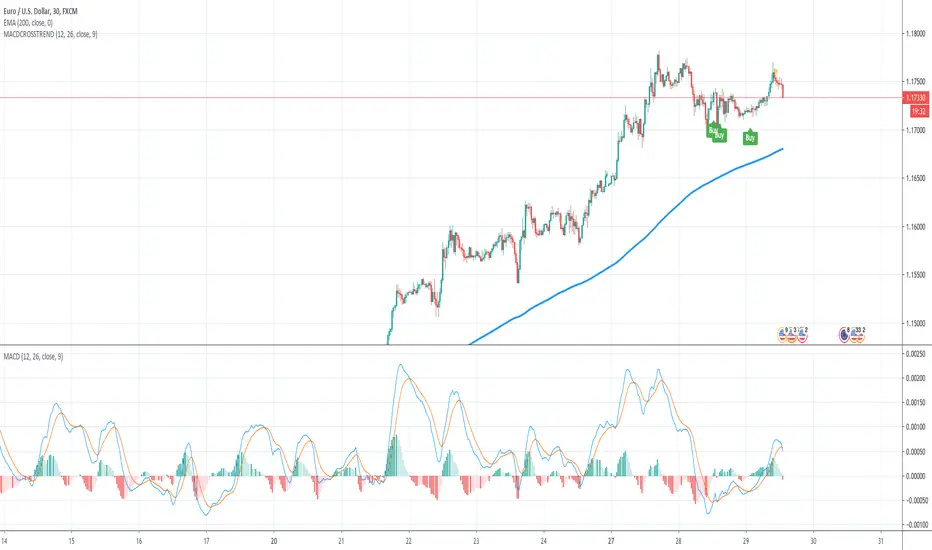
MACD Crossover Trend IndicatorThis is a very simple " the trend is your friend " indicator - if you are consistent!
How this indicator works:
This indicator detects MACD Crossovers based on the current trend. It checks wether the current close price is above or below the 200 EMA and therefore decides whether we are in an up- or down trend.
UP-TREND: If the price is above the EMA200, the MACD is below 0 and crosses up the signal line, then this is a BUY signal!
DOWN-TREND: If the price is below the EMA200, MACD is above 0 and crosses down the signal line, then this is a SELL signal!
You can also add an alert, that keeps you informed, once one of these scenario happens for a certain pair!
With this indicator you will never enter against the trend.
Have fun! :)

MACD Crossover Trend IndicatorHow this indicator works:
This indicator detects MACD Crossovers based on the current trend. It checks wether the current close price is above or below the 200 EMA and therefore decides whether we are in an up- or down trend.
UP-TREND: If the MACD is below 0 and crosses up the signal line, then this is a BUY signal!
DOWN-TREND: If the MACD is above 0 and crosses down the signal line, then this is a SELL signal!
How to trade this:
First rule: Be consistent!
Second rule: You will have lost trades and losing streaks - deal with it!
First set the SL slightly below the last significant low (eventually add/subtract the ATR value to/from it)
Then adjust the TP and ALWAYS use a RR ratio of 1.5.
NEVER get out of the trade earlier
Take every possible trade!
Important: Money management is key... so be consistent!
Have fun! :)
HMA-Crossover AlertsThis simple script plots bullish and bearish Hull Moving Average Crossovers and fires Alerts when long or short conditions are met.

On Chart Anticipated Moving Average Crossover IndicatorIntroducing the on chart moving average crossover indicator.
This is my On Chart Pinescript implementation of the Anticipated Simple Moving Average Crossover idea.
This indicator plots 6 user defined moving averages.
It also plots the 5 price levels required on the next close to cross a user selected moving average with the 5 other user defined moving averages
It also gives signals of anticipated moving average crosses as arrows on chart and also as tradingview alerts with a very high degree of accuracy
Much respect to the creator of the original idea Mr. Dimitris Tsokakis
Moving Averages
A moving average simplifies price data by smoothing it out by averaging closing prices and creating one flowing line which makes seeing the trend easier.
Moving averages can work well in strong trending conditions, but poorly in choppy or ranging conditions.
Adjusting the time frame can remedy this problem temporarily, although at some point, these issues are likely to occur regardless of the time frame chosen for the moving average(s).
While Exponential moving averages react quicker to price changes than simple moving averages. In some cases, this may be good, and in others, it may cause false signals.
Moving averages with a shorter look back period (20 days, for example) will also respond quicker to price changes than an average with a longer look back period (200 days).
Trading Strategies — Moving Average Crossovers
Moving average crossovers are a popular strategy for both entries and exits. MAs can also highlight areas of potential support or resistance.
The first type is a price crossover, which is when the price crosses above or below a moving average to signal a potential change in trend.
Another strategy is to apply two moving averages to a chart: one longer and one shorter.
When the shorter-term MA crosses above the longer-term MA, it's a buy signal, as it indicates that the trend is shifting up. This is known as a "golden cross."
Meanwhile, when the shorter-term MA crosses below the longer-term MA, it's a sell signal, as it indicates that the trend is shifting down. This is known as a "dead/death cross."
MA and MA Cross Strategy Disadvantages
Moving averages are calculated based on historical data, and while this may appear predictive nothing about the calculation is predictive in nature.
Moving averages are always based on historical data and simply show the average price over a certain time period.
Therefore, results using moving averages can be quite random.
At times, the market seems to respect MA support/resistance and trade signals, and at other times, it shows these indicators no respect.
One major problem is that, if the price action becomes choppy, the price may swing back and forth, generating multiple trend reversal or trade signals.
When this occurs, it's best to step aside or utilize another indicator to help clarify the trend.
The same thing can occur with MA crossovers when the MAs get "tangled up" for a period of time during periods of consolidation, triggering multiple losing trades.
Ensure you use a robust risk management system to avoid getting "Chopped Up" or "Whip Sawed" during these periods.

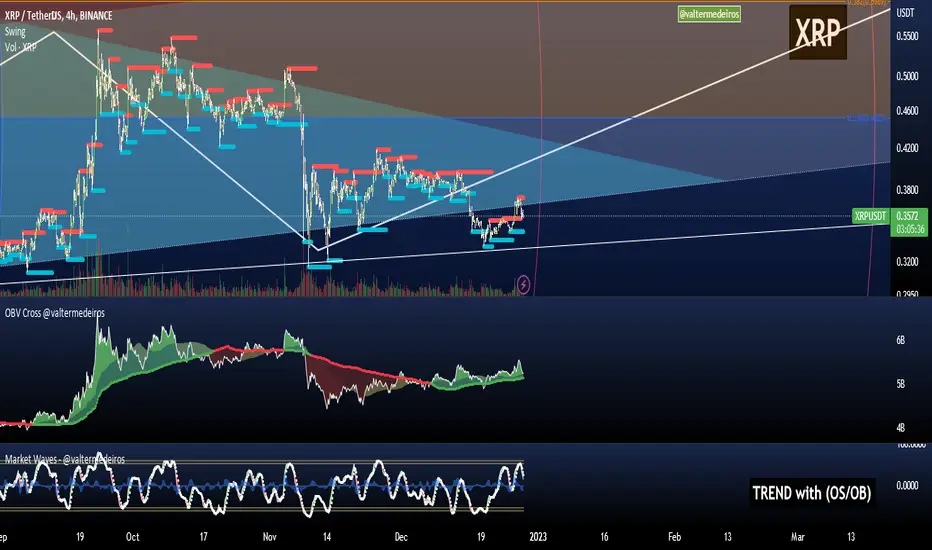
On Balance Volume CrossoversCheck on balance volume but with crossover. You can choose the smoothing method, which is set by default to use the Volume Weighted Moving Average (bringing volume to the equation is always a good idea) but you can change to SMA, MA, EMA, ...
Hope you guys enjoy it and don't forget to rate it up! :)
I plan to include % from 0-100 OBV in here later! Stay tuned.
Feedback is cool.
Baekdoo compressed multi EMA box and its crossover indicatorHi forks,
I'm trader Baekdoosan who trading Equity from South Korea. This Baekdoo compressed multi EMA box and its crossover indicator tells us good trading time for swing trading.
Here is the idea. As you can see formula, I put ema of 5 days to 100 days.
and draw box when all disparity of the EMAs are less than 5%
I put those value in input variable as 105 (100 means same as max/min disparity ratio, 105 means max is 5% greater than min). This can be used 110 (10% of box) based on your needs.
Once box are drew, I put indicator when it crossover the box with 5 times larger than 60 days' highest volume. Then I put triangle indicator. This will be good trading point for short-mid term trading. you can check historical chart to evaluate this.
Hope this will help your trading on equity as well as crypto. I didn't try it on futures . Best of luck all of you. Gazua~!

Moving Average Multitool CrossoverAs per request, this is a moving average crossover version of my original moving average multitool script .
It allows you to easily access and switch between different types of moving averages, without having to continuously add and remove different moving averages from your chart. This should make backtesting moving average crossovers much, much more easier. It also has the option to show buy and sell signals for the crossovers of the chosen moving averages.
It contains the following moving averages:
Exponential Moving Average (EMA)
Simple Moving Average (SMA)
Weighted Moving Average (WMA)
Double Exponential Moving Average (DEMA)
Triple Exponential Moving Average (TEMA)
Triangular Moving Average (TMA)
Volume-Weighted Moving Average (VWMA)
Smoothed Moving Average (SMMA)
Hull Moving Average (HMA)
Least Squares Moving Average (LSMA)
Kijun-Sen line from the Ichimoku Kinko-Hyo system (Kijun)
McGinley Dynamic (MD)
Rolling Moving Average (RMA)
Jurik Moving Average (JMA)
Arnaud Legoux Moving Average (ALMA)
Vector Autoregression Moving Average (VAR)
Welles Wilder Moving Average (WWMA)
Sine Weighted Moving Average (SWMA)
Leo Moving Average (LMA)
Variable Index Dynamic Average (VIDYA)
Fractal Adaptive Moving Average (FRAMA)
Variable Moving Average (VAR)
Geometric Mean Moving Average (GMMA)
Corrective Moving Average (CMA)
Moving Median (MM)
Quick Moving Average (QMA)
Kaufman's Adaptive Moving Average (KAMA)
Volatility-Adjusted Moving Average (VAMA)
Modular Filter (MF)

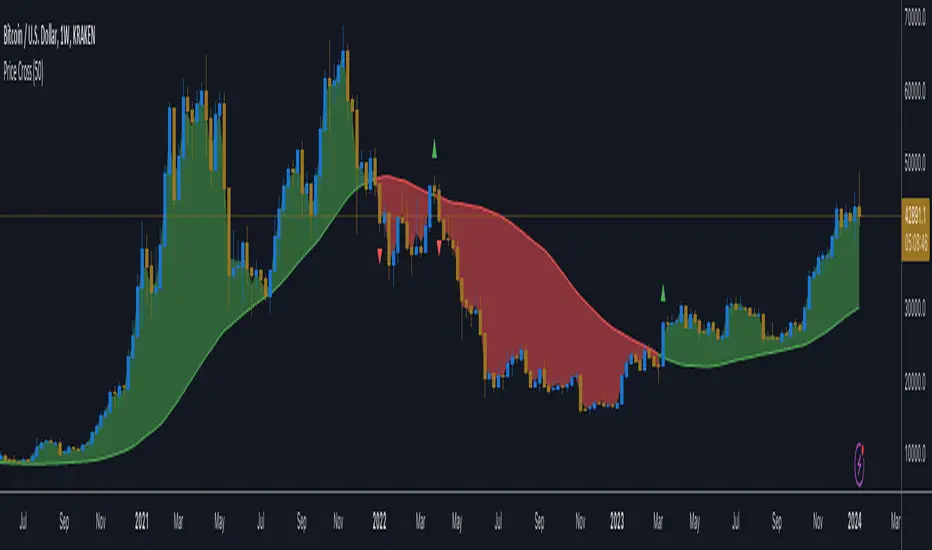
Price CrossoverThe price crossing above or below the moving average signals a potential change in trend.
When the price crosses above the moving average, it is bullish, the color of the zone between the price and the MA is green, a green up arrow emphasizes the crossover.
And when it crosses below the moving average, it is bearish, the color of the zone between the price and the MA is red, a red down arrow emphasizes the crossover.
Trend changes are then easier to spot.
Crossover EMMMCrossover EMMM is an indicator that displays the Madrid Moving Averages (EMMM) and detects crossovers (upward crossings) and crossunders (downward crossings) between two moving averages. It uses two input parameters to define the fast and slow EMMM lengths. The script calculates the EMMM values, their changes, and assigns colors based on the change direction. The fast EMMM is plotted in green or red, and the slow EMMM is plotted in blue or red, depending on the change direction. The script also displays triangle shapes below or above the bars to indicate crossovers and crossunders.
The "Madrid Moving Average" (EMMMM) is a type of moving average used in technical analysis to smooth price fluctuations of financial assets, such as stocks or currency pairs. Unlike the Simple Moving Average (SMA), which treats all data equally, the EMMM gives more weight to recent data. This results in the EMMM responding more swiftly to price changes, making it well-suited for identifying short-term trends.
Krown Moving Averages & Crossover LevelsIntroducing Krown Moving Averages with Crossover levels.
This indicator
Plots 5 Ema's and 3 SMA's ( Default Krown Periods )
It calculates the price levels at which each pair of moving averages would be equal .
That means that if price closes the other side of that level the pair of moving will cross also.
These levels can therefore be considered as " crossover levels....( the price level where each pair of moving averages will cross)
It can give crossover levels for
SMA crossing SMA
EMA crossing EMA
EMA crossing SMA
Plots optional Labels for all crossover levels....(off by default needs to be turned on in the settings)
Plots optional crossover levels as lines and dots colored as the 2 colors of the pair of moving averages.....(off by default needs to be turned on in the settings)
This indicator is aimed at traders who use simple and exponential moving average crossovers as part of their trading plan or edge.
It takes the guesswork out of knowing at what price level a pair of moving averages will cross which helps to improve entries and risk management.
There is an optional "Cutoff" function and user adjustable "limit factor" which cuts the plots off once they are too far below or above the current price to prevent chart auto focus issues.
There is a decimal place truncation option to set the decimal places depending on the asset type and price accuracy required.
Inspired by a request from a community member after one of my recent reverse engineered indicator publications.
I am publishing this open source in the hopes that some newer coders will find the functions interesting and useful.

Elgrand - MACD crossover overlay with alertVisualize MACD bullish and bearish crossovers on your chart as an overlay. This way you won't necessarily have to add the MACD script and check manually at which point on your chart the MACD crossed. Optionally you can set alerts on the MACD crossovers in case you would like to trade from this after the signal occured.

MA Crossover TypeDraws the up and down crossovers of a specified MA Type.
# Inputs
- MA Type: "sma", "ema", "swma", "vwma", "wma"
- Length >=1
- Source
- Offset >= 0
- Show cross Up?
- Show cross Down?
# Open Source
The code is open source @ github.com and uses the commonpine library github.com

EMA21/55 Crossover AlertThis will alert on EMA crossovers. Alert for 21 crossover and crossunder. Work in progress.
Pucci Trend EMA-SMA Crossover with TolerancePucci Trend EMA-SMA Crossover with Tolerance
This indicator helps identify market trends and generates trading signals based on the crossover between an Exponential Moving Average (EMA) and a Simple Moving Average (SMA) with an adjustable tolerance threshold. The signals work as follows:
Buy Signal (B) -> Triggers when the EMA crosses above the SMA, exceeding a user-defined tolerance (in basis points). Optionally, a price filter can require the high or low to be below the EMA for confirmation.
Sell Signal (S) -> Triggers when the SMA crosses above the EMA, exceeding the tolerance. The optional price filter may require the high or low to be above the EMA.
The tolerance helps reduce false signals by requiring a minimum distance between the moving averages before confirming a crossover. The price filter adds an extra confirmation layer by checking if price action respects the EMA level.
Important Notes:
1º No profitability guarantee: This tool is for analysis only and may generate losses.
2º "As Is" disclaimer: Provided without warranties or responsibility for trading outcomes.
3º Use Stop Loss: Users must determine their own risk management.
4º Parameter adjustment needed: Optimal MA periods and tolerance vary by timeframe.
5º Filter impact varies: Enabling/disabling the price filter may improve or worsen performance.

Uhl MA Crossover SystemToday proposed indicator is based on the corrected moving average, an indicator originally proposed by Andreas Uhl professor at Salzburg University. This moving average is not the most well known, which is a pity since its design is extremely elegant.
The corrected moving average (CMA) is an adaptive moving average based on exponential averaging and aim to correct common problems of classical moving averages such as crosses occurring during sideway markets, more details will be introduced in the calculation section. The CMA aim to act as a slow moving average in a moving average crossover system.
Here a new fast adaptive moving average named corrected trend step (CTS) based on the CMA is introduced in order to provide a full moving average crossover system based on A. Uhl design.
To Andreas Uhl
Calculation And Understanding The CTS
Even if the code is quite compact, the original idea behind the CMA can be blurry for some users, however it is actually relatively simple to understand. The CMA is based on exponential averaging and a smoothing variable is therefore required, in the CMA the calculation of the smoothing variable is based on the squared distance between the precedent CMA output and a simple moving average, and the rolling variance, where the rolling variance act as threshold.
The CTS work the same way but instead of using the squared error between a simple moving average and the previous CMA output, we use the squared error between the closing price and the previous CTS output, this allow the CTS to better fit with the closing price. As said before the rolling variance act as threshold, if the squared error is lower than the rolling variance this mean that the CTS is close to the price, which can indicate a sideway market, therefore we should filter the entirety of the current price, therefore on sideways market the CTS is equal to the precedent value of the CTS.
In trending/volatile markets we expect the price to go away from the CTS, thus having an high squared error, if the squared error is greater than the rolling variance, the smoothing variable is equal to 1 - variance/squared error , here variance/squared error < 1 since the squared error is greater than the rolling variance ( remember that the smoothing variable need to be in a (0,1) range ), however if the squared error is way higher than variance this ratio will be small, which would return a non reactive output, but thats not what we want ! This is why we subtract 1 by this ratio in order to make the CTS more reactive instead of less reactive.
In case the squared error is greater than the rolling variance during sideway markets we would not expect a huge difference anyway, that is squared error ≈ variance and therefore:
1 - variance/squared error ≈ 1 - 1/1 ≈ 1 - 1 ≈ 0
This is a beautiful way to make an adaptive moving average, the CMA is not a flashy indicator, but when we look at the details behind the design we can only get amazed, or maybe that its just me, truly a great adaptive moving average.
The System
length control the filtering amount of both moving averages, with higher values of length returning larger filtering amount. Mult multiply the rolling variance by an user selected value, this also allow a greater amount of filtering.
The CTS act as a fast moving average while the CMA act as a slow moving average.
Here the indicator with length = 200, we can see how a sideway market who could have generated a large amount of signals don't affect our system.
Unlike classical crossovers systems where the slow moving average will rarely produce a cross with the fast moving average and price at the same time, the Uhl system can actually do that:
Conclusion
A moving average crossover system based on the corrected moving average proposed by Andreas Uhl has been presented, a new moving average that aim to produce good fits with the price has been created especially for this system. The logic behind the CMA has also been explained. A possible strategy analysis could be presented in the future.
In conclusion i would say the CMA is a bit underrated, in a field where arrows, signals, alerts are the only things appreciated by peoples, original content is slowly dying, this actually make today technical indicators have a pretty bad academic reputations. I'am afraid that today haiku master is Uhl rather than me, i hope to see more indicators from him in the future.
Thanks for reading !
Original paper: www.buero-uhl.de
