EMA Market Structure [BOSWaves]EMA Market Structure - Trend-Driven Structural Mapping with Adaptive Swing Detection
Overview
The EMA Market Structure indicator provides an advanced framework for visualizing market structure through dynamically filtered trend and swing analysis.
Unlike conventional EMA overlays, which merely indicate average price direction, this model integrates trend acceleration, swing highs/lows, and break-of-structure (BOS) logic into a unified, visually intuitive display.
Each element adapts in real time to price movement, offering traders a living map of support, resistance, and trend bias that reacts fluidly to market momentum.
The result is a comprehensive, trend-aware representation of price structure.
EMA slope and acceleration guide trend perception, while swing points identify key inflection zones.
Breaks of prior highs or lows are highlighted with visual BOS labels and stop-loss projections, giving traders actionable context for continuation or reversal setups.
Unlike static lines or simple moving averages, the EMA Market Structure indicator fuses dynamic trend analysis with structural awareness to provide a clear picture of market bias and potential turning points.
Theoretical Foundation
The EMA Market Structure builds on principles of momentum filtering and structural analysis.
Standard moving averages track average price but ignore acceleration and context; this indicator captures both the directional slope of the EMA and its rate of change, providing a proxy for trend strength.
Simultaneously, swing detection identifies statistically significant highs and lows, while BOS logic flags decisive breaks in structure, aligned with trend direction.
At its core are three interacting components:
EMA Trend & Acceleration : Smooths price data while highlighting acceleration changes, producing gradient-driven color cues for trend momentum.
Swing Detection Engine : Identifies swing highs and lows over configurable bar lengths, ensuring key turning points are captured with minimal clutter.
Break-of-Structure Logic : Detects price breaches of previous swings and aligns them with EMA trend for actionable BOS signals, including projected stop-loss levels for tactical decision-making.
By integrating these elements, the system scales effectively across timeframes and assets, maintaining structural clarity while visualizing trend dynamics in real time. Traders receive both macro and micro perspectives of market movement, with clear cues for trend continuation or reversal.
How It Works
The EMA Market Structure indicator operates through layered processing stages:
EMA Slope & Acceleration : Calculates the EMA and its rate of change, normalizing via ATR and a smoothing function to produce gradient color coding. This allows instant visual identification of bullish or bearish momentum.
Swing Identification : Swing highs and lows are computed using configurable left/right bar lengths, filtered through a cool-off mechanism to prevent redundant signals and maintain chart clarity.
Structural Lines & Zones : Swing points are connected with lines, and shaded zones are drawn between successive highs/lows to highlight key support and resistance regions.
Break-of-Structure Detection : BOS events occur when price breaches a prior swing in alignment with the EMA trend. Bullish and bearish BOS signals include enhanced label effects and projected stop-loss lines and zones, providing immediate tactical reference.
Dynamic Background Mapping : The chart background adapts to EMA trend direction, reinforcing trend context with subtle visual cues.
Through these processes, the indicator creates a living, adaptive map of market structure that reflects both trend strength and swing-based inflection points.
Interpretation
The EMA Market Structure reframes market reading from simple trend following to structured awareness of price behavior:
Uptrend Phases : EMA is rising with positive acceleration, swings confirm higher lows, and BOS events occur above prior highs, signaling trend continuation.
Downtrend Phases : EMA slope is negative, swings form lower highs, and BOS events occur below prior lows, confirming bearish bias.
Trend Reversals : Flat or decelerating EMA with BOS failures may indicate impending structural change.
Critical Zones : Swing-based lines and shaded zones highlight areas where price may pause, reverse, or accelerate, providing high-probability decision points.
Visually, EMA color gradients, structural lines, and BOS labels combine to provide both statistical trend confirmation and actionable structural cues.
Strategy Integration
EMA Market Structure integrates seamlessly into trend-following and swing-based trading systems:
Trend Alignment : Confirm higher-timeframe EMA slope before entering continuation trades.
BOS Entry Triggers : Use BOS events aligned with EMA trend for tactical entries and stop placement.
Support/Resistance Mapping : Swing lines and zones help define areas for scaling, exits, or reversals.
Volatility Context : ATR-based smoothing and stop-loss buffers accommodate varying market volatility, ensuring robustness across conditions.
Multi-Timeframe Coordination : Combine higher-timeframe EMA trend and swings with lower-timeframe structural events for precision entries.
Technical Implementation Details
Core Engine : EMA slope and ATR-normalized acceleration for gradient-driven trend visualization.
Swing Framework : Pivot-based high/low detection with configurable bar lengths and cool-off intervals.
Structural Visualization : Lines, zones, and labels for high-fidelity mapping of support/resistance and BOS events.
BOS Engine : Detects structural breaks aligned with EMA trend, automatically plotting stop-loss lines and visual cues.
Performance Profile : Lightweight, optimized for real-time responsiveness across multiple timeframes.
Optimal Application Parameters
Timeframe Guidance:
1 - 5 min : Ideal for intraday swing spotting and microstructure trend tracking.
15 - 60 min : Medium-range structural analysis and BOS-driven entries.
4H - Daily : Macro trend mapping and key swing-based support/resistance identification.
Suggested Configuration:
EMA Length : 50
Swing Length : 5
Swing Cooloff : 10 bars
BOS Cooloff : 15 bars
SL Buffer : 0.1%
These suggested parameters should be used as a baseline; their effectiveness depends on the asset volatility, liquidity, and preferred entry frequency, so fine-tuning is expected for optimal performance.
Performance Characteristics
High Effectiveness:
Trending markets with defined swings and structural consistency.
Markets where EMA slope and acceleration reliably indicate momentum changes.
Reduced Effectiveness:
Choppy or sideways markets with minimal swing definition.
Random walk assets lacking clear structural anchors.
Integration Guidelines
Confluence Framework : Combine with volume, momentum, or BOSWaves structural indicators
to validate entries.
Directional Control: Follow EMA slope and BOS alignment for high-conviction trades.
Risk Calibration: Use SL projections for disciplined exposure management.
Multi-Timeframe Synergy: Confirm higher-timeframe trend before executing lower-timeframe structural trades.
Disclaimer
The EMA Market Structure is a professional-grade trend and structure visualization tool. It is not predictive or guaranteed profitable; performance depends on parameter tuning, market regime, and disciplined execution. BOSWaves recommends using it as part of a comprehensive analytical stack integrating trend, liquidity, and structural context.
ค้นหาในสคริปต์สำหรับ "change"

Smart Adaptive Double Patterns [The_lurker]Smart Adaptive Double Patterns
This is an advanced technical indicator that combines two of the strongest and most renowned classical price reversal patterns:
✅ Double Bottom Pattern — a bullish reversal pattern that forms after a downtrend
✅ Double Top Pattern — a bearish reversal pattern that forms after an uptrend
The indicator does not merely detect patterns — it provides a fully integrated, intelligent system that includes:
✅ Precise quality scoring for each pattern using 5 technical criteria
✅ Automatic price target calculation at three levels (Conservative, Balanced, Aggressive)
✅ Multi-layer dynamic filtering to avoid false signals
✅ Live pattern tracking from formation to target achievement or failure
✅ Comprehensive alert system covering all possible trading scenarios
🎯 Why Is This Indicator Unique?
1️⃣ High Detection Accuracy
Unlike traditional indicators that rely on simple rules, this one applies 5 strict structural conditions to confirm pattern validity:
A clear trend must precede the pattern
High symmetry between the two bottoms or two tops
No break of critical price levels during formation
Logical spacing between key points
Technical confirmation from ADX, ATR, and Volume
2️⃣ Advanced Quality Scoring System
Each pattern is scored out of 100 based on 5 weighted criteria:
Symmetry (30%): How closely the two bottoms or tops match
Trend Strength (20%): Strength of the prior trend
Volume Behavior (20%): Trading activity at critical points
Pattern Depth (15%): Vertical distance between neckline and bottom/top
Structural Integrity (15%): Full compliance with structural rules
3️⃣ Smart Target Management
Separate targets for bullish (Double Bottom) and bearish (Double Top) patterns
Separate projections for success and failure cases
Multiple options: Conservative (0.618) / Balanced (1.0) / Aggressive (1.618)
Live tracking with dynamic moving lines
4️⃣ Professional Failure Handling
Failed patterns are not ignored — they are turned into counter-trend opportunities:
Failed Double Bottom → triggers a bearish signal with downside targets
Failed Double Top → triggers a bullish signal with upside targets
Automatic color change for clear visual distinction
5️⃣ Full Customization Flexibility
Enable/disable each pattern independently
22+ adjustable settings
Unique colors for each pattern and quality level
Full bilingual support (Arabic / English)
📐 Pattern Details
🟦 Double Bottom Pattern
Sequence of points:
🔹 Point 1: Peak marking the start of a strong downtrend
🔹 Point 2 (Bottom 1): First low — first key bounce
🔹 Point 3: Intermediate high — forms the neckline (resistance)
🔹 Point 4 (Bottom 2): Second low — should closely match Bottom 1
🔹 Point 5: Breakout point — pattern confirmation
Mandatory Conditions:
✅ Clear downtrend before Point 2
✅ Bottoms 2 & 4 nearly identical (≤1.5% difference by default)
✅ Point 3 higher than both bottoms
✅ Neither bottom is broken during formation
✅ Sufficient time between points (≥10 candles by default)
✅ Success Scenario
→ Price breaks above the neckline (Point 3)
→ Point 5 is plotted at breakout candle
→ Dashed vertical line drawn from Point 5 to target
→ Horizontal dashed line tracks price toward target
→ Dashboard shows: Pattern Type | Quality | Rating | Target | Status
→ When target hits: line turns green + ✅ appears
🎯 Target Calculation
Pattern Height = Point 3 − Point 4
• Conservative: Point 3 + (Height × 0.618 × Quality Factor)
• Balanced: Point 3 + (Height × 1.0 × Quality Factor)
• Aggressive: Point 3 + (Height × 1.618 × Quality Factor)
❌ Failure Scenario
→ Price breaks below both Bottom 1 or Bottom 2 before neckline breakout
Visual Changes:
All lines turn red
Red ✖ appears at breakdown candle
Neckline stops expanding
Red dashed vertical line from breakdown point to bearish target
Red horizontal tracking line follows price
Dashboard updates to:
⚠ Failed Bottom – Bearish
→ Shows new bearish target
→ Indicates target mode for failure case
→ Status: Bearish Reversal
→ Fully red display
🟥 Double Top Pattern
Sequence of points:
🔹 Point 1: Trough marking the start of a strong uptrend
🔹 Point 2 (Top 1): First peak — first key resistance
🔹 Point 3: Intermediate low — forms the neckline (support)
🔹 Point 4 (Top 2): Second peak — should closely match Top 1
🔹 Point 5: Breakdown point — pattern confirmation
Mandatory Conditions:
✅ Clear uptrend before Point 2
✅ Tops 2 & 4 nearly identical (≤1.5% difference by default)
✅ Point 3 lower than both tops
✅ Neither top is breached during formation
✅ Sufficient time between points (≥10 candles by default)
✅ Success Scenario
→ Price breaks below the neckline (Point 3)
→ Point 5 is plotted at breakdown candle
→ Dashed vertical line drawn to target
→ Horizontal tracking line moves with price
→ Dashboard updates accordingly
→ Green line + ✅ on hit
🎯 Target Calculation
Pattern Height = Point 4 − Point 3
• Conservative: Point 3 − (Height × 0.618 × Quality Factor)
• Balanced: Point 3 − (Height × 1.0 × Quality Factor)
• Aggressive: Point 3 − (Height × 1.618 × Quality Factor)
❌ Failure Scenario
→ Price breaks above either Top 1 or Top 2 before neckline breakdown
Visual Changes:
All lines turn cyan (light blue)
Cyan ✖ appears at breakout candle
Neckline stops expanding
Cyan dashed vertical line to bullish target
Cyan horizontal tracking line follows price
Dashboard updates to:
⚠ Failed Top – Bullish
→ Shows new bullish target
→ Indicates target mode for failure case
→ Status: Bullish Reversal
→ Fully cyan display
🎯 Upside Target (after Double Top failure)
Max Top = max(Point 2, Point 4)
Height = Max Top − Point 3
• Conservative: Max Top + (Height × 0.618)
• Balanced: Max Top + (Height × 1.0)
• Aggressive: Max Top + (Height × 1.618)
📊 Quality Scoring System (0–100)
1️⃣ Symmetry (30%)
Measures price match between the two bottoms or two tops.
High score (25–30): Near-perfect symmetry → very strong pattern
Medium (15–24): Good match → reliable signal
Low (5–14): Weak symmetry → use caution
Zero: No symmetry → invalid pattern
2️⃣ Trend Strength (20%)
Uses ADX and DI indicators.
20 pts: Strong trend confirmed (e.g., ADX ≥ 20 + correct DI alignment)
10 pts: Trend filter disabled
6 pts: Weak or sideways trend
3️⃣ Volume Behavior (20%)
Declining volume on second touch is a positive sign (shows exhaustion).
15–20 pts: Clear volume drop → strong signal
10 pts: Neutral volume
6 pts: Rising volume → higher risk of continuation
4️⃣ Pattern Depth (15%)
Deeper patterns = stronger reversals.
12–15 pts: Deep → high reversal power
8–11 pts: Medium → acceptable
<8 pts: Shallow → weak signal
5️⃣ Structural Integrity (15%)
Checks logical structure (e.g., Point 1 > Point 3 in Double Bottom).
12–15 pts: Ideal structure
8–11 pts: Minor flaws
<8 pts: Poor setup
📈 Final Quality Rating & Colors
• 85–100 → ⭐ Excellent
→ Double Bottom: Cyan #00BCD4
→ Double Top: Light Red #FF5252
• 75–84 → ✨ Very Good
• 65–74 → ✓ Good
• 60–64 → ○ Acceptable
→ All use Amber #FFC107
• <60 → ❌ Rejected (not shown)
→ Gray #9E9E9E
🔧 Dynamic Filters
1️⃣ ATR Filter (Volatility Check)
Rejects patterns in abnormally high volatility periods.
→ If current ATR > 1.8 × 50-period ATR MA → pattern rejected
✅ Recommended for crypto, small caps
❌ Optional for calm markets (gold, bonds)
2️⃣ ADX Filter (Trend Confirmation)
Ensures a real trend exists before the pattern.
→ If ADX < 14 (70% of default 20) → pattern rejected
✅ Strongly recommended (keep ON)
3️⃣ Volume Filter (Behavior Validation)
Not used to reject patterns, but strongly affects quality score.
✅ Best for liquid markets (Forex majors, large stocks)
❌ Optional for illiquid assets
⚙️ Key Settings Explained
🔘 General Settings
• Language: Arabic / English
• Show Previous Patterns: Yes / No
→ “No” keeps chart clean; “Yes” for historical review
🔘 Pattern Selection
• Enable Double Bottom: ✅ / ❌
• Enable Double Top: ✅ / ❌
→ Use combinations:
✅✅ → Full reversal scanning
✅❌ → Long setups only
❌✅ → Short setups only
❌❌ → Indicator OFF
🔘 Detection Parameters
• Pivots Left (1–20): Higher = more reliable, fewer patterns
• Pivots Right (1–20): Lower = faster signals
• Min Width (5–100): Min candles between Bottom/Top 1 & 2
• Tolerance % (0.1%–5%): Max allowed price difference
• Min Arm (5–50): Min candles between pivot & neckline
• Min Trend (5–50): Min candles in prior trend
• Trend Lookback (50–500): How far back to detect trend start
• Extension Multiplier (1.0–5.0): How long to wait for breakout
🔘 Quality Settings
• Min Quality Score (0–100):
→ Conservative: 75–85
→ Balanced: 60–70
→ Flexible: 50–55
• Custom Weights: Adjust based on market (e.g., increase Volume weight in Forex)
🔘 Target Settings
• Bottom Bullish Target: Conservative / Balanced / Aggressive
• Bottom Bearish Target: (used on failure)
• Top Bearish Target: Conservative / Balanced / Aggressive
• Top Bullish Target: (used on failure)
🔘 Visual Settings
• Label Size: Small / Normal / Large / Huge
• Pattern Colors: Fully customizable
• Table: Show/Hide + Size (Small/Normal/Large) + Position (Top-Right / Top-Left / Bottom-Right / Bottom-Left)
• Fill Transparency: 70%–95% (default: 85%)
🔔 Alert System (8 Independent Alerts)
📌 Double Bottom Alerts
Bullish Breakout → “Double Bottom Breakout – Bullish!”
Bullish Target Hit → “Bullish Target Achieved!”
Failure (Bearish) → “Double Bottom Failed – Bearish!”
Bearish Target Hit → “Bearish Target Achieved (Failure)!”
📌 Double Top Alerts
Bearish Breakdown → “Double Top Breakdown – Bearish!”
Bearish Target Hit → “Bearish Target Achieved!”
Failure (Bullish) → “Double Top Failed – Bullish!”
Bullish Target Hit → “Bullish Target Achieved (Failure)!”
Each alert can be enabled/disabled independently and supports pop-ups, emails, or webhooks.
⚠️ Disclaimer:
This indicator is for educational and analytical purposes only. It does not constitute financial, investment, or trading advice. Use it in conjunction with your own strategy and risk management. Neither TradingView nor the developer is liable for any financial decisions or losses.

Hellenic EMA Matrix - PremiumHellenic EMA Matrix - Alpha Omega Premium
Complete User Guide
Table of Contents
Introduction
Indicator Philosophy
Mathematical Constants
EMA Types
Settings
Trading Signals
Visualization
Usage Strategies
FAQ
Introduction
Hellenic EMA Matrix is a premium indicator based on mathematical constants of nature: Phi (Phi - Golden Ratio), Pi (Pi), e (Euler's number). The indicator uses these universal constants to create dynamic EMAs that adapt to the natural rhythms of the market.
Key Features:
6 EMA types based on mathematical constants
Premium visualization with Neon Glow and Gradient Clouds
Automatic Fast/Mid/Slow EMA sorting
STRONG signals for powerful trends
Pulsing Ribbon Bar for instant trend assessment
Works on all timeframes (M1 - MN)
Indicator Philosophy
Why Mathematical Constants?
Traditional EMAs use arbitrary periods (9, 21, 50, 200). Hellenic Matrix goes further, using universal mathematical constants found in nature:
Phi (1.618) - Golden Ratio: galaxy spirals, seashells, human body proportions
Pi (3.14159) - Pi: circles, waves, cycles
e (2.71828) - Natural logarithm base: exponential growth, radioactive decay
Markets are also a natural system composed of millions of participants. Using mathematical constants allows tuning into the natural rhythms of market cycles.
Mathematical Constants
Phi (Phi) - Golden Ratio
Phi = 1.618033988749895
Properties:
Phi² = Phi + 1 = 2.618
Phi³ = 4.236
Phi⁴ = 6.854
Application: Ideal for trending movements and Fibonacci corrections
Pi (Pi) - Pi Number
Pi = 3.141592653589793
Properties:
2Pi = 6.283 (full circle)
3Pi = 9.425
4Pi = 12.566
Application: Excellent for cyclical markets and wave structures
e (Euler) - Euler's Number
e = 2.718281828459045
Properties:
e² = 7.389
e³ = 20.085
e⁴ = 54.598
Application: Suitable for exponential movements and volatile markets
EMA Types
1. Phi (Phi) - Golden Ratio EMA
Description: EMA based on the golden ratio
Period Formula:
Period = Phi^n × Base Multiplier
Parameters:
Phi Power Level (1-8): Power of Phi
Phi¹ = 1.618 → ~16 period (with Base=10)
Phi² = 2.618 → ~26 period
Phi³ = 4.236 → ~42 period (recommended)
Phi⁴ = 6.854 → ~69 period
Recommendations:
Phi² or Phi³ for day trading
Phi⁴ or Phi⁵ for swing trading
Works excellently as Fast EMA
2. Pi (Pi) - Circular EMA
Description: EMA based on Pi for cyclical movements
Period Formula:
Period = Pi × Multiple × Base Multiplier
Parameters:
Pi Multiple (1-10): Pi multiplier
1Pi = 3.14 → ~31 period (with Base=10)
2Pi = 6.28 → ~63 period (recommended)
3Pi = 9.42 → ~94 period
Recommendations:
2Pi ideal as Mid or Slow EMA
Excellently identifies cycles and waves
Use on volatile markets (crypto, forex)
3. e (Euler) - Natural EMA
Description: EMA based on natural logarithm
Period Formula:
Period = e^n × Base Multiplier
Parameters:
e Power Level (1-6): Power of e
e¹ = 2.718 → ~27 period (with Base=10)
e² = 7.389 → ~74 period (recommended)
e³ = 20.085 → ~201 period
Recommendations:
e² works excellently as Slow EMA
Ideal for stocks and indices
Filters noise well on lower timeframes
4. Delta (Delta) - Adaptive EMA
Description: Adaptive EMA that changes period based on volatility
Period Formula:
Period = Base Period × (1 + (Volatility - 1) × Factor)
Parameters:
Delta Base Period (5-200): Base period (default 20)
Delta Volatility Sensitivity (0.5-5.0): Volatility sensitivity (default 2.0)
How it works:
During low volatility → period decreases → EMA reacts faster
During high volatility → period increases → EMA smooths noise
Recommendations:
Works excellently on news and sharp movements
Use as Fast EMA for quick adaptation
Sensitivity 2.0-3.0 for crypto, 1.0-2.0 for stocks
5. Sigma (Sigma) - Composite EMA
Description: Composite EMA combining multiple active EMAs
Composition Methods:
Weighted Average (default):
Sigma = (Phi + Pi + e + Delta) / 4
Simple average of all active EMAs
Geometric Mean:
Sigma = fourth_root(Phi × Pi × e × Delta)
Geometric mean (more conservative)
Harmonic Mean:
Sigma = 4 / (1/Phi + 1/Pi + 1/e + 1/Delta)
Harmonic mean (more weight to smaller values)
Recommendations:
Enable for additional confirmation
Use as Mid EMA
Weighted Average - most universal method
6. Lambda (Lambda) - Wave EMA
Description: Wave EMA with sinusoidal period modulation
Period Formula:
Period = Base Period × (1 + Amplitude × sin(2Pi × bar / Frequency))
Parameters:
Lambda Base Period (10-200): Base period
Lambda Wave Amplitude (0.1-2.0): Wave amplitude
Lambda Wave Frequency (10-200): Wave frequency in bars
How it works:
Period pulsates sinusoidally
Creates wave effect following market cycles
Recommendations:
Experimental EMA for advanced users
Works well on cyclical markets
Frequency = 50 for day trading, 100+ for swing
Settings
Matrix Core Settings
Base Multiplier (1-100)
Multiplies all EMA periods
Base = 1: Very fast EMAs (Phi³ = 4, 2Pi = 6, e² = 7)
Base = 10: Standard (Phi³ = 42, 2Pi = 63, e² = 74)
Base = 20: Slow EMAs (Phi³ = 85, 2Pi = 126, e² = 148)
Recommendations by timeframe:
M1-M5: Base = 5-10
M15-H1: Base = 10-15 (recommended)
H4-D1: Base = 15-25
W1-MN: Base = 25-50
Matrix Source
Data source selection for EMA calculation:
close - closing price (standard)
open - opening price
high - high
low - low
hl2 - (high + low) / 2
hlc3 - (high + low + close) / 3
ohlc4 - (open + high + low + close) / 4
When to change:
hlc3 or ohlc4 for smoother signals
high for aggressive longs
low for aggressive shorts
Manual EMA Selection
Critically important setting! Determines which EMAs are used for signal generation.
Use Manual Fast/Slow/Mid Selection
Enabled (default): You select EMAs manually
Disabled: Automatic selection by periods
Fast EMA
Fast EMA - reacts first to price changes
Recommendations:
Phi Golden (recommended) - universal choice
Delta Adaptive - for volatile markets
Must be fastest (smallest period)
Slow EMA
Slow EMA - determines main trend
Recommendations:
Pi Circular (recommended) - excellent trend filter
e Natural - for smoother trend
Must be slowest (largest period)
Mid EMA
Mid EMA - additional signal filter
Recommendations:
e Natural (recommended) - excellent middle level
Pi Circular - alternative
None - for more frequent signals (only 2 EMAs)
IMPORTANT: The indicator automatically sorts selected EMAs by their actual periods:
Fast = EMA with smallest period
Mid = EMA with middle period
Slow = EMA with largest period
Therefore, you can select any combination - the indicator will arrange them correctly!
Premium Visualization
Neon Glow
Enable Neon Glow for EMAs - adds glowing effect around EMA lines
Glow Strength:
Light - subtle glow
Medium (recommended) - optimal balance
Strong - bright glow (may be too bright)
Effect: 2 glow layers around each EMA for 3D effect
Gradient Clouds
Enable Gradient Clouds - fills space between EMAs with gradient
Parameters:
Cloud Transparency (85-98): Cloud transparency
95-97 (recommended)
Higher = more transparent
Dynamic Cloud Intensity - automatically changes transparency based on EMA distance
Cloud Colors:
Phi-Pi Cloud:
Blue - when Pi above Phi (bullish)
Gold - when Phi above Pi (bearish)
Pi-e Cloud:
Green - when e above Pi (bullish)
Blue - when Pi above e (bearish)
2 layers for volumetric effect
Pulsing Ribbon Bar
Enable Pulsing Indicator Bar - pulsing strip at bottom/top of chart
Parameters:
Ribbon Position: Top / Bottom (recommended)
Pulse Speed: Slow / Medium (recommended) / Fast
Symbols and colors:
Green filled square - STRONG BULLISH
Pink filled square - STRONG BEARISH
Blue hollow square - Bullish (regular)
Red hollow square - Bearish (regular)
Purple rectangle - Neutral
Effect: Pulsation with sinusoid for living market feel
Signal Bar Highlights
Enable Signal Bar Highlights - highlights bars with signals
Parameters:
Highlight Transparency (88-96): Highlight transparency
Highlight Style:
Light Fill (recommended) - bar background fill
Thin Line - bar outline only
Highlights:
Golden Cross - green
Death Cross - pink
STRONG BUY - green
STRONG SELL - pink
Show Greek Labels
Shows Greek alphabet letters on last bar:
Phi - Phi EMA (gold)
Pi - Pi EMA (blue)
e - Euler EMA (green)
Delta - Delta EMA (purple)
Sigma - Sigma EMA (pink)
When to use: For education or presentations
Show Old Background
Old background style (not recommended):
Green background - STRONG BULLISH
Pink background - STRONG BEARISH
Blue background - Bullish
Red background - Bearish
Not recommended - use new Gradient Clouds and Pulsing Bar
Info Table
Show Info Table - table with indicator information
Parameters:
Position: Top Left / Top Right (recommended) / Bottom Left / Bottom Right
Size: Tiny / Small (recommended) / Normal / Large
Table contents:
EMA list - periods and current values of all active EMAs
Effects - active visual effects
TREND - current trend state:
STRONG UP - strong bullish
STRONG DOWN - strong bearish
Bullish - regular bullish
Bearish - regular bearish
Neutral - neutral
Momentum % - percentage deviation of price from Fast EMA
Setup - current Fast/Slow/Mid configuration
Trading Signals
Show Golden/Death Cross
Golden Cross - Fast EMA crosses Slow EMA from below (bullish signal) Death Cross - Fast EMA crosses Slow EMA from above (bearish signal)
Symbols:
Yellow dot "GC" below - Golden Cross
Dark red dot "DC" above - Death Cross
Show STRONG Signals
STRONG BUY and STRONG SELL - the most powerful indicator signals
Conditions for STRONG BULLISH:
EMA Alignment: Fast > Mid > Slow (all EMAs aligned)
Trend: Fast > Slow (clear uptrend)
Distance: EMAs separated by minimum 0.15%
Price Position: Price above Fast EMA
Fast Slope: Fast EMA rising
Slow Slope: Slow EMA rising
Mid Trending: Mid EMA also rising (if enabled)
Conditions for STRONG BEARISH:
Same but in reverse
Visual display:
Green label "STRONG BUY" below bar
Pink label "STRONG SELL" above bar
Difference from Golden/Death Cross:
Golden/Death Cross = crossing moment (1 bar)
STRONG signal = sustained trend (lasts several bars)
IMPORTANT: After fixes, STRONG signals now:
Work on all timeframes (M1 to MN)
Don't break on small retracements
Work with any Fast/Mid/Slow combination
Automatically adapt thanks to EMA sorting
Show Stop Loss/Take Profit
Automatic SL/TP level calculation on STRONG signal
Parameters:
Stop Loss (ATR) (0.5-5.0): ATR multiplier for stop loss
1.5 (recommended) - standard
1.0 - tight stop
2.0-3.0 - wide stop
Take Profit R:R (1.0-5.0): Risk/reward ratio
2.0 (recommended) - standard (risk 1.5 ATR, profit 3.0 ATR)
1.5 - conservative
3.0-5.0 - aggressive
Formulas:
LONG:
Stop Loss = Entry - (ATR × Stop Loss ATR)
Take Profit = Entry + (ATR × Stop Loss ATR × Take Profit R:R)
SHORT:
Stop Loss = Entry + (ATR × Stop Loss ATR)
Take Profit = Entry - (ATR × Stop Loss ATR × Take Profit R:R)
Visualization:
Red X - Stop Loss
Green X - Take Profit
Levels remain active while STRONG signal persists
Trading Signals
Signal Types
1. Golden Cross
Description: Fast EMA crosses Slow EMA from below
Signal: Beginning of bullish trend
How to trade:
ENTRY: On bar close with Golden Cross
STOP: Below local low or below Slow EMA
TARGET: Next resistance level or 2:1 R:R
Strengths:
Simple and clear
Works well on trending markets
Clear entry point
Weaknesses:
Lags (signal after movement starts)
Many false signals in ranging markets
May be late on fast moves
Optimal timeframes: H1, H4, D1
2. Death Cross
Description: Fast EMA crosses Slow EMA from above
Signal: Beginning of bearish trend
How to trade:
ENTRY: On bar close with Death Cross
STOP: Above local high or above Slow EMA
TARGET: Next support level or 2:1 R:R
Application: Mirror of Golden Cross
3. STRONG BUY
Description: All EMAs aligned + trend + all EMAs rising
Signal: Powerful bullish trend
How to trade:
ENTRY: On bar close with STRONG BUY or on pullback to Fast EMA
STOP: Below Fast EMA or automatic SL (if enabled)
TARGET: Automatic TP (if enabled) or by levels
TRAILING: Follow Fast EMA
Entry strategies:
Aggressive: Enter immediately on signal
Conservative: Wait for pullback to Fast EMA, then enter on bounce
Pyramiding: Add positions on pullbacks to Mid EMA
Position management:
Hold while STRONG signal active
Exit on STRONG SELL or Death Cross appearance
Move stop behind Fast EMA
Strengths:
Most reliable indicator signal
Doesn't break on pullbacks
Catches large moves
Works on all timeframes
Weaknesses:
Appears less frequently than other signals
Requires confirmation (multiple conditions)
Optimal timeframes: All (M5 - D1)
4. STRONG SELL
Description: All EMAs aligned down + downtrend + all EMAs falling
Signal: Powerful bearish trend
How to trade: Mirror of STRONG BUY
Visual Signals
Pulsing Ribbon Bar
Quick market assessment at a glance:
Symbol Color State
Filled square Green STRONG BULLISH
Filled square Pink STRONG BEARISH
Hollow square Blue Bullish
Hollow square Red Bearish
Rectangle Purple Neutral
Pulsation: Sinusoidal, creates living effect
Signal Bar Highlights
Bars with signals are highlighted:
Green highlight: STRONG BUY or Golden Cross
Pink highlight: STRONG SELL or Death Cross
Gradient Clouds
Colored space between EMAs shows trend strength:
Wide clouds - strong trend
Narrow clouds - weak trend or consolidation
Color change - trend change
Info Table
Quick reference in corner:
TREND: Current state (STRONG UP, Bullish, Neutral, Bearish, STRONG DOWN)
Momentum %: Movement strength
Effects: Active visual effects
Setup: Fast/Slow/Mid configuration
Usage Strategies
Strategy 1: "Golden Trailing"
Idea: Follow STRONG signals using Fast EMA as trailing stop
Settings:
Fast: Phi Golden (Phi³)
Mid: Pi Circular (2Pi)
Slow: e Natural (e²)
Base Multiplier: 10
Timeframe: H1, H4
Entry rules:
Wait for STRONG BUY
Enter on bar close or on pullback to Fast EMA
Stop below Fast EMA
Management:
Hold position while STRONG signal active
Move stop behind Fast EMA daily
Exit on STRONG SELL or Death Cross
Take Profit:
Partially close at +2R
Trail remainder until exit signal
For whom: Swing traders, trend followers
Pros:
Catches large moves
Simple rules
Emotionally comfortable
Cons:
Requires patience
Possible extended drawdowns on pullbacks
Strategy 2: "Scalping Bounces"
Idea: Scalp bounces from Fast EMA during STRONG trend
Settings:
Fast: Delta Adaptive (Base 15, Sensitivity 2.0)
Mid: Phi Golden (Phi²)
Slow: Pi Circular (2Pi)
Base Multiplier: 5
Timeframe: M5, M15
Entry rules:
STRONG signal must be active
Wait for price pullback to Fast EMA
Enter on bounce (candle closes above/below Fast EMA)
Stop behind local extreme (15-20 pips)
Take Profit:
+1.5R or to Mid EMA
Or to next level
For whom: Active day traders
Pros:
Many signals
Clear entry point
Quick profits
Cons:
Requires constant monitoring
Not all bounces work
Requires discipline for frequent trading
Strategy 3: "Triple Filter"
Idea: Enter only when all 3 EMAs and price perfectly aligned
Settings:
Fast: Phi Golden (Phi³)
Mid: e Natural (e²)
Slow: Pi Circular (3Pi)
Base Multiplier: 15
Timeframe: H4, D1
Entry rules (LONG):
STRONG BUY active
Price above all three EMAs
Fast > Mid > Slow (all aligned)
All EMAs rising (slope up)
Gradient Clouds wide and bright
Entry:
On bar close meeting all conditions
Or on next pullback to Fast EMA
Stop:
Below Mid EMA or -1.5 ATR
Take Profit:
First target: +3R
Second target: next major level
Trailing: Mid EMA
For whom: Conservative swing traders, investors
Pros:
Very reliable signals
Minimum false entries
Large profit potential
Cons:
Rare signals (2-5 per month)
Requires patience
Strategy 4: "Adaptive Scalper"
Idea: Use only Delta Adaptive EMA for quick volatility reaction
Settings:
Fast: Delta Adaptive (Base 10, Sensitivity 3.0)
Mid: None
Slow: Delta Adaptive (Base 30, Sensitivity 2.0)
Base Multiplier: 3
Timeframe: M1, M5
Feature: Two different Delta EMAs with different settings
Entry rules:
Golden Cross between two Delta EMAs
Both Delta EMAs must be rising/falling
Enter on next bar
Stop:
10-15 pips or below Slow Delta EMA
Take Profit:
+1R to +2R
Or Death Cross
For whom: Scalpers on cryptocurrencies and forex
Pros:
Instant volatility adaptation
Many signals on volatile markets
Quick results
Cons:
Much noise on calm markets
Requires fast execution
High commissions may eat profits
Strategy 5: "Cyclical Trader"
Idea: Use Pi and Lambda for trading cyclical markets
Settings:
Fast: Pi Circular (1Pi)
Mid: Lambda Wave (Base 30, Amplitude 0.5, Frequency 50)
Slow: Pi Circular (3Pi)
Base Multiplier: 10
Timeframe: H1, H4
Entry rules:
STRONG signal active
Lambda Wave EMA synchronized with trend
Enter on bounce from Lambda Wave
For whom: Traders of cyclical assets (some altcoins, commodities)
Pros:
Catches cyclical movements
Lambda Wave provides additional entry points
Cons:
More complex to configure
Not for all markets
Lambda Wave may give false signals
Strategy 6: "Multi-Timeframe Confirmation"
Idea: Use multiple timeframes for confirmation
Scheme:
Higher TF (D1): Determine trend direction (STRONG signal)
Middle TF (H4): Wait for STRONG signal in same direction
Lower TF (M15): Look for entry point (Golden Cross or bounce from Fast EMA)
Settings for all TFs:
Fast: Phi Golden (Phi³)
Mid: e Natural (e²)
Slow: Pi Circular (2Pi)
Base Multiplier: 10
Rules:
All 3 TFs must show one trend
Entry on lower TF
Stop by lower TF
Target by higher TF
For whom: Serious traders and investors
Pros:
Maximum reliability
Large profit targets
Minimum false signals
Cons:
Rare setups
Requires analysis of multiple charts
Experience needed
Practical Tips
DOs
Use STRONG signals as primary - they're most reliable
Let signals develop - don't exit on first pullback
Use trailing stop - follow Fast EMA
Combine with levels - S/R, Fibonacci, volumes
Test on demo before real
Adjust Base Multiplier for your timeframe
Enable visual effects - they help see the picture
Use Info Table - quick situation assessment
Watch Pulsing Bar - instant state indicator
Trust auto-sorting of Fast/Mid/Slow
DON'Ts
Don't trade against STRONG signal - trend is your friend
Don't ignore Mid EMA - it adds reliability
Don't use too small Base Multiplier on higher TFs
Don't enter on Golden Cross in range - check for trend
Don't change settings during open position
Don't forget risk management - 1-2% per trade
Don't trade all signals in row - choose best ones
Don't use indicator in isolation - combine with Price Action
Don't set too tight stops - let trade breathe
Don't over-optimize - simplicity = reliability
Optimal Settings by Asset
US Stocks (SPY, AAPL, TSLA)
Recommendation:
Fast: Phi Golden (Phi³)
Mid: e Natural (e²)
Slow: Pi Circular (2Pi)
Base: 10-15
Timeframe: H4, D1
Features:
Use on daily for swing
STRONG signals very reliable
Works well on trending stocks
Forex (EUR/USD, GBP/USD)
Recommendation:
Fast: Delta Adaptive (Base 15, Sens 2.0)
Mid: Phi Golden (Phi²)
Slow: Pi Circular (2Pi)
Base: 8-12
Timeframe: M15, H1, H4
Features:
Delta Adaptive works excellently on news
Many signals on M15-H1
Consider spreads
Cryptocurrencies (BTC, ETH, altcoins)
Recommendation:
Fast: Delta Adaptive (Base 10, Sens 3.0)
Mid: Pi Circular (2Pi)
Slow: e Natural (e²)
Base: 5-10
Timeframe: M5, M15, H1
Features:
High volatility - adaptation needed
STRONG signals can last days
Be careful with scalping on M1-M5
Commodities (Gold, Oil)
Recommendation:
Fast: Pi Circular (1Pi)
Mid: Phi Golden (Phi³)
Slow: Pi Circular (3Pi)
Base: 12-18
Timeframe: H4, D1
Features:
Pi works excellently on cyclical commodities
Gold responds especially well to Phi
Oil volatile - use wide stops
Indices (S&P500, Nasdaq, DAX)
Recommendation:
Fast: Phi Golden (Phi³)
Mid: e Natural (e²)
Slow: Pi Circular (2Pi)
Base: 15-20
Timeframe: H4, D1, W1
Features:
Very trending instruments
STRONG signals last weeks
Good for position trading
Alerts
The indicator supports 6 alert types:
1. Golden Cross
Message: "Hellenic Matrix: GOLDEN CROSS - Fast EMA crossed above Slow EMA - Bullish trend starting!"
When: Fast EMA crosses Slow EMA from below
2. Death Cross
Message: "Hellenic Matrix: DEATH CROSS - Fast EMA crossed below Slow EMA - Bearish trend starting!"
When: Fast EMA crosses Slow EMA from above
3. STRONG BULLISH
Message: "Hellenic Matrix: STRONG BULLISH SIGNAL - All EMAs aligned for powerful uptrend!"
When: All conditions for STRONG BUY met (first bar)
4. STRONG BEARISH
Message: "Hellenic Matrix: STRONG BEARISH SIGNAL - All EMAs aligned for powerful downtrend!"
When: All conditions for STRONG SELL met (first bar)
5. Bullish Ribbon
Message: "Hellenic Matrix: BULLISH RIBBON - EMAs aligned for uptrend"
When: EMAs aligned bullish + price above Fast EMA (less strict condition)
6. Bearish Ribbon
Message: "Hellenic Matrix: BEARISH RIBBON - EMAs aligned for downtrend"
When: EMAs aligned bearish + price below Fast EMA (less strict condition)
How to Set Up Alerts:
Open indicator on chart
Click on three dots next to indicator name
Select "Create Alert"
In "Condition" field select needed alert:
Golden Cross
Death Cross
STRONG BULLISH
STRONG BEARISH
Bullish Ribbon
Bearish Ribbon
Configure notification method:
Pop-up in browser
Email
SMS (in Premium accounts)
Push notifications in mobile app
Webhook (for automation)
Select frequency:
Once Per Bar Close (recommended) - once on bar close
Once Per Bar - during bar formation
Only Once - only first time
Click "Create"
Tip: Create separate alerts for different timeframes and instruments
FAQ
1. Why don't STRONG signals appear?
Possible reasons:
Incorrect Fast/Mid/Slow order
Solution: Indicator automatically sorts EMAs by periods, but ensure selected EMAs have different periods
Base Multiplier too large
Solution: Reduce Base to 5-10 on lower timeframes
Market in range
Solution: STRONG signals appear only in trends - this is normal
Too strict EMA settings
Solution: Try classic combination: Phi³ / Pi×2 / e² with Base=10
Mid EMA too close to Fast or Slow
Solution: Select Mid EMA with period between Fast and Slow
2. How often should STRONG signals appear?
Normal frequency:
M1-M5: 5-15 signals per day (very active markets)
M15-H1: 2-8 signals per day
H4: 3-10 signals per week
D1: 2-5 signals per month
W1: 2-6 signals per year
If too many signals - market very volatile or Base too small
If too few signals - market in range or Base too large
4. What are the best settings for beginners?
Universal "out of the box" settings:
Matrix Core:
Base Multiplier: 10
Source: close
Phi Golden: Enabled, Power = 3
Pi Circular: Enabled, Multiple = 2
e Natural: Enabled, Power = 2
Delta Adaptive: Enabled, Base = 20, Sensitivity = 2.0
Manual Selection:
Fast: Phi Golden
Mid: e Natural
Slow: Pi Circular
Visualization:
Gradient Clouds: ON
Neon Glow: ON (Medium)
Pulsing Bar: ON (Medium)
Signal Highlights: ON (Light Fill)
Table: ON (Top Right, Small)
Signals:
Golden/Death Cross: ON
STRONG Signals: ON
Stop Loss: OFF (while learning)
Timeframe for learning: H1 or H4
5. Can I use only one EMA?
No, minimum 2 EMAs (Fast and Slow) for signal generation.
Mid EMA is optional:
With Mid EMA = more reliable but rarer signals
Without Mid EMA = more signals but less strict filtering
Recommendation: Start with 3 EMAs (Fast/Mid/Slow), then experiment
6. Does the indicator work on cryptocurrencies?
Yes, works excellently! Especially good on:
Bitcoin (BTC)
Ethereum (ETH)
Major altcoins (SOL, BNB, XRP)
Recommended settings for crypto:
Fast: Delta Adaptive (Base 10-15, Sensitivity 2.5-3.0)
Mid: Pi Circular (2Pi)
Slow: e Natural (e²)
Base: 5-10
Timeframe: M15, H1, H4
Crypto market features:
High volatility → use Delta Adaptive
24/7 trading → set alerts
Sharp movements → wide stops
7. Can I trade only with this indicator?
Technically yes, but NOT recommended.
Best approach - combine with:
Price Action - support/resistance levels, candle patterns
Volume - movement strength confirmation
Fibonacci - retracement and extension levels
RSI/MACD - divergences and overbought/oversold
Fundamental analysis - news, company reports
Hellenic Matrix:
Excellently determines trend and its strength
Provides clear entry/exit points
Doesn't consider fundamentals
Doesn't see major levels
8. Why do Gradient Clouds change color?
Color depends on EMA order:
Phi-Pi Cloud:
Blue - Pi EMA above Phi EMA (bullish alignment)
Gold - Phi EMA above Pi EMA (bearish alignment)
Pi-e Cloud:
Green - e EMA above Pi EMA (bullish alignment)
Blue - Pi EMA above e EMA (bearish alignment)
Color change = EMA order change = possible trend change
9. What is Momentum % in the table?
Momentum % = percentage deviation of price from Fast EMA
Formula:
Momentum = ((Close - Fast EMA) / Fast EMA) × 100
Interpretation:
+0.5% to +2% - normal bullish momentum
+2% to +5% - strong bullish momentum
+5% and above - overheating (correction possible)
-0.5% to -2% - normal bearish momentum
-2% to -5% - strong bearish momentum
-5% and below - oversold (bounce possible)
Usage:
Monitor momentum during STRONG signals
Large momentum = don't enter (wait for pullback)
Small momentum = good entry point
10. How to configure for scalping?
Settings for scalping (M1-M5):
Base Multiplier: 3-5
Source: close or hlc3 (smoother)
Fast: Delta Adaptive (Base 8-12, Sensitivity 3.0)
Mid: None (for more signals)
Slow: Phi Golden (Phi²) or Pi Circular (1Pi)
Visualization:
- Gradient Clouds: ON (helps see strength)
- Neon Glow: OFF (doesn't clutter chart)
- Pulsing Bar: ON (quick assessment)
- Signal Highlights: ON
Signals:
- Golden/Death Cross: ON
- STRONG Signals: ON
- Stop Loss: ON (1.0-1.5 ATR, R:R 1.5-2.0)
Scalping rules:
Trade only STRONG signals
Enter on bounce from Fast EMA
Tight stops (10-20 pips)
Quick take profit (+1R to +2R)
Don't hold through news
11. How to configure for long-term investing?
Settings for investing (D1-W1):
Base Multiplier: 20-30
Source: close
Fast: Phi Golden (Phi³ or Phi⁴)
Mid: e Natural (e²)
Slow: Pi Circular (3Pi or 4Pi)
Visualization:
- Gradient Clouds: ON
- Neon Glow: ON (Medium)
- Everything else - to taste
Signals:
- Golden/Death Cross: ON
- STRONG Signals: ON
- Stop Loss: OFF (use percentage stop)
Investing rules:
Enter only on STRONG signals
Hold while STRONG active (weeks/months)
Stop below Slow EMA or -10%
Take profit: by company targets or +50-100%
Ignore short-term pullbacks
12. What if indicator slows down chart?
Indicator is optimized, but if it slows:
Disable unnecessary visual effects:
Neon Glow: OFF (saves 8 plots)
Gradient Clouds: ON but low quality
Lambda Wave EMA: OFF (if not using)
Reduce number of active EMAs:
Sigma Composite: OFF
Lambda Wave: OFF
Leave only Phi, Pi, e, Delta
Simplify settings:
Pulsing Bar: OFF
Greek Labels: OFF
Info Table: smaller size
13. Can I use on different timeframes simultaneously?
Yes! Multi-timeframe analysis is very powerful:
Classic scheme:
Higher TF (D1, W1) - determine global trend
Wait for STRONG signal
This is our trading direction
Middle TF (H4, H1) - look for confirmation
STRONG signal in same direction
Precise entry zone
Lower TF (M15, M5) - entry point
Golden Cross or bounce from Fast EMA
Precise stop loss
Example:
W1: STRONG BUY active (global uptrend)
H4: STRONG BUY appeared (confirmation)
M15: Wait for Golden Cross or bounce from Fast EMA → ENTRY
Advantages:
Maximum reliability
Clear timeframe hierarchy
Large targets
14. How does indicator work on news?
Delta Adaptive EMA adapts excellently to news:
Before news:
Low volatility → Delta EMA becomes fast → pulls to price
During news:
Sharp volatility spike → Delta EMA slows → filters noise
After news:
Volatility normalizes → Delta EMA returns to normal
Recommendations:
Don't trade at news release moment (spreads widen)
Wait for STRONG signal after news (2-5 bars)
Use Delta Adaptive as Fast EMA for quick reaction
Widen stops by 50-100% during important news
Advanced Techniques
Technique 1: "Divergences with EMA"
Idea: Look for discrepancies between price and Fast EMA
Bullish divergence:
Price makes lower low
Fast EMA makes higher low
= Possible reversal up
Bearish divergence:
Price makes higher high
Fast EMA makes lower high
= Possible reversal down
How to trade:
Find divergence
Wait for STRONG signal in divergence direction
Enter on confirmation
Technique 2: "EMA Tunnel"
Idea: Use space between Fast and Slow EMA as "tunnel"
Rules:
Wide tunnel - strong trend, hold position
Narrow tunnel - weak trend or consolidation, caution
Tunnel narrowing - trend weakening, prepare to exit
Tunnel widening - trend strengthening, can add
Visually: Gradient Clouds show this automatically!
Trading:
Enter on STRONG signal (tunnel starts widening)
Hold while tunnel wide
Exit when tunnel starts narrowing
Technique 3: "Wave Analysis with Lambda"
Idea: Lambda Wave EMA creates sinusoid matching market cycles
Setup:
Lambda Base Period: 30
Lambda Wave Amplitude: 0.5
Lambda Wave Frequency: 50 (adjusted to asset cycle)
How to find correct Frequency:
Look at historical cycles (distance between local highs)
Average distance = your Frequency
Example: if highs every 40-60 bars, set Frequency = 50
Trading:
Enter when Lambda Wave at bottom of sinusoid (growth potential)
Exit when Lambda Wave at top (fall potential)
Combine with STRONG signals
Technique 4: "Cluster Analysis"
Idea: When all EMAs gather in narrow cluster = powerful breakout soon
Cluster signs:
All EMAs (Phi, Pi, e, Delta) within 0.5-1% of each other
Gradient Clouds almost invisible
Price jumping around all EMAs
Trading:
Identify cluster (all EMAs close)
Determine breakout direction (where more volume, higher TFs direction)
Wait for breakout and STRONG signal
Enter on confirmation
Target = cluster size × 3-5
This is very powerful technique for big moves!
Technique 5: "Sigma as Dynamic Level"
Idea: Sigma Composite EMA = average of all EMAs = magnetic level
Usage:
Enable Sigma Composite (Weighted Average)
Sigma works as dynamic support/resistance
Price often returns to Sigma before trend continuation
Trading:
In trend: Enter on bounces from Sigma
In range: Fade moves from Sigma (trade return to Sigma)
On breakout: Sigma becomes support/resistance
Risk Management
Basic Rules
1. Position Size
Conservative: 1% of capital per trade
Moderate: 2% of capital per trade (recommended)
Aggressive: 3-5% (only for experienced)
Calculation formula:
Lot Size = (Capital × Risk%) / (Stop in pips × Pip value)
2. Risk/Reward Ratio
Minimum: 1:1.5
Standard: 1:2 (recommended)
Optimal: 1:3
Aggressive: 1:5+
3. Maximum Drawdown
Daily: -3% to -5%
Weekly: -7% to -10%
Monthly: -15% to -20%
Upon reaching limit → STOP trading until end of period
Position Management Strategies
1. Fixed Stop
Method:
Stop below/above Fast EMA or local extreme
DON'T move stop against position
Can move to breakeven
For whom: Beginners, conservative traders
2. Trailing by Fast EMA
Method:
Each day (or bar) move stop to Fast EMA level
Position closes when price breaks Fast EMA
Advantages:
Stay in trend as long as possible
Automatically exit on reversal
For whom: Trend followers, swing traders
3. Partial Exit
Method:
50% of position close at +2R
50% hold with trailing by Mid EMA or Slow EMA
Advantages:
Lock profit
Leave position for big move
Psychologically comfortable
For whom: Universal method (recommended)
4. Pyramiding
Method:
First entry on STRONG signal (50% of planned position)
Add 25% on pullback to Fast EMA
Add another 25% on pullback to Mid EMA
Overall stop below Slow EMA
Advantages:
Average entry price
Reduce risk
Increase profit in strong trends
Caution:
Works only in trends
In range leads to losses
For whom: Experienced traders
Trading Psychology
Correct Mindset
1. Indicator is a tool, not holy grail
Indicator shows probability, not guarantee
There will be losing trades - this is normal
Important is series statistics, not one trade
2. Trust the system
If STRONG signal appeared - enter
Don't search for "perfect" moment
Follow trading plan
3. Patience
STRONG signals don't appear every day
Better miss signal than enter against trend
Quality over quantity
4. Discipline
Always set stop loss
Don't move stop against position
Don't increase risk after losses
Beginner Mistakes
1. "I know better than indicator"
Indicator says STRONG BUY, but you think "too high, will wait for pullback"
Result: miss profitable move
Solution: Trust signals or don't use indicator
2. "Will reverse now for sure"
Trading against STRONG trend
Result: stops, stops, stops
Solution: Trend is your friend, trade with trend
3. "Will hold a bit more"
Don't exit when STRONG signal disappears
Greed eats profit
Solution: If signal gone - exit!
4. "I'll recover"
After losses double risk
Result: huge losses
Solution: Fixed % risk ALWAYS
5. "I don't like this signal"
Skip signals because of "feeling"
Result: inconsistency, no statistics
Solution: Trade ALL signals or clearly define filters
Trading Journal
What to Record
For each trade:
1. Entry/exit date and time
2. Instrument and timeframe
3. Signal type
Golden Cross
STRONG BUY
STRONG SELL
Death Cross
4. Indicator settings
Fast/Mid/Slow EMA
Base Multiplier
Other parameters
5. Chart screenshot
Entry moment
Exit moment
6. Trade parameters
Position size
Stop loss
Take Profit
R:R
7. Result
Profit/Loss in $
Profit/Loss in %
Profit/Loss in R
8. Notes
What was right
What was wrong
Emotions during trade
Lessons
Journal Analysis
Analyze weekly:
1. Win Rate
Win Rate = (Profitable trades / All trades) × 100%
Good: 50-60%
Excellent: 60-70%
Exceptional: 70%+
2. Average R
Average R = Sum of all R / Number of trades
Good: +0.5R
Excellent: +1.0R
Exceptional: +1.5R+
3. Profit Factor
Profit Factor = Total profit / Total losses
Good: 1.5+
Excellent: 2.0+
Exceptional: 3.0+
4. Maximum Drawdown
Track consecutive losses
If more than 5 in row - stop, check system
5. Best/Worst Trades
What was common in best trades? (do more)
What was common in worst trades? (avoid)
Pre-Trade Checklist
Technical Analysis
STRONG signal active (BUY or SELL)
All EMAs properly aligned (Fast > Mid > Slow or reverse)
Price on correct side of Fast EMA
Gradient Clouds confirm trend
Pulsing Bar shows STRONG state
Momentum % in normal range (not overheated)
No close strong levels against direction
Higher timeframe doesn't contradict
Risk Management
Position size calculated (1-2% risk)
Stop loss set
Take profit calculated (minimum 1:2)
R:R satisfactory
Daily/weekly risk limit not exceeded
No other open correlated positions
Fundamental Analysis
No important news in coming hours
Market session appropriate (liquidity)
No contradicting fundamentals
Understand why asset is moving
Psychology
Calm and thinking clearly
No emotions from previous trades
Ready to accept loss at stop
Following trading plan
Not revenging market for past losses
If at least one point is NO - think twice before entering!
Learning Roadmap
Week 1: Familiarization
Goals:
Install and configure indicator
Study all EMA types
Understand visualization
Tasks:
Add indicator to chart
Test all Fast/Mid/Slow settings
Play with Base Multiplier on different timeframes
Observe Gradient Clouds and Pulsing Bar
Study Info Table
Result: Comfort with indicator interface
Week 2: Signals
Goals:
Learn to recognize all signal types
Understand difference between Golden Cross and STRONG
Tasks:
Find 10 Golden Cross examples in history
Find 10 STRONG BUY examples in history
Compare their results (which worked better)
Set up alerts
Get 5 real alerts
Result: Understanding signals
Week 3: Demo Trading
Goals:
Start trading signals on demo account
Gather statistics
Tasks:
Open demo account
Trade ONLY STRONG signals
Keep journal (minimum 20 trades)
Don't change indicator settings
Strictly follow stop losses
Result: 20+ documented trades
Week 4: Analysis
Goals:
Analyze demo trading results
Optimize approach
Tasks:
Calculate win rate and average R
Find patterns in profitable trades
Find patterns in losing trades
Adjust approach (not indicator!)
Write trading plan
Result: Trading plan on 1 page
Month 2: Improvement
Goals:
Deepen understanding
Add additional techniques
Tasks:
Study multi-timeframe analysis
Test combinations with Price Action
Try advanced techniques (divergences, tunnels)
Continue demo trading (minimum 50 trades)
Achieve stable profitability on demo
Result: Win rate 55%+ and Profit Factor 1.5+
Month 3: Real Trading
Goals:
Transition to real account
Maintain discipline
Tasks:
Open small real account
Trade minimum lots
Strictly follow trading plan
DON'T increase risk
Focus on process, not profit
Result: Psychological comfort on real
Month 4+: Scaling
Goals:
Increase account
Become consistently profitable
Tasks:
With 60%+ win rate can increase risk to 2%
Upon doubling account can add capital
Continue keeping journal
Periodically review and improve strategy
Share experience with community
Result: Stable profitability month after month
Additional Resources
Recommended Reading
Technical Analysis:
"Technical Analysis of Financial Markets" - John Murphy
"Trading in the Zone" - Mark Douglas (psychology)
"Market Wizards" - Jack Schwager (trader interviews)
EMA and Moving Averages:
"Moving Averages 101" - Steve Burns
Articles on Investopedia about EMA
Risk Management:
"The Mathematics of Money Management" - Ralph Vince
"Trade Your Way to Financial Freedom" - Van K. Tharp
Trading Journals:
Edgewonk (paid, very powerful)
Tradervue (free version + premium)
Excel/Google Sheets (free)
Screeners:
TradingView Stock Screener
Finviz (stocks)
CoinMarketCap (crypto)
Conclusion
Hellenic EMA Matrix is a powerful tool based on universal mathematical constants of nature. The indicator combines:
Mathematical elegance - Phi, Pi, e instead of arbitrary numbers
Premium visualization - Neon Glow, Gradient Clouds, Pulsing Bar
Reliable signals - STRONG BUY/SELL work on all timeframes
Flexibility - 6 EMA types, adaptation to any trading style
Automation - auto-sorting EMAs, SL/TP calculation, alerts
Key Success Principles:
Simplicity - start with basic settings (Phi/Pi/e, Base=10)
Discipline - follow STRONG signals strictly
Patience - wait for quality setups
Risk Management - 1-2% per trade, ALWAYS
Journal - document every trade
Learning - constantly improve skills
Remember:
Indicator shows probability, not guarantee
Important is series statistics, not one trade
Psychology more important than technique
Quality more important than quantity
Process more important than result
Acknowledgments
Thank you for using Hellenic EMA Matrix - Alpha Omega Premium!
The indicator was created with love for mathematics, markets, and beautiful visualization.
Wishing you profitable trading!
Guide Version: 1.0
Date: 2025
Compatibility: Pine Script v6, TradingView
"In the simplicity of mathematical constants lies the complexity of market movements"

Higher Timeframe Candle LevelsThis is an indicator that shows higher time frame candle levels from various preset timeframes. These higher time frame candles act as support and resistance levels, so look for reversals and continuations off of these levels. When price exceeds the high or low of these levels, you should look for breakouts in the same direction and trade with the trend.
It includes candle levels for the following timeframes: 1 hour, 4 hour, 1 day, 1 week, 1 month, 1 quarter and 1 year. The indicator also includes a trend candle coloring feature, trend strength scoring table, stop loss feature, line identification labels, alerts for trend changes, alerts for level touches and full customization of all options.
How To Trade With This Indicator
These higher timeframe candle levels will act as support and resistance levels, so look for price to react at any of the levels you have turned on and then look for potential bounce or reversal signs at those levels so you can trade those direction changes. Price outside of the higher timeframe candle highs and low typically signals a breakout as well, so look for price to continue after passing the highs or lows.
You can use the direction of the higher timeframe candles as your trend as well. Try to only trade in the direction of the trend of the higher timeframes to increase the likelihood of your trade going in your favor.
The highs and lows of daily and up levels are excellent levels to find quick reversal off of. Watch for price action to struggle to break through these levels and then trade the reversal. If price breaks through these levels easily, watch for price to retest the level and then continue beyond that level. Trade the retest in the direction of the trend.
The open, close and midline levels are excellent for trading bounces. Watch for price to form wicks beyond these levels and close on the other side and use that as a sign that price may bounce there. Use that with price action to confirm your trade and then take trades off of those level bounces.
Use the alerts for daily and up timeframe level touches across all of your favorite markets so that way you are always notified in real time when price is at a level that could provide a potential trading opportunity.
Higher Time Frame Candle Levels
The indicator shows the current candle open, previous open, previous high, previous low, previous close and previous candle body midline levels of each candle for each time frame. This helps you easily see what is going on with the higher time frame candles and read the price action from your lower time frame charts.
Each candle level will paint red if it was a down candle or green if it was an up candle, except the midlines and current candle open lines, those are a different color for easy differentiation. The line colors can be customized to your preferences in the settings and you can also toggle the candle body coloring on or off, as well as change the color of the candle body background.
Each timeframe can be adjusted to your preferences, allowing you to turn all of the levels on or off. You can also adjust how many previous candles show up on your chart so you can backtest it and see for yourself how accurate these levels are.
When adjusting the number of candles, you will get a notification if you have more than 500 lines turned on, so just turn down the number of levels for whatever timeframe you can’t see on your chart to lower that number below 500. The notification will go away once you are under 500 lines again. Each candle has 6 lines if all levels are turned on for that timeframe: open, current candle open, close, high, low and midline. The default settings keep you under 500 lines total, so just be aware of that limitation when adjusting those numbers and adjust the number of levels down on the timeframes that are not useful on the current chart bar.
You can also extend the levels right on any time frame from the daily levels and above. This is useful when price is breaking above or below all levels and you need to know if there are any other previous candle levels in the way as price moves away from the most recent higher time frame candles.
To understand the intraday trend of each higher time frame, look to see where price is at according to each higher time frame candle. If the price is above the midline of the candle, it is bullish. If the price is above the candle body it is more bullish. If the price is above the high, it is very bullish. If the price is below the midline of the candle, it is bearish. If the price is below the candle body it is more bearish. If the price is below the low, it is very bearish. Make sure you backtest this yourself and go through lots of historical data to get a feel for how price reacts to these levels and establishes the trend. Then use that trend information to your advantage and trade in the direction of the trend.
Since users are limited to a certain amount of historical bars based on which Tradingview plan you have, some longer timeframe levels won’t show up because the start of that candle is too far back in history. You will get a notification at the top of that chart if that happens. It will tell you to lower the display timeframe for that timeframe until that notification goes away, which means it was able to plot the most recent candle for that timeframe on your chart.
Trend Candle Coloring
The indicator includes a feature that paints the candles based on whether the current time frame candles are above or below the most recent midline, candle body or high & low of a higher time frame candle of your choice. This helps you see the overall trend of the higher timeframe so you can trade with the trend.
The candle coloring will have an up color, down color and neutral color which can all be customized to suit your preferences. If the current time frame candle close is above the setting you choose, it will show the up color. If the current time frame candle close is below the setting you choose, it will show the down color. If the current time frame candle close is equal to or in the middle of the setting you chose, it will show the neutral color.
So, for example if you set it to candle body, then it will show the up color if the current candle is above the top of the candle body, down color if it is below the bottom of the candle body and neutral color if it is inside the candle body. This helps you wait for price action to move beyond the inside of the previous higher time frame candle before taking a position when price is breaking out of that previous candle so you can trade the momentum of that move. The candle coloring is fully customizable, but make sure to turn off your candle coloring on other indicators and your chart settings for it to show up properly.
Trend Strength Scoring Table
The trend strength scoring table displays a table at the bottom of the screen(table position is customizable), showing a score for the trend strength of each higher time frame. If the current candle close is above the midline, its strength is 1. If the current candle close is above the midline, but below the top of the candle body, its strength is 2. If the current candle close is above the high, its strength is 3. The same goes for below the midline, bottom of the candle body and below the low, but the scores would be negative 1, 2 or 3 instead.
This trend strength table allows you to quickly identify the trend on each higher time frame so you can wait until the trend is the same across all time frames before placing a trade in the direction of the trend. It also shows a total score on the far right side that adds all of the current trend scores together to give you a total strength score. Try to only trade when that number is very high compared to how many time frames you have turned on. Each time frame can have up to a maximum score of 3 if bullish and -3 if bearish. Each time frame in the table can be turned on or off to suit your preferences.
Stop Loss Feature
There is also a stop loss feature that you can set to whatever time frame you choose and whatever direction you chose, such as long or short. It will follow the most recent higher time frame candle’s trend using one of the following settings: candle body, high & low or midline. Once a new higher time frame candle is created, the stop loss will update to the most recent candle’s levels so you can use these levels as a trailing stop loss to maximize your wins.
If you have it set to use the candle body and it is set to long mode, then the stop loss will use the previous higher time frame candle’s lowest candle body level. So if it was an up candle previously, it will use the open. If it was a down candle previously, it will use the close. The opposite is true for short positions.
The stop loss will start working once you turn it on in the settings and will update automatically as new higher time frame candles are formed. It also shows a line of where the stop loss was previously since it was turned on.
I recommend using the high & low setting, especially when the market starts trending.
Candle Level Identification Labels
There are labels for each level starting with the 4 hour time frame and above so you can easily tell what level of each candle you are looking at, even if the rest of the candle is not showing within the chart pane. You can customize the label coloring for up candles and down candles and midlines as well as adjust the number of bars that the labels are offset from the current bar so they are visible on your chart without overlapping the current price action or other indicator labels. Labels for each time frame can be turned on or off as needed. The 1 hour labels were not included because it clogs up the chart, but it has labels for all time frames from the 4 hour candles and up.
Alerts
The indicator includes alerts for when the trend has changed to the opposite direction. The trend change alert is based on your settings for the Trend Candle Coloring. Whatever settings you have the trend candle coloring set to, will be used to set up your alerts. The Trend Candle Coloring setting must be turned on as well when creating your alerts for it to work properly. Make sure to backtest your settings and then create your alerts.
It also has alerts for when price is touching an open or close, high or low, midline or any of those levels for each timeframe. This allows you to be notified when price touches one of these levels so you can check the chart and look for potential trade opportunities if price wants to bounce off of that level. To make it easy for you to get alerts on many different tickers, just use the alert for any level touch on whatever timeframes you want.
Other Indicators To Pair This With
Use this in combination with our Trend Strength Indicator so you can visually see the historic and current trend for all of these levels. You should also use our Breakout Scanner to find other markets with strong trends so you always know which market is trending the strongest and can trade those. Trend Strength Indicator, Higher Timeframe Candle Levels and the Breakout Scanner all use the same levels and calculate the trend scores the same way so they are designed to work together to help you quickly be able to read a chart and find what direction to trade in.

Anchored VWAP Polyline [CHE] Anchored VWAP Polyline — Anchored VWAP drawn as a polyline from a user-defined bar count with last-bar updates and optional labels
Summary
This indicator renders an anchored Volume-Weighted Average Price as a continuous polyline starting from a user-selected anchor point a specified number of bars back. It accumulates price multiplied by volume only from the anchor forward and resets cleanly when the anchor moves. Drawing is object-based (polyline and labels) and updated on the most recent bar only, which reduces flicker and avoids excessive redraws. Optional labels mark the anchor and, conditionally, a delta label when the current close is below the historical close at the anchor offset.
Motivation: Why this design?
Anchored VWAP is often used to track fair value after a specific event such as a swing, breakout, or session start. Traditional plot-based lines can repaint during live updates or incur overhead when frequently redrawn. This implementation focuses on explicit state management, last-bar rendering, and object recycling so the line stays stable while remaining responsive when the anchor changes. The design emphasizes deterministic updates and simple session gating from the anchor.
What’s different vs. standard approaches?
Baseline: Classic VWAP lines plotted from session open or full history.
Architecture differences:
Anchor defined by a fixed bar offset rather than session or day boundaries.
Object-centric drawing via `polyline` with an array of `chart.point` objects.
Last-bar update pattern with deletion and replacement of the polyline to apply all points cleanly.
Conditional labels: an anchor marker and an optional delta label only when the current close is below the historical close at the offset.
Practical effect: You get a visually continuous anchored VWAP that resets when the anchor shifts and remains clean on chart refreshes. The labels act as lightweight diagnostics without clutter.
How it works (technical)
The anchor index is computed as the latest bar index minus the user-defined bar count.
A session flag turns true from the anchor forward; prior bars are excluded.
Two persistent accumulators track the running sum of price multiplied by volume and the running sum of volume; they reset when the session flag turns from false to true.
The anchored VWAP is the running sum divided by the running volume whenever both are valid and the volume is not zero.
Points are appended to an array only when the anchored VWAP is valid. On the most recent bar, any existing polyline is deleted and replaced with a new one built from the point array.
Labels are refreshed on the most recent bar:
A yellow warning label appears when there are not enough bars to compute the reference values.
The anchor label marks the anchor bar.
The delta label appears only when the current close is below the close at the anchor offset; otherwise it is suppressed.
No higher-timeframe requests are used; repaint is limited to normal live-bar behavior.
Parameter Guide
Bars back — Sets the anchor offset in bars; default two hundred thirty-three; minimum one. Larger values extend the anchored period and increase stability but respond more slowly to regime changes.
Labels — Toggles all labels; default enabled. Disable to keep the chart clean when using multiple instances.
Reading & Interpretation
The polyline represents the anchored VWAP from the chosen anchor to the current bar. Price above the line suggests strength relative to the anchored baseline; price below suggests weakness.
The anchor label shows where the accumulation starts.
The delta label appears only when today’s close is below the historical close at the offset; it provides a quick context for negative drift relative to that reference.
A yellow message at the current bar indicates the chart does not have enough history to compute the reference comparison yet.
Practical Workflows & Combinations
Trend following: Anchor after a breakout bar or a swing confirmation. Use the anchored VWAP as dynamic support or resistance; look for clean retests and holds for continuation.
Mean reversion: Anchor at a local extreme and watch for approaches back toward the line; require structure confirmation to avoid early entries.
Session or event studies: Re-set the anchor around earnings, macro releases, or session opens by adjusting the bar offset.
Combinations: Pair with structure tools such as swing highs and lows, or with volatility measures to filter chop. The labels can be disabled when combining multiple instances to maintain chart clarity.
Behavior, Constraints & Performance
Repaint and confirmation: The line is updated on the most recent bar only; historical values do not rely on future bars. Normal live-bar movement applies until the bar closes.
No higher timeframe: There is no `security` call; repaint paths related to higher-timeframe lookahead do not apply here.
Resources: Uses one polyline object that is rebuilt on the most recent bar, plus two labels when conditions are met. `max_bars_back` is two thousand. Arrays store points from the anchor forward; extremely long anchors or very long charts increase memory usage.
Known limits: With very thin volume, the VWAP can be unavailable for some bars. Very large anchors reduce responsiveness. Labels use ATR for vertical placement; extreme gaps can place them close to extremes.
Sensible Defaults & Quick Tuning
Starting point: Bars back two hundred thirty-three with Labels enabled works well on many assets and timeframes.
Too noisy around the line: Increase Bars back to extend the accumulation window.
Too sluggish after regime changes: Decrease Bars back to focus on a shorter anchored period.
Chart clutter with multiple instances: Disable Labels while keeping the polyline visible.
What this indicator is—and isn’t
This is a visualization of an anchored VWAP with optional diagnostics. It is not a full trading system and does not include entries, exits, or position management. Use it alongside clear market structure, risk controls, and a plan for trade management. It does not predict future prices.
Inputs with defaults
Bars back: two hundred thirty-three bars, minimum one.
Labels: enabled or disabled toggle, default enabled.
Pine version: v6
Overlay: true
Primary outputs: one polyline, optional labels (anchor, conditional delta, and a warning when insufficient bars).
Metrics and functions: volume, ATR for label offset, object drawing via polyline and chart points, last-bar update pattern.
Special techniques: session gating from the anchor, persistent state, object recycling, explicit guards against unavailable values and zero volume.
Compatibility and assets: Designed for standard candlestick or bar charts across liquid assets and common timeframes.
Diagnostics: Yellow warning label when history is insufficient.
Disclaimer
The content provided, including all code and materials, is strictly for educational and informational purposes only. It is not intended as, and should not be interpreted as, financial advice, a recommendation to buy or sell any financial instrument, or an offer of any financial product or service. All strategies, tools, and examples discussed are provided for illustrative purposes to demonstrate coding techniques and the functionality of Pine Script within a trading context.
Any results from strategies or tools provided are hypothetical, and past performance is not indicative of future results. Trading and investing involve high risk, including the potential loss of principal, and may not be suitable for all individuals. Before making any trading decisions, please consult with a qualified financial professional to understand the risks involved.
By using this script, you acknowledge and agree that any trading decisions are made solely at your discretion and risk.
Do not use this indicator on Heikin-Ashi, Renko, Kagi, Point-and-Figure, or Range charts, as these chart types can produce unrealistic results for signal markers and alerts.
Best regards and happy trading
Chervolino
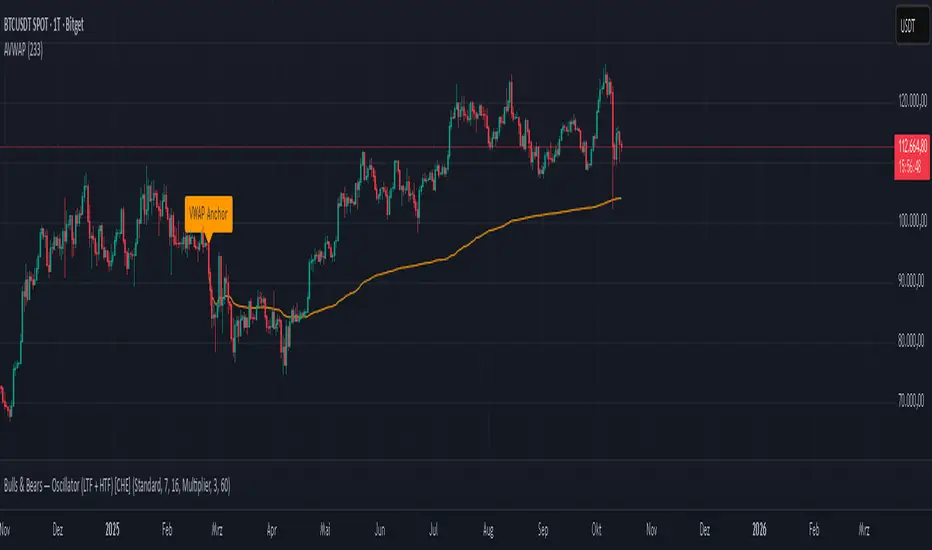
Foresight Cone (HoltxF1xVWAP) [KedArc Quant]Description:
This is a time-series forecasting indicator that estimates the next bar (F1) and projects a path a few bars ahead. It also draws a confidence cone based on how accurate the recent forecasts have been. You can optionally color the projection only when price agrees with VWAP.
Why it’s different
* One clear model: Everything comes from Holt’s trend-aware forecasting method—no mix of unrelated indicators.
* Transparent visuals: You see the next-bar estimate (F1), the forward projection, and a cone that widens or narrows based on recent forecast error.
* Context, not signals: The VWAP option only changes colors. It doesn’t add trade rules.
* No look-ahead: Accuracy is measured using the forecast made on the previous bar versus the current bar.
Inputs (what they mean)
* Source: Price series to forecast (default: Close).
* Preset: Quick profiles for fast, smooth, or momentum markets (see below).
* Alpha (Level): How fast the model reacts to new prices. Higher = faster, twitchier.
* Beta (Trend): How fast the model updates the slope. Higher = faster pivots, more flips in chop.
* Horizon: How many bars ahead to project. Bigger = wider cone.
* Residual Window: How many bars to judge recent accuracy. Bigger = steadier cone.
* Confidence Z: How wide the cone should be (typical setting ≈ “95% style” width).
* Show Bands / Draw Forward Path: Turn the cone and forward lines on/off.
* Color only when aligned with VWAP: Highlights projections only when price agrees with the trend side of VWAP.
* Colors / Show Panel: Styling plus a small panel with RMSE, MAPE, and trend slope.
Presets (when to pick which)
* Scalp / Fast (1-min): Very responsive; best for quick moves. More twitch in chop.
* Smooth Intraday (1–5 min): Calmer and steadier; a good default most days.
* Momentum / Breakout: Quicker slope tracking during strong pushes; may over-react in ranges.
* Custom: Set your own values if you know exactly what you want.
What is F1 here?
F1 is the model’s next-bar fair value. Crosses of price versus F1 can hint at short-term momentum shifts or mean-reversion, especially when viewed with VWAP or the cone.
How this helps
* Gives a baseline path of where price may drift and a cone that shows normal wiggle room.
* Helps you tell routine noise (inside cone) from information (edges or breaks outside the cone).
* Keeps you aware of short-term bias via the trend slope and F1.
How to use (step by step)
1. Add to chart → choose a Preset (start with Smooth Intraday).
2. Set Horizon around 8–15 bars for intraday.
3. (Optional) Turn on VWAP alignment to color only when price agrees with the trend side of VWAP.
4. Watch where price sits relative to the cone and F1:
* Inside = normal noise.
* At edges = stretched.
* Outside = possible regime change.
5. Check the panel: if RMSE/MAPE spike, expect a wider cone; consider a smoother preset or a higher timeframe.
6. Tweak Alpha/Beta only if needed: faster for momentum, slower for chop.
7. Combine with your own plan for entries, exits, and risk.
Accuracy Panel — what it tells you
Preset & Horizon: Shows which preset you’re using and how many bars ahead the projection goes. Longer horizons mean more uncertainty.
RMSE (error in price units): A “typical miss” measured in the chart’s currency (e.g., ₹).
Lower = tighter fit and a usually narrower cone. Rising = conditions getting noisier; the cone will widen.
MAPE (error in %): The same idea as RMSE but in percent.
Good for comparing different symbols or timeframes. Sudden spikes often hint at a regime change.
Slope T: The model’s short-term trend reading.
Positive = gentle up-bias; negative = gentle down-bias; near zero = mostly flat/drifty.
How to read it at a glance
Calm & directional: RMSE/MAPE steady or falling + Slope T positive (or negative) → trends tend to respect the cone’s mid/upper (or mid/lower) area.
Choppy/uncertain: RMSE/MAPE climbing or jumping → expect more whipsaw; rely more on the cone edges and higher-TF context.
Flat tape: Slope T near zero → mean-revert behavior is common; treat cone edges as stretch zones rather than breakout zones.
Warm-up & tweaks
Warm-up: Right after adding the indicator, the panel may be blank for a short time while it gathers enough bars.
Too twitchy? Switch to Smooth Intraday or increase the Residual Window.
Too slow? Use Scalp/Fast or Momentum/Breakout to react quicker.
Timeframe tips
* 1–3 min: Scalp/Fast or Momentum/Breakout; horizon \~8–12.
* 5–15 min: Smooth Intraday; horizon \~12–15.
* 30–60 min+: Consider a larger residual window for a steadier cone.
FAQ
Q: Is this a strategy or an indicator?
A: It’s an indicator only. It does not place orders, TP/SL, or run backtests.
Q: Does it repaint?
A: The next-bar estimate (F1) and the cone are calculated using only information available at that time. The forward path is a projection drawn on the last bar and will naturally update as new bars arrive. Historical bars aren’t revised with future data.
Q: What is F1?
A: F1 is the indicator’s best guess for the next bar.
Price crossing above/below F1 can hint at short-term momentum shifts or mean-reversion.
Q: What do “Alpha” and “Beta” do?
A: Alpha controls how fast the indicator reacts to new prices
(higher = faster, twitchier). Beta controls how fast the slope updates (higher = quicker pivots, more flips in chop).
Q: Why does the cone width change?
A: It reflects recent forecast accuracy. When the market gets noisy, the cone widens. When the tape is calm, it narrows.
Q: What does the Accuracy Panel tell me?
A:
* Preset & Horizon you’re using.
* RMSE: typical forecast miss in price units.
* MAPE: typical forecast miss in percent.
* Slope T: short-term trend reading (up, down, or flat).
If RMSE/MAPE rise, expect a wider cone and more whipsaw.
Q: The panel shows “…” or looks empty. Why?
A: It needs a short warm-up to gather enough bars. This is normal after you add the indicator or change settings/timeframes.
Q: Which timeframe is best?
A:
* 1–3 min: Scalp/Fast or Momentum/Breakout, horizon \~8–12.
* 5–15 min: Smooth Intraday, horizon \~12–15.
Higher timeframes work too; consider a larger residual window for steadier cones.
Q: Which preset should I start with?
A: Start with Smooth Intraday. If the market is trending hard, try Momentum/Breakout.
For very quick tapes, use Scalp/Fast. Switch back if things get choppy.
Q: What does the VWAP option do?
A: It only changes colors (highlights when price agrees with the trend side of VWAP).
It does not add or remove signals.
Q: Are there alerts?
A: Yes—alerts for price crossing F1 (up/down). Use “Once per bar close” to reduce noise on fast charts.
Q: Can I use this on stocks, futures, crypto, or FX?
A: Yes. It works on any symbol/timeframe. You may want to adjust Horizon and the Residual Window based on volatility.
Q: Can I use it with Heikin Ashi or other non-standard bars?
A: You can, but remember you’re forecasting the synthetic series of those bars. For pure price behavior, use regular candles.
Q: The cone feels too wide/too narrow. What do I change?
A:
* Too wide: lower Alpha/Beta a bit or increase the Residual Window.
* Too narrow (misses moves): raise Alpha/Beta slightly or try Momentum/Breakout.
Q: Why do results change when I switch timeframe or symbol?
A: Different noise levels and trends. The accuracy stats reset per chart, so the cone adapts to each context.
Q: Any limits or gotchas?
A: Extremely large Horizon may hit TradingView’s line-object limits; reduce Horizon or turn
off extra visuals if needed. Big gaps or news spikes will widen errors—expect the cone to react.
Q: Can this predict exact future prices?
A: No. It provides a baseline path and context. Always combine with your own rules and risk management.
Glossary
* TS (Time Series): Data over time (prices).
* Holt’s Method: A forecasting approach that tracks a current level and a trend to predict the next bars.
* F1: The indicator’s best guess for the next bar.
* F(h): The projected value h bars ahead.
* VWAP: Volume-Weighted Average Price—used here for optional color alignment.
* RMSE: Typical forecast miss in price units (how far off, on average).
* MAPE: Typical forecast miss in percent (scale-free, easy to compare).
Notes & limitations
* The panel needs a short warm-up; stats may be blank at first.
* The cone reflects recent conditions; sudden volatility changes will widen it.
* This is a tool for context. It does not place trades and does not promise results.
⚠️ Disclaimer
This script is provided for educational purposes only.
Past performance does not guarantee future results.
Trading involves risk, and users should exercise caution and use proper risk management when applying this strategy.

Weis Wave Candle█Overview
The Weis Wave Candle indicator is a technical tool designed for the TradingView platform, enabling traders to analyze market dynamics by identifying price waves. The indicator relies solely on candlestick data, making it functional on markets where volume data is unavailable. It employs two trend detection methods, dynamic color gradients, trend change alerts, and clear visualization to assist in identifying trend strength and potential reversal points.
█Concept
The Weis Wave Candle indicator was developed to overcome limitations associated with the lack of volume data in certain markets, offering an alternative to traditional volume-based indicators like Weis Wave. Instead of volume, it measures candle size (body or body plus half the candle range) and accumulates it within a price wave. The indicator includes two trend calculation methods:
-LazyBear Style: Based on the popular Weis Wave adaptation by LazyBear, likely the most recognized version of this tool, it uses closing price comparisons and trend confirmation via trend functions. Results may differ from the original Weis Wave, as candle size does not always align with volume.
-Impulse Trend: A method that evaluates trend strength by summing price movements over a specified period, where each candle with a higher close than the previous adds +1, a lower close subtracts -1, and no change adds 0. The trend strength is determined by the sum: positive indicates an uptrend, negative a downtrend, and zero a continuation of the prior trend.
Results are visualized using dynamic color gradients, and alerts notify users of trend direction changes, facilitating quick decision-making.
█Why Use It?
-Volume-Free Operation: Ideal for markets without volume data.
-Flexibility: Two trend detection methods allow adaptation to various trading strategies.
-Dynamic Visualization: Color gradients and semi-transparent backgrounds simplify quick interpretation of trend strength.
-Alerts: Notifications for trend changes (from uptrend to downtrend and vice versa) support active trading.
-Customization: Options to adjust colors, analysis periods, and candle shadow inclusion.
█How It Works?
-Candle Size Calculation: Depending on the setting, candle size includes only the body (difference between close and open) or the body plus half the candle range (calculated as 0.5 * (high - low)) (setting Include candle shadows).
-Trend Detection:
LazyBear Style: Compares closing prices of adjacent candles to determine direction (uptrend, downtrend, or neutral) and confirms the trend using ta.rising or ta.falling functions over the specified period.
Impulse Trend: Sums price movements over the analysis period (+1 for a candle with a higher close than the previous, -1 for a lower close, 0 for no change). A positive sum indicates an uptrend, a negative sum a downtrend, and zero a continuation of the prior trend.
-Wave Accumulation: Candle sizes are accumulated within a single wave until the trend changes.
-Normalization and Gradients: Wave values are normalized to a 0-100 scale solely for color gradient purposes, enabling dynamic color changes from base to intense, reflecting wave strength relative to historical values. The height of columns (representing waves) is not normalized and corresponds to the accumulated candle size.
-Alerts: The indicator generates notifications when the wave direction changes (from uptrend to downtrend or vice versa), enabling quick responses to trend shifts.
-Visualization: Upward and downward waves are plotted as columns with dynamic colors, and the chart background changes color for better visibility.
█Settings and Customization
-Trend Detection Method: Choose between LazyBear Style (default) and Impulse Trend.
-Trend Analysis Period: Number of candles for trend analysis (default: 4).
-Include Candle Shadows: Determines whether to include half the candle range (high - low) in addition to the body (default: enabled).
-Lookback Period for Dynamic Thresholds: Number of candles to calculate the maximum and minimum wave values for color gradient normalization (default: 70).
-Gradient Minimum/Maximum Value: Threshold values defining the normalization range for color gradients (default: 0/100). A lower minimum value reduces the threshold for lighter colors, while a higher maximum value increases the threshold for more intense colors.
-Wave Colors: Options to select base and intense colors for upward and downward waves.
-Alerts: Enable alerts in TradingView settings (Upward Trend Change and Downward Trend Change) for trend change notifications.
█Usage Examples
-Trend Analysis: Upward waves (green columns) indicate buying pressure, while downward waves (red columns) indicate selling pressure. The more intense the color, the stronger the wave relative to historical values.
-Comparing Timeframes: Analyze trends across multiple timeframes (e.g., 1H, 4H, 1D) for broader context. For example, enter a position on the 4H timeframe after confirming trend alignment on 1H, 4H, and 1D, along with validation from a key level, such as a Fibonacci level or a Break of Structure (BOS).
-Using Alerts: Configure alerts in TradingView to receive notifications of trend changes, useful for active trading.
█Notes for Users
-Experiment with the Trend Analysis Period and Include Candle Shadows settings to tailor the indicator to your market and timeframe.
-Combine the indicator with other tools, such as support/resistance levels or RSI, to enhance signal accuracy.
-The Impulse Trend method may be more sensitive to short-term price changes, while LazyBear Style performs better in clear trends. Results from LazyBear Style may differ from the original Weis Wave, as candle size does not always align with volume.

Live Market - Performance MonitorLive Market — Performance Monitor
Study material (no code) — step-by-step training guide for learners
________________________________________
1) What this tool is — short overview
This indicator is a live market performance monitor designed for learning. It scans price, volume and volatility, detects order blocks and trendline events, applies filters (volume & ATR), generates trade signals (BUY/SELL), creates simple TP/SL trade management, and renders a compact dashboard summarizing market state, risk and performance metrics.
Use it to learn how multi-factor signals are constructed, how Greeks-style sensitivity is replaced by volatility/ATR reasoning, and how a live dashboard helps monitor trade quality.
________________________________________
2) Quick start — how a learner uses it (step-by-step)
1. Add the indicator to a chart (any ticker / timeframe).
2. Open inputs and review the main groups: Order Block, Trendline, Signal Filters, Display.
3. Start with defaults (OB periods ≈ 7, ATR multiplier 0.5, volume threshold 1.2) and observe the dashboard on the last bar.
4. Walk the chart back in time (use the last-bar update behavior) and watch how signals, order blocks, trendlines, and the performance counters change.
5. Run the hands-on labs below to build intuition.
________________________________________
3) Main configurable inputs (what you can tweak)
• Order Block Relevant Periods (default ~7): number of consecutive candles used to define an order block.
• Min. Percent Move for Valid OB (threshold): minimum percent move required for a valid order block.
• Number of OB Channels: how many past order block lines to keep visible.
• Trendline Period (tl_period): pivot lookback for detecting highs/lows used to draw trendlines.
• Use Wicks for Trendlines: whether pivot uses wicks or body.
• Extension Bars: how far trendlines are projected forward.
• Use Volume Filter + Volume Threshold Multiplier (e.g., 1.2): requires volume to be greater than multiplier × average volume.
• Use ATR Filter + ATR Multiplier: require bar range > ATR × multiplier to filter noise.
• Show Targets / Table settings / Colors for visualization.
________________________________________
4) Core building blocks — what the script computes (plain language)
Price & trend:
• Spot / LTP: current close price.
• EMA 9 / 21 / 50: fast, medium, slow moving averages to define short/medium trend.
o trend_bullish: EMA9 > EMA21 > EMA50
o trend_bearish: EMA9 < EMA21 < EMA50
o trend_neutral: otherwise
Volatility & noise:
• ATR (14): average true range used for dynamic target and filter sizing.
• dynamic_zone = ATR × atr_multiplier: minimum bar range required for meaningful move.
• Annualized volatility: stdev of price changes × sqrt(252) × 100 — used to classify volatility (HIGH/MEDIUM/LOW).
Momentum & oscillators:
• RSI 14: overbought/oversold indicator (thresholds 70/30).
• MACD: EMA(12)-EMA(26) and a 9-period signal line; histogram used for momentum direction and strength.
• Momentum (ta.mom 10): raw momentum over 10 bars.
Mean reversion / band context:
• Bollinger Bands (20, 2σ): upper, mid, lower.
o price_position measures where price sits inside the band range as 0–100.
Volume metrics:
• avg_volume = SMA(volume, 20) and volume_spike = volume > avg_volume × volume_threshold
o volume_ratio = volume / avg_volume
Support & Resistance:
• support_level = lowest low over 20 bars
• resistance_level = highest high over 20 bars
• current_position = percent of price between support & resistance (0–100)
________________________________________
5) Order Block detection — concept & logic
What it tries to find: a bar (the base) followed by N candles in the opposite direction (a classical order block setup), with a minimum % move to qualify. The script records the high/low of the base candle, averages them, and plots those levels as OB channels.
How learners should think about it (conceptual):
1. An order block is a signature area where institutions (theory) left liquidity — often seen as a large bar followed by a sequence of directional candles.
2. This indicator uses a configurable number of subsequent candles to confirm that the pattern exists.
3. When found, it stores and displays the base candle’s high/low area so students can see how price later reacts to those zones.
Implementation note for learners: the tool keeps a limited history of OB lines (ob_channels). When new OBs exceed the count, the oldest lines are removed — good practice to avoid clutter.
________________________________________
6) Trendline detection — idea & interpretation
• The script finds pivot highs and lows using a symmetric lookback (tl_period and half that as right/left).
• It then computes a trendline slope from successive pivots and projects the line forward (extension_bars).
• Break detection: Resistance break = close crosses above the projected resistance line; Support break = close crosses below projected support.
Learning tip: trendlines here are computed from pivot points and time. Watch how changing tl_period (bigger = smoother, fewer pivots) alters the trendlines and break signals.
________________________________________
7) Signal generation & filters — step-by-step
1. Primary triggers:
o Bullish trigger: order block bullish OR resistance trendline break.
o Bearish trigger: bearish order block OR support trendline break.
2. Filters applied (both must pass unless disabled):
o Volume filter: volume must be > avg_volume × volume_threshold.
o ATR filter: bar range (high-low) must exceed ATR × atr_multiplier.
o Not in an existing trade: new trades only start if trade_active is false.
3. Trend confirmation:
o The primary trigger is only confirmed if trend is bullish/neutral for buys or bearish/neutral for sells (EMA alignment).
4. Result:
o When confirmed, a long or short trade is activated with TP/SL calculated from ATR multiples.
________________________________________
8) Trade management — what the tool does after a signal
• Entry management: the script marks a trade as trade_active and sets long_trade or short_trade flags.
• TP & SL rules:
o Long: TP = high + 2×ATR ; SL = low − 1×ATR
o Short: TP = low − 2×ATR ; SL = high + 1×ATR
• Monitoring & exit:
o A trade closes when price reaches TP or SL.
o When TP/SL hit, the indicator updates win_count and total_pnl using a very simple calculation (difference between TP/SL and previous close).
o Visual lines/labels are drawn for TP and updated as the trade runs.
Important learner notes:
• The script does not store a true entry price (it uses close in its P&L math), so PnL is an approximation — treat this as a learning proxy, not a position accounting system.
• There’s no sizing, slippage, or fee accounted — students must manually factor these when translating to real trades.
• This indicator is not a backtesting strategy; strategy.* functions would be needed for rigorous backtest results.
________________________________________
9) Signal strength & helper utilities
• Signal strength is a composite score (0–100) made up of four signals worth 25 points each:
1. RSI extreme (overbought/oversold) → 25
2. Volume spike → 25
3. MACD histogram magnitude increasing → 25
4. Trend existence (bull or bear) → 25
• Progress bars (text glyphs) are used to visually show RSI and signal strength on the table.
Learning point: composite scoring is a way to combine orthogonal signals — study how changing weights changes outcomes.
________________________________________
10) Dashboard — how to read each section (walkthrough)
The dashboard is split into sections; here's how to interpret them:
1. Market Overview
o LTP / Change%: immediate price & daily % change.
2. RSI & MACD
o RSI value plus progress bar (overbought 70 / oversold 30).
o MACD histogram sign indicates bullish/bearish momentum.
3. Volume Analysis
o Volume ratio (current / average) and whether there’s a spike.
4. Order Block Status
o Buy OB / Sell OB: the average base price of detected order blocks or “No Signal.”
5. Signal Status
o 🔼 BUY or 🔽 SELL if confirmed, or ⚪ WAIT.
o No-trade vs Active indicator summarizing market readiness.
6. Trend Analysis
o Trend direction (from EMAs), market sentiment score (composite), volatility level and band/position metrics.
7. Performance
o Win Rate = wins / signals (percentage)
o Total PnL = cumulative PnL (approximate)
o Bull / Bear Volume = accumulated volumes attributable to signals
8. Support & Resistance
o 20-bar highest/lowest — use as nearby reference points.
9. Risk & R:R
o Risk Level from ATR/price as a percent.
o R:R Ratio computed from TP/SL if a trade is active.
10. Signal Strength & Active Trade Status
• Numeric strength + progress bar and whether a trade is currently active with TP/SL display.
________________________________________
11) Alerts — what will notify you
The indicator includes pre-built alert triggers for:
• Bullish confirmed signal
• Bearish confirmed signal
• TP hit (long/short)
• SL hit (long/short)
• No-trade zone
• High signal strength (score > 75%)
Training use: enable alerts during a replay session to be notified when the indicator would have signalled.
________________________________________
12) Labs — hands-on exercises for learners (step-by-step)
Lab A — Order Block recognition
1. Pick a 15–30 minute timeframe on a liquid ticker.
2. Use default OB periods (7). Mark each time the dashboard shows a Buy/Sell OB.
3. Manually inspect the chart at the base candle and the following sequence — draw the OB zone by hand and watch later price reactions to it.
4. Repeat with OB periods 5 and 10; note stability vs noise.
Lab B — Trendline break confirmation
1. Increase trendline period (e.g., 20), watch trendlines form from pivots.
2. When a resistance break is flagged, compare with MACD & volume: was momentum aligned?
3. Note false breaks vs confirmed moves — change extension_bars to see projection effects.
Lab C — Filter sensitivity
1. Toggle Use Volume Filter off, and record the number and quality of signals in a 2-day window.
2. Re-enable volume filter and change threshold from 1.2 → 1.6; note how many low-quality signals are filtered out.
Lab D — Trade management simulation
1. For each signalled trade, record the time, close entry approximation, TP, SL, and eventual hit/miss.
2. Compute actual PnL if you had entered at the open of the next bar to compare with the script’s PnL math.
3. Tabulate win rate and average R:R.
Lab E — Performance review & improvement
1. Build a spreadsheet of signals over 30–90 periods with columns: Date, Signal type, Entry price (real), TP, SL, Exit, PnL, Notes.
2. Analyze which filters or indicators contributed most to winners vs losers and adjust weights.
________________________________________
13) Common pitfalls, assumptions & implementation notes (things to watch)
• P&L simplification: total_pnl uses close as a proxy entry price. Real entry/exit prices and slippage are not recorded — so PnL is approximate.
• No position sizing or money management: the script doesn’t compute position size from equity or risk percent.
• Signal confirmation logic: composite "signal_strength" is a simple 4×25 point scheme — explore different weights or additional signals.
• Order block detection nuance: the script defines the base candle and checks the subsequent sequence. Be sure to verify whether the intended candle direction (base being bullish vs bearish) aligns with academic/your trading definition — read the code carefully and test.
• Trendline slope over time: slope is computed using timestamps; small differences may make lines sensitive on very short timeframes — using bar_index differences is usually more stable.
• Not a true backtester: to evaluate performance statistically you must transform the logic into a strategy script that places hypothetical orders and records exact entry/exit prices.
________________________________________
14) Suggested improvements for advanced learners
• Record true entry price & timestamp for accurate PnL.
• Add position sizing: risk % per trade using SL distance and account size.
• Convert to strategy. (Pine Strategy)* to run formal backtests with equity curves, drawdowns, and metrics (Sharpe, Sortino).
• Log trades to an external spreadsheet (via alerts + webhook) for offline analysis.
• Add statistics: average win/loss, expectancy, max drawdown.
• Add additional filters: news time blackout, market session filters, multi-timeframe confirmation.
• Improve OB detection: combine wick/body, volume spike at base bar, and liquidity sweep detection.
________________________________________
15) Glossary — quick definitions
• ATR (Average True Range): measure of typical range; used to size targets and stops.
• EMA (Exponential Moving Average): trend smoothing giving more weight to recent prices.
• RSI (Relative Strength Index): momentum oscillator; >70 overbought, <30 oversold.
• MACD: momentum oscillator using difference of two EMAs.
• Bollinger Bands: volatility bands around SMA.
• Order Block: a base candle area with subsequent confirmation candles; a zone of institutional interest (learning model).
• Pivot High/Low: local turning point defined by candles on both sides.
• Signal Strength: combined score from multiple indicators.
• Win Rate: proportion of signals that hit TP vs total signals.
• R:R (Risk:Reward): ratio of potential reward (TP distance) to risk (entry to SL).
________________________________________
16) Limitations & assumptions (be explicit)
• This is an indicator for learning — not a trading robot or broker connection.
• No slippage, fees, commissions or tie-in to real orders are considered.
• The logic is heuristic (rule-of-thumb), not a guarantee of performance.
• Results are sensitive to timeframe, market liquidity, and parameter choices.
________________________________________
17) Practical classroom / study plan (4 sessions)
• Session 1 — Foundations: Understand EMAs, ATR, RSI, MACD, Bollinger Bands. Run the indicator and watch how these numbers change on a single day.
• Session 2 — Zones & Filters: Study order blocks and trendlines. Test volume & ATR filters and note changes in false signals.
• Session 3 — Simulated trading: Manually track 20 signals, compute real PnL and compare to the dashboard.
• Session 4 — Improvement plan: Propose changes (e.g., better PnL accounting, alternative OB rule) and test their impact.
________________________________________
18) Quick reference checklist for each signal
1. Was an order block or trendline break detected? (primary trigger)
2. Did volume meet threshold? (filter)
3. Did ATR filter (bar size) show a real move? (filter)
4. Was trend aligned (EMA 9/21/50)? (confirmation)
5. Signal confirmed → mark entry approximation, TP, SL.
6. Monitor dashboard (Signal Strength, Volatility, No-trade zone, R:R).
7. After exit, log real entry/exit, compute actual PnL, update spreadsheet.
________________________________________
19) Educational caveat & final note
This tool is built for training and analysis: it helps you see how common technical building blocks combine into trade ideas, but it is not a trading recommendation. Use it to develop judgment, to test hypotheses, and to design robust systems with proper backtesting and risk control before risking capital.
________________________________________
20) Disclaimer (must include)
Training & Educational Only — This material and the indicator are provided for educational purposes only. Nothing here is investment advice or a solicitation to buy or sell financial instruments. Past simulated or historical performance does not predict future results. Always perform full backtesting and risk management, and consider seeking advice from a qualified financial professional before trading with real capital.
________________________________________

FEDFUNDS Rate Divergence Oscillator [BackQuant]FEDFUNDS Rate Divergence Oscillator
1. Concept and Rationale
The United States Federal Funds Rate is the anchor around which global dollar liquidity and risk-free yield expectations revolve. When the Fed hikes, borrowing costs rise, liquidity tightens and most risk assets encounter head-winds. When it cuts, liquidity expands, speculative appetite often recovers. Bitcoin, a 24-hour permissionless asset sometimes described as “digital gold with venture-capital-like convexity,” is particularly sensitive to macro-liquidity swings.
The FED Divergence Oscillator quantifies the behavioural gap between short-term monetary policy (proxied by the effective Fed Funds Rate) and Bitcoin’s own percentage price change. By converting each series into identical rate-of-change units, subtracting them, then optionally smoothing the result, the script produces a single bounded-yet-dynamic line that tells you, at a glance, whether Bitcoin is outperforming or underperforming the policy backdrop—and by how much.
2. Data Pipeline
• Fed Funds Rate – Pulled directly from the FRED database via the ticker “FRED:FEDFUNDS,” sampled at daily frequency to synchronise with crypto closes.
• Bitcoin Price – By default the script forces a daily timeframe so that both series share time alignment, although you can disable that and plot the oscillator on intraday charts if you prefer.
• User Source Flexibility – The BTC series is not hard-wired; you can select any exchange-specific symbol or even swap BTC for another crypto or risk asset whose interaction with the Fed rate you wish to study.
3. Math under the Hood
(1) Rate of Change (ROC) – Both the Fed rate and BTC close are converted to percent return over a user-chosen lookback (default 30 bars). This means a cut from 5.25 percent to 5.00 percent feeds in as –4.76 percent, while a climb from 25 000 to 30 000 USD in BTC over the same window converts to +20 percent.
(2) Divergence Construction – The script subtracts the Fed ROC from the BTC ROC. Positive values show BTC appreciating faster than policy is tightening (or falling slower than the rate is cutting); negative values show the opposite.
(3) Optional Smoothing – Macro series are noisy. Toggle “Apply Smoothing” to calm the line with your preferred moving-average flavour: SMA, EMA, DEMA, TEMA, RMA, WMA or Hull. The default EMA-25 removes day-to-day whips while keeping turning points alive.
(4) Dynamic Colour Mapping – Rather than using a single hue, the oscillator line employs a gradient where deep greens represent strong bullish divergence and dark reds flag sharp bearish divergence. This heat-map approach lets you gauge intensity without squinting at numbers.
(5) Threshold Grid – Five horizontal guides create a structured regime map:
• Lower Extreme (–50 pct) and Upper Extreme (+50 pct) identify panic capitulations and euphoria blow-offs.
• Oversold (–20 pct) and Overbought (+20 pct) act as early warning alarms.
• Zero Line demarcates neutral alignment.
4. Chart Furniture and User Interface
• Oscillator fill with a secondary DEMA-30 “shader” offers depth perception: fat ribbons often precede high-volatility macro shifts.
• Optional bar-colouring paints candles green when the oscillator is above zero and red below, handy for visual correlation.
• Background tints when the line breaches extreme zones, making macro inflection weeks pop out in the replay bar.
• Everything—line width, thresholds, colours—can be customised so the indicator blends into any template.
5. Interpretation Guide
Macro Liquidity Pulse
• When the oscillator spends weeks above +20 while the Fed is still raising rates, Bitcoin is signalling liquidity tolerance or an anticipatory pivot view. That condition often marks the embryonic phase of major bull cycles (e.g., March 2020 rebound).
• Sustained prints below –20 while the Fed is already dovish indicate risk aversion or idiosyncratic crypto stress—think exchange scandals or broad flight to safety.
Regime Transition Signals
• Bullish cross through zero after a long sub-zero stint shows Bitcoin regaining upward escape velocity versus policy.
• Bearish cross under zero during a hiking cycle tells you monetary tightening has finally started to bite.
Momentum Exhaustion and Mean-Reversion
• Touches of +50 (or –50) come rarely; they are statistically stretched events. Fade strategies either taking profits or hedging have historically enjoyed positive expectancy.
• Inside-bar candlestick patterns or lower-timeframe bearish engulfings simultaneously with an extreme overbought print make high-probability short scalp setups, especially near weekly resistance. The same logic mirrors for oversold.
Pair Trading / Relative Value
• Combine the oscillator with spreads like BTC versus Nasdaq 100. When both the FED Divergence oscillator and the BTC–NDQ relative-strength line roll south together, the cross-asset confirmation amplifies conviction in a mean-reversion short.
• Swap BTC for miners, altcoins or high-beta equities to test who is the divergence leader.
Event-Driven Tactics
• FOMC days: plot the oscillator on an hourly chart (disable ‘Force Daily TF’). Watch for micro-structural spikes that resolve in the first hour after the statement; rapid flips across zero can front-run post-FOMC swings.
• CPI and NFP prints: extremes reached into the release often mean positioning is one-sided. A reversion toward neutral in the first 24 hours is common.
6. Alerts Suite
Pre-bundled conditions let you automate workflows:
• Bullish / Bearish zero crosses – queue spot or futures entries.
• Standard OB / OS – notify for first contact with actionable zones.
• Extreme OB / OS – prime time to review hedges, take profits or build contrarian swing positions.
7. Parameter Playground
• Shorten ROC Lookback to 14 for tactical traders; lengthen to 90 for macro investors.
• Raise extreme thresholds (for example ±80) when plotting on altcoins that exhibit higher volatility than BTC.
• Try HMA smoothing for responsive yet smooth curves on intraday charts.
• Colour-blind users can easily swap bull and bear palette selections for preferred contrasts.
8. Limitations and Best Practices
• The Fed Funds series is step-wise; it only changes on meeting days. Rapid BTC oscillations in between may dominate the calculation. Keep that perspective when interpreting very high-frequency signals.
• Divergence does not equal causation. Crypto-native catalysts (ETF approvals, hack headlines) can overwhelm macro links temporarily.
• Use in conjunction with classical confirmation tools—order-flow footprints, market-profile ledges, or simple price action to avoid “pure-indicator” traps.
9. Final Thoughts
The FEDFUNDS Rate Divergence Oscillator distills an entire macro narrative monetary policy versus risk sentiment into a single colourful heartbeat. It will not magically predict every pivot, yet it excels at framing market context, spotting stretches and timing regime changes. Treat it as a strategic compass rather than a tactical sniper scope, combine it with sound risk management and multi-factor confirmation, and you will possess a robust edge anchored in the world’s most influential interest-rate benchmark.
Trade consciously, stay adaptive, and let the policy-price tension guide your roadmap.

Open Interest Footprint IQ [TradingIQ]Hello Traders!
Th e Open Interest Footprint IQ indicator is an advanced visualization tool designed for cryptocurrency markets. It provides a granular, real-time breakdown of open interest changes across different price levels, allowing traders to see how aggressive market participation is distributed within each bar.
Unlike standard footprint charts that rely solely on volume, this indicator offers unique insights by focusing on the interaction between price action and changes in open interest (OI) — a leading metric often used to infer trader intent and positioning.
How it works
The Open Interest Footprint IQ processes lower timeframe price and open interest data to build a footprint-style chart that shows how traders are positioning themselves within each candle.
Here’s a breakdown of the process:
1. Granular OI & Price Sampling
The script retrieves lower-timeframe data (1-minute, 1-second, or 1-tick, based on your setting).
For each candle, it captures:
High and low prices
Price change direction
Change in open interest (OI)
2. Classifying Trader Behavior
For each lower-timeframe segment, the indicator determines the type of positioning occurring based on price movement and OI change:
If price is moving up and open interest is increasing, it suggests that long positions are being opened. This is considered a "Longs Opening" event, labeled as UU (Up/Up).
If price is moving up but open interest is decreasing, it indicates that short positions are being closed. This is referred to as UD (Up/Down), or "Shorts Closing."
If price is moving down and open interest is increasing, it signals that short positions are being opened. This is known as DU (Down/Up), or "Shorts Opening."
If price is moving down while open interest is also decreasing, it means that long positions are being closed. This is labeled as DD (Down/Down), or "Longs Closing."
These are stored in separate arrays and displayed at specific price levels.
It is particularly useful for identifying:
Where longs or shorts are opening/closing positions
Stacked imbalances (indicative of potential absorption or exhaustion)
Value area zones and POC (Point of Control) based on OI, not volume
This footprint runs on your choice of sub-bar granularity and is ideal for high-frequency trading, scalping, and entries based on order flow dynamics.
Key Features
Footprint Visualization
At each price level within a candle:
Long/short opening and closing behavior is broken down.
Delta (net open interest change) is displayed both numerically and color-coded.
Optional gradient coloring shows intensity and type of flow (longs/shorts opened/closed).
Cumulative or per-bar reset modes allow you to track OI evolution over time.
The image above explains the information that each Footprint box shows across a candlestick!
Each footprint box shows:
OI Delta
OI Delta %
Longs Opened (LO)
Longs Closed (LC)
Shorts Opened (SO)
Shorts Closed (SC)
The image above explains the color-coding feature of the indicator.
Boxes are color coded to show which position action
dominated at the price area.
For this example:
Green boxes = Long positions being opened dominated
Purple boxes = Long positions being closed dominated
Red boxes = Short positions being opened dominated
Yellow boxes = Short positions being closed dominated
All colors are customizable.
Additionally, for traders who are only interested in whether OI increased/decreased, a "two-color" option is available in the settings.
For the two-color option, footprint boxes can be one of two colors. Showing whether OI increased or decreased at the level.
Cumulative Levels
Open Interest Footprint IQ contains a "Cumulative Levels" feature that tracks/stores open interest change at tick levels over time, rather than resetting per bar.
With the "Cumulative Levels" feature enabled, traders can see open interest changes persist across all candlesticks. This feature is useful for determining whether longs opening, longs closing, shorts opening, or shorts closing are dominating at particular price areas over time rather than on a single bar.
A useful feature to see if shorts/longs are favoring certain price throughout the day, week, month, etc.
Input Settings Explained
Granularity (Dropdown: Granularity)
Options: 1-Minute, 1-Second, 1-Tick
Determines how finely the script samples the lower timeframe data to construct the footprint.
For precision:
1-Tick = Highest accuracy, but more resource-intensive.
1-Second/1-Minute = Suitable for broader or more zoomed-out analysis.
Tick Level Distance (Tick Level Distance (0 = Auto))
Defines the vertical spacing between levels in the footprint chart.
If 0, the script uses an automatic calculation based on ATR to adapt to volatility.
Set a manual value (e.g., 5) to control the height granularity of each level in ticks.
Cumulative Levels (Toggle)
If enabled, the footprint builds cumulatively over time, rather than resetting per candle.
Use case: Visualize ongoing buildup of OI activity across a session or day.
Cumulative Levels Reset TF (Timeframe)
Sets the reset interval for the cumulative view (e.g., reset daily, hourly, etc.)
Works only when Cumulative Levels is enabled.
Delta Box Display Settings
Show Delta Percentage
Toggles the display of the percentage change in OI across the footprint level.
Helpful to gauge how aggressive positioning is relative to total OI at that level.
Show Longs/Shorts (Opened/Closed)
Show Longs Opened: Displays OI increase in up candles (price ↑, OI ↑).
Show Longs Closed: Displays OI decrease in down candles (price ↓, OI ↓).
Show Shorts Opened: OI increase in down candles (price ↓, OI ↑).
Show Shorts Closed: OI decrease in up candles (price ↑, OI ↓).
These behaviors are color-coded to give traders instant context:
Blue-green for longs opening.
Purple for longs closing.
Red for shorts opening.
Yellow for shorts closing.
Value Area & POC
Value Area % (Value Area %)
Controls how much cumulative open interest is used to define the value area.
Example: 70% means the smallest range of prices that contains 70% of total OI in that bar will be marked.
Helps identify zones of interest, support/resistance, and institutional levels.
The image above explains how to identify the VAH/VAL/POC shown by Open Interest Footprint IQ.
VAH = Upper 🞂
POC = ●
VAL = Lower 🞂
Imbalances
Imbalance Percentage
Defines the minimum delta % required at a level to be marked as an imbalance.
If the net open interest change at a level exceeds this threshold, a visual marker appears.
Stacked Imbalance Count
If the number of consecutive imbalance levels meets this count, a “Stacked Imbalance” alert will trigger.
This can signal aggressive buying or selling pressure, potential breakout zones, or institutional absorption.
Color Settings
Longs Opened / Closed, Shorts Opened / Closed
Customize the color palette for each order flow behavior.
These colors appear in the background gradient of the footprint boxes.
Up/Down Only Mode
Toggle to override all behavior-based colors with a single Up Color and Down Color.
Useful if you prefer a simple bull/bear view.
Up Color / Down Color
If "Up/Down Only" is enabled, these two colors are used to represent all net positive or negative deltas.
Special Notes
Crypto only: This script works only with crypto tickers on TradingView.
For other assets (stocks, futures), a warning message will appear instead.
OI data must be available from the exchange (many perpetual pairs support this).
If the footprint is too small or invisible, increase your tick level spacing in the settings.
Alerts
When a stacked imbalance is detected, an alert is fired ("Stacked Imbalance").
This feature is useful for automated systems, bots, or simply staying informed of potential trade setups.
And that's all for now!
If you have any questions or features you'd like to see feel free to share them in the comments below!
Thank you traders!

Tensor Market Analysis Engine (TMAE)# Tensor Market Analysis Engine (TMAE)
## Advanced Multi-Dimensional Mathematical Analysis System
*Where Quantum Mathematics Meets Market Structure*
---
## 🎓 THEORETICAL FOUNDATION
The Tensor Market Analysis Engine represents a revolutionary synthesis of three cutting-edge mathematical frameworks that have never before been combined for comprehensive market analysis. This indicator transcends traditional technical analysis by implementing advanced mathematical concepts from quantum mechanics, information theory, and fractal geometry.
### 🌊 Multi-Dimensional Volatility with Jump Detection
**Hawkes Process Implementation:**
The TMAE employs a sophisticated Hawkes process approximation for detecting self-exciting market jumps. Unlike traditional volatility measures that treat price movements as independent events, the Hawkes process recognizes that market shocks cluster and exhibit memory effects.
**Mathematical Foundation:**
```
Intensity λ(t) = μ + Σ α(t - Tᵢ)
```
Where market jumps at times Tᵢ increase the probability of future jumps through the decay function α, controlled by the Hawkes Decay parameter (0.5-0.99).
**Mahalanobis Distance Calculation:**
The engine calculates volatility jumps using multi-dimensional Mahalanobis distance across up to 5 volatility dimensions:
- **Dimension 1:** Price volatility (standard deviation of returns)
- **Dimension 2:** Volume volatility (normalized volume fluctuations)
- **Dimension 3:** Range volatility (high-low spread variations)
- **Dimension 4:** Correlation volatility (price-volume relationship changes)
- **Dimension 5:** Microstructure volatility (intrabar positioning analysis)
This creates a volatility state vector that captures market behavior impossible to detect with traditional single-dimensional approaches.
### 📐 Hurst Exponent Regime Detection
**Fractal Market Hypothesis Integration:**
The TMAE implements advanced Rescaled Range (R/S) analysis to calculate the Hurst exponent in real-time, providing dynamic regime classification:
- **H > 0.6:** Trending (persistent) markets - momentum strategies optimal
- **H < 0.4:** Mean-reverting (anti-persistent) markets - contrarian strategies optimal
- **H ≈ 0.5:** Random walk markets - breakout strategies preferred
**Adaptive R/S Analysis:**
Unlike static implementations, the TMAE uses adaptive windowing that adjusts to market conditions:
```
H = log(R/S) / log(n)
```
Where R is the range of cumulative deviations and S is the standard deviation over period n.
**Dynamic Regime Classification:**
The system employs hysteresis to prevent regime flipping, requiring sustained Hurst values before regime changes are confirmed. This prevents false signals during transitional periods.
### 🔄 Transfer Entropy Analysis
**Information Flow Quantification:**
Transfer entropy measures the directional flow of information between price and volume, revealing lead-lag relationships that indicate future price movements:
```
TE(X→Y) = Σ p(yₜ₊₁, yₜ, xₜ) log
```
**Causality Detection:**
- **Volume → Price:** Indicates accumulation/distribution phases
- **Price → Volume:** Suggests retail participation or momentum chasing
- **Balanced Flow:** Market equilibrium or transition periods
The system analyzes multiple lag periods (2-20 bars) to capture both immediate and structural information flows.
---
## 🔧 COMPREHENSIVE INPUT SYSTEM
### Core Parameters Group
**Primary Analysis Window (10-100, Default: 50)**
The fundamental lookback period affecting all calculations. Optimization by timeframe:
- **1-5 minute charts:** 20-30 (rapid adaptation to micro-movements)
- **15 minute-1 hour:** 30-50 (balanced responsiveness and stability)
- **4 hour-daily:** 50-100 (smooth signals, reduced noise)
- **Asset-specific:** Cryptocurrency 20-35, Stocks 35-50, Forex 40-60
**Signal Sensitivity (0.1-2.0, Default: 0.7)**
Master control affecting all threshold calculations:
- **Conservative (0.3-0.6):** High-quality signals only, fewer false positives
- **Balanced (0.7-1.0):** Optimal risk-reward ratio for most trading styles
- **Aggressive (1.1-2.0):** Maximum signal frequency, requires careful filtering
**Signal Generation Mode:**
- **Aggressive:** Any component signals (highest frequency)
- **Confluence:** 2+ components agree (balanced approach)
- **Conservative:** All 3 components align (highest quality)
### Volatility Jump Detection Group
**Volatility Dimensions (2-5, Default: 3)**
Determines the mathematical space complexity:
- **2D:** Price + Volume volatility (suitable for clean markets)
- **3D:** + Range volatility (optimal for most conditions)
- **4D:** + Correlation volatility (advanced multi-asset analysis)
- **5D:** + Microstructure volatility (maximum sensitivity)
**Jump Detection Threshold (1.5-4.0σ, Default: 3.0σ)**
Standard deviations required for volatility jump classification:
- **Cryptocurrency:** 2.0-2.5σ (naturally volatile)
- **Stock Indices:** 2.5-3.0σ (moderate volatility)
- **Forex Major Pairs:** 3.0-3.5σ (typically stable)
- **Commodities:** 2.0-3.0σ (varies by commodity)
**Jump Clustering Decay (0.5-0.99, Default: 0.85)**
Hawkes process memory parameter:
- **0.5-0.7:** Fast decay (jumps treated as independent)
- **0.8-0.9:** Moderate clustering (realistic market behavior)
- **0.95-0.99:** Strong clustering (crisis/event-driven markets)
### Hurst Exponent Analysis Group
**Calculation Method Options:**
- **Classic R/S:** Original Rescaled Range (fast, simple)
- **Adaptive R/S:** Dynamic windowing (recommended for trading)
- **DFA:** Detrended Fluctuation Analysis (best for noisy data)
**Trending Threshold (0.55-0.8, Default: 0.60)**
Hurst value defining persistent market behavior:
- **0.55-0.60:** Weak trend persistence
- **0.65-0.70:** Clear trending behavior
- **0.75-0.80:** Strong momentum regimes
**Mean Reversion Threshold (0.2-0.45, Default: 0.40)**
Hurst value defining anti-persistent behavior:
- **0.35-0.45:** Weak mean reversion
- **0.25-0.35:** Clear ranging behavior
- **0.15-0.25:** Strong reversion tendency
### Transfer Entropy Parameters Group
**Information Flow Analysis:**
- **Price-Volume:** Classic flow analysis for accumulation/distribution
- **Price-Volatility:** Risk flow analysis for sentiment shifts
- **Multi-Timeframe:** Cross-timeframe causality detection
**Maximum Lag (2-20, Default: 5)**
Causality detection window:
- **2-5 bars:** Immediate causality (scalping)
- **5-10 bars:** Short-term flow (day trading)
- **10-20 bars:** Structural flow (swing trading)
**Significance Threshold (0.05-0.3, Default: 0.15)**
Minimum entropy for signal generation:
- **0.05-0.10:** Detect subtle information flows
- **0.10-0.20:** Clear causality only
- **0.20-0.30:** Very strong flows only
---
## 🎨 ADVANCED VISUAL SYSTEM
### Tensor Volatility Field Visualization
**Five-Layer Resonance Bands:**
The tensor field creates dynamic support/resistance zones that expand and contract based on mathematical field strength:
- **Core Layer (Purple):** Primary tensor field with highest intensity
- **Layer 2 (Neutral):** Secondary mathematical resonance
- **Layer 3 (Info Blue):** Tertiary harmonic frequencies
- **Layer 4 (Warning Gold):** Outer field boundaries
- **Layer 5 (Success Green):** Maximum field extension
**Field Strength Calculation:**
```
Field Strength = min(3.0, Mahalanobis Distance × Tensor Intensity)
```
The field amplitude adjusts to ATR and mathematical distance, creating dynamic zones that respond to market volatility.
**Radiation Line Network:**
During active tensor states, the system projects directional radiation lines showing field energy distribution:
- **8 Directional Rays:** Complete angular coverage
- **Tapering Segments:** Progressive transparency for natural visual flow
- **Pulse Effects:** Enhanced visualization during volatility jumps
### Dimensional Portal System
**Portal Mathematics:**
Dimensional portals visualize regime transitions using category theory principles:
- **Green Portals (◉):** Trending regime detection (appear below price for support)
- **Red Portals (◎):** Mean-reverting regime (appear above price for resistance)
- **Yellow Portals (○):** Random walk regime (neutral positioning)
**Tensor Trail Effects:**
Each portal generates 8 trailing particles showing mathematical momentum:
- **Large Particles (●):** Strong mathematical signal
- **Medium Particles (◦):** Moderate signal strength
- **Small Particles (·):** Weak signal continuation
- **Micro Particles (˙):** Signal dissipation
### Information Flow Streams
**Particle Stream Visualization:**
Transfer entropy creates flowing particle streams indicating information direction:
- **Upward Streams:** Volume leading price (accumulation phases)
- **Downward Streams:** Price leading volume (distribution phases)
- **Stream Density:** Proportional to information flow strength
**15-Particle Evolution:**
Each stream contains 15 particles with progressive sizing and transparency, creating natural flow visualization that makes information transfer immediately apparent.
### Fractal Matrix Grid System
**Multi-Timeframe Fractal Levels:**
The system calculates and displays fractal highs/lows across five Fibonacci periods:
- **8-Period:** Short-term fractal structure
- **13-Period:** Intermediate-term patterns
- **21-Period:** Primary swing levels
- **34-Period:** Major structural levels
- **55-Period:** Long-term fractal boundaries
**Triple-Layer Visualization:**
Each fractal level uses three-layer rendering:
- **Shadow Layer:** Widest, darkest foundation (width 5)
- **Glow Layer:** Medium white core line (width 3)
- **Tensor Layer:** Dotted mathematical overlay (width 1)
**Intelligent Labeling System:**
Smart spacing prevents label overlap using ATR-based minimum distances. Labels include:
- **Fractal Period:** Time-based identification
- **Topological Class:** Mathematical complexity rating (0, I, II, III)
- **Price Level:** Exact fractal price
- **Mahalanobis Distance:** Current mathematical field strength
- **Hurst Exponent:** Current regime classification
- **Anomaly Indicators:** Visual strength representations (○ ◐ ● ⚡)
### Wick Pressure Analysis
**Rejection Level Mathematics:**
The system analyzes candle wick patterns to project future pressure zones:
- **Upper Wick Analysis:** Identifies selling pressure and resistance zones
- **Lower Wick Analysis:** Identifies buying pressure and support zones
- **Pressure Projection:** Extends lines forward based on mathematical probability
**Multi-Layer Glow Effects:**
Wick pressure lines use progressive transparency (1-8 layers) creating natural glow effects that make pressure zones immediately visible without cluttering the chart.
### Enhanced Regime Background
**Dynamic Intensity Mapping:**
Background colors reflect mathematical regime strength:
- **Deep Transparency (98% alpha):** Subtle regime indication
- **Pulse Intensity:** Based on regime strength calculation
- **Color Coding:** Green (trending), Red (mean-reverting), Neutral (random)
**Smoothing Integration:**
Regime changes incorporate 10-bar smoothing to prevent background flicker while maintaining responsiveness to genuine regime shifts.
### Color Scheme System
**Six Professional Themes:**
- **Dark (Default):** Professional trading environment optimization
- **Light:** High ambient light conditions
- **Classic:** Traditional technical analysis appearance
- **Neon:** High-contrast visibility for active trading
- **Neutral:** Minimal distraction focus
- **Bright:** Maximum visibility for complex setups
Each theme maintains mathematical accuracy while optimizing visual clarity for different trading environments and personal preferences.
---
## 📊 INSTITUTIONAL-GRADE DASHBOARD
### Tensor Field Status Section
**Field Strength Display:**
Real-time Mahalanobis distance calculation with dynamic emoji indicators:
- **⚡ (Lightning):** Extreme field strength (>1.5× threshold)
- **● (Solid Circle):** Strong field activity (>1.0× threshold)
- **○ (Open Circle):** Normal field state
**Signal Quality Rating:**
Democratic algorithm assessment:
- **ELITE:** All 3 components aligned (highest probability)
- **STRONG:** 2 components aligned (good probability)
- **GOOD:** 1 component active (moderate probability)
- **WEAK:** No clear component signals
**Threshold and Anomaly Monitoring:**
- **Threshold Display:** Current mathematical threshold setting
- **Anomaly Level (0-100%):** Combined volatility and volume spike measurement
- **>70%:** High anomaly (red warning)
- **30-70%:** Moderate anomaly (orange caution)
- **<30%:** Normal conditions (green confirmation)
### Tensor State Analysis Section
**Mathematical State Classification:**
- **↑ BULL (Tensor State +1):** Trending regime with bullish bias
- **↓ BEAR (Tensor State -1):** Mean-reverting regime with bearish bias
- **◈ SUPER (Tensor State 0):** Random walk regime (neutral)
**Visual State Gauge:**
Five-circle progression showing tensor field polarity:
- **🟢🟢🟢⚪⚪:** Strong bullish mathematical alignment
- **⚪⚪🟡⚪⚪:** Neutral/transitional state
- **⚪⚪🔴🔴🔴:** Strong bearish mathematical alignment
**Trend Direction and Phase Analysis:**
- **📈 BULL / 📉 BEAR / ➡️ NEUTRAL:** Primary trend classification
- **🌪️ CHAOS:** Extreme information flow (>2.0 flow strength)
- **⚡ ACTIVE:** Strong information flow (1.0-2.0 flow strength)
- **😴 CALM:** Low information flow (<1.0 flow strength)
### Trading Signals Section
**Real-Time Signal Status:**
- **🟢 ACTIVE / ⚪ INACTIVE:** Long signal availability
- **🔴 ACTIVE / ⚪ INACTIVE:** Short signal availability
- **Components (X/3):** Active algorithmic components
- **Mode Display:** Current signal generation mode
**Signal Strength Visualization:**
Color-coded component count:
- **Green:** 3/3 components (maximum confidence)
- **Aqua:** 2/3 components (good confidence)
- **Orange:** 1/3 components (moderate confidence)
- **Gray:** 0/3 components (no signals)
### Performance Metrics Section
**Win Rate Monitoring:**
Estimated win rates based on signal quality with emoji indicators:
- **🔥 (Fire):** ≥60% estimated win rate
- **👍 (Thumbs Up):** 45-59% estimated win rate
- **⚠️ (Warning):** <45% estimated win rate
**Mathematical Metrics:**
- **Hurst Exponent:** Real-time fractal dimension (0.000-1.000)
- **Information Flow:** Volume/price leading indicators
- **📊 VOL:** Volume leading price (accumulation/distribution)
- **💰 PRICE:** Price leading volume (momentum/speculation)
- **➖ NONE:** Balanced information flow
- **Volatility Classification:**
- **🔥 HIGH:** Above 1.5× jump threshold
- **📊 NORM:** Normal volatility range
- **😴 LOW:** Below 0.5× jump threshold
### Market Structure Section (Large Dashboard)
**Regime Classification:**
- **📈 TREND:** Hurst >0.6, momentum strategies optimal
- **🔄 REVERT:** Hurst <0.4, contrarian strategies optimal
- **🎲 RANDOM:** Hurst ≈0.5, breakout strategies preferred
**Mathematical Field Analysis:**
- **Dimensions:** Current volatility space complexity (2D-5D)
- **Hawkes λ (Lambda):** Self-exciting jump intensity (0.00-1.00)
- **Jump Status:** 🚨 JUMP (active) / ✅ NORM (normal)
### Settings Summary Section (Large Dashboard)
**Active Configuration Display:**
- **Sensitivity:** Current master sensitivity setting
- **Lookback:** Primary analysis window
- **Theme:** Active color scheme
- **Method:** Hurst calculation method (Classic R/S, Adaptive R/S, DFA)
**Dashboard Sizing Options:**
- **Small:** Essential metrics only (mobile/small screens)
- **Normal:** Balanced information density (standard desktop)
- **Large:** Maximum detail (multi-monitor setups)
**Position Options:**
- **Top Right:** Standard placement (avoids price action)
- **Top Left:** Wide chart optimization
- **Bottom Right:** Recent price focus (scalping)
- **Bottom Left:** Maximum price visibility (swing trading)
---
## 🎯 SIGNAL GENERATION LOGIC
### Multi-Component Convergence System
**Component Signal Architecture:**
The TMAE generates signals through sophisticated component analysis rather than simple threshold crossing:
**Volatility Component:**
- **Jump Detection:** Mahalanobis distance threshold breach
- **Hawkes Intensity:** Self-exciting process activation (>0.2)
- **Multi-dimensional:** Considers all volatility dimensions simultaneously
**Hurst Regime Component:**
- **Trending Markets:** Price above SMA-20 with positive momentum
- **Mean-Reverting Markets:** Price at Bollinger Band extremes
- **Random Markets:** Bollinger squeeze breakouts with directional confirmation
**Transfer Entropy Component:**
- **Volume Leadership:** Information flow from volume to price
- **Volume Spike:** Volume 110%+ above 20-period average
- **Flow Significance:** Above entropy threshold with directional bias
### Democratic Signal Weighting
**Signal Mode Implementation:**
- **Aggressive Mode:** Any single component triggers signal
- **Confluence Mode:** Minimum 2 components must agree
- **Conservative Mode:** All 3 components must align
**Momentum Confirmation:**
All signals require momentum confirmation:
- **Long Signals:** RSI >50 AND price >EMA-9
- **Short Signals:** RSI <50 AND price 0.6):**
- **Increase Sensitivity:** Catch momentum continuation
- **Lower Mean Reversion Threshold:** Avoid counter-trend signals
- **Emphasize Volume Leadership:** Institutional accumulation/distribution
- **Tensor Field Focus:** Use expansion for trend continuation
- **Signal Mode:** Aggressive or Confluence for trend following
**Range-Bound Markets (Hurst <0.4):**
- **Decrease Sensitivity:** Avoid false breakouts
- **Lower Trending Threshold:** Quick regime recognition
- **Focus on Price Leadership:** Retail sentiment extremes
- **Fractal Grid Emphasis:** Support/resistance trading
- **Signal Mode:** Conservative for high-probability reversals
**Volatile Markets (High Jump Frequency):**
- **Increase Hawkes Decay:** Recognize event clustering
- **Higher Jump Threshold:** Avoid noise signals
- **Maximum Dimensions:** Capture full volatility complexity
- **Reduce Position Sizing:** Risk management adaptation
- **Enhanced Visuals:** Maximum information for rapid decisions
**Low Volatility Markets (Low Jump Frequency):**
- **Decrease Jump Threshold:** Capture subtle movements
- **Lower Hawkes Decay:** Treat moves as independent
- **Reduce Dimensions:** Simplify analysis
- **Increase Position Sizing:** Capitalize on compressed volatility
- **Minimal Visuals:** Reduce distraction in quiet markets
---
## 🚀 ADVANCED TRADING STRATEGIES
### The Mathematical Convergence Method
**Entry Protocol:**
1. **Fractal Grid Approach:** Monitor price approaching significant fractal levels
2. **Tensor Field Confirmation:** Verify field expansion supporting direction
3. **Portal Signal:** Wait for dimensional portal appearance
4. **ELITE/STRONG Quality:** Only trade highest quality mathematical signals
5. **Component Consensus:** Confirm 2+ components agree in Confluence mode
**Example Implementation:**
- Price approaching 21-period fractal high
- Tensor field expanding upward (bullish mathematical alignment)
- Green portal appears below price (trending regime confirmation)
- ELITE quality signal with 3/3 components active
- Enter long position with stop below fractal level
**Risk Management:**
- **Stop Placement:** Below/above fractal level that generated signal
- **Position Sizing:** Based on Mahalanobis distance (higher distance = smaller size)
- **Profit Targets:** Next fractal level or tensor field resistance
### The Regime Transition Strategy
**Regime Change Detection:**
1. **Monitor Hurst Exponent:** Watch for persistent moves above/below thresholds
2. **Portal Color Change:** Regime transitions show different portal colors
3. **Background Intensity:** Increasing regime background intensity
4. **Mathematical Confirmation:** Wait for regime confirmation (hysteresis)
**Trading Implementation:**
- **Trending Transitions:** Trade momentum breakouts, follow trend
- **Mean Reversion Transitions:** Trade range boundaries, fade extremes
- **Random Transitions:** Trade breakouts with tight stops
**Advanced Techniques:**
- **Multi-Timeframe:** Confirm regime on higher timeframe
- **Early Entry:** Enter on regime transition rather than confirmation
- **Regime Strength:** Larger positions during strong regime signals
### The Information Flow Momentum Strategy
**Flow Detection Protocol:**
1. **Monitor Transfer Entropy:** Watch for significant information flow shifts
2. **Volume Leadership:** Strong edge when volume leads price
3. **Flow Acceleration:** Increasing flow strength indicates momentum
4. **Directional Confirmation:** Ensure flow aligns with intended trade direction
**Entry Signals:**
- **Volume → Price Flow:** Enter during accumulation/distribution phases
- **Price → Volume Flow:** Enter on momentum confirmation breaks
- **Flow Reversal:** Counter-trend entries when flow reverses
**Optimization:**
- **Scalping:** Use immediate flow detection (2-5 bar lag)
- **Swing Trading:** Use structural flow (10-20 bar lag)
- **Multi-Asset:** Compare flow between correlated assets
### The Tensor Field Expansion Strategy
**Field Mathematics:**
The tensor field expansion indicates mathematical pressure building in market structure:
**Expansion Phases:**
1. **Compression:** Field contracts, volatility decreases
2. **Tension Building:** Mathematical pressure accumulates
3. **Expansion:** Field expands rapidly with directional movement
4. **Resolution:** Field stabilizes at new equilibrium
**Trading Applications:**
- **Compression Trading:** Prepare for breakout during field contraction
- **Expansion Following:** Trade direction of field expansion
- **Reversion Trading:** Fade extreme field expansion
- **Multi-Dimensional:** Consider all field layers for confirmation
### The Hawkes Process Event Strategy
**Self-Exciting Jump Trading:**
Understanding that market shocks cluster and create follow-on opportunities:
**Jump Sequence Analysis:**
1. **Initial Jump:** First volatility jump detected
2. **Clustering Phase:** Hawkes intensity remains elevated
3. **Follow-On Opportunities:** Additional jumps more likely
4. **Decay Period:** Intensity gradually decreases
**Implementation:**
- **Jump Confirmation:** Wait for mathematical jump confirmation
- **Direction Assessment:** Use other components for direction
- **Clustering Trades:** Trade subsequent moves during high intensity
- **Decay Exit:** Exit positions as Hawkes intensity decays
### The Fractal Confluence System
**Multi-Timeframe Fractal Analysis:**
Combining fractal levels across different periods for high-probability zones:
**Confluence Zones:**
- **Double Confluence:** 2 fractal levels align
- **Triple Confluence:** 3+ fractal levels cluster
- **Mathematical Confirmation:** Tensor field supports the level
- **Information Flow:** Transfer entropy confirms direction
**Trading Protocol:**
1. **Identify Confluence:** Find 2+ fractal levels within 1 ATR
2. **Mathematical Support:** Verify tensor field alignment
3. **Signal Quality:** Wait for STRONG or ELITE signal
4. **Risk Definition:** Use fractal level for stop placement
5. **Profit Targeting:** Next major fractal confluence zone
---
## ⚠️ COMPREHENSIVE RISK MANAGEMENT
### Mathematical Position Sizing
**Mahalanobis Distance Integration:**
Position size should inversely correlate with mathematical field strength:
```
Position Size = Base Size × (Threshold / Mahalanobis Distance)
```
**Risk Scaling Matrix:**
- **Low Field Strength (<2.0):** Standard position sizing
- **Moderate Field Strength (2.0-3.0):** 75% position sizing
- **High Field Strength (3.0-4.0):** 50% position sizing
- **Extreme Field Strength (>4.0):** 25% position sizing or no trade
### Signal Quality Risk Adjustment
**Quality-Based Position Sizing:**
- **ELITE Signals:** 100% of planned position size
- **STRONG Signals:** 75% of planned position size
- **GOOD Signals:** 50% of planned position size
- **WEAK Signals:** No position or paper trading only
**Component Agreement Scaling:**
- **3/3 Components:** Full position size
- **2/3 Components:** 75% position size
- **1/3 Components:** 50% position size or skip trade
### Regime-Adaptive Risk Management
**Trending Market Risk:**
- **Wider Stops:** Allow for trend continuation
- **Trend Following:** Trade with regime direction
- **Higher Position Size:** Trend probability advantage
- **Momentum Stops:** Trail stops based on momentum indicators
**Mean-Reverting Market Risk:**
- **Tighter Stops:** Quick exits on trend continuation
- **Contrarian Positioning:** Trade against extremes
- **Smaller Position Size:** Higher reversal failure rate
- **Level-Based Stops:** Use fractal levels for stops
**Random Market Risk:**
- **Breakout Focus:** Trade only clear breakouts
- **Tight Initial Stops:** Quick exit if breakout fails
- **Reduced Frequency:** Skip marginal setups
- **Range-Based Targets:** Profit targets at range boundaries
### Volatility-Adaptive Risk Controls
**High Volatility Periods:**
- **Reduced Position Size:** Account for wider price swings
- **Wider Stops:** Avoid noise-based exits
- **Lower Frequency:** Skip marginal setups
- **Faster Exits:** Take profits more quickly
**Low Volatility Periods:**
- **Standard Position Size:** Normal risk parameters
- **Tighter Stops:** Take advantage of compressed ranges
- **Higher Frequency:** Trade more setups
- **Extended Targets:** Allow for compressed volatility expansion
### Multi-Timeframe Risk Alignment
**Higher Timeframe Trend:**
- **With Trend:** Standard or increased position size
- **Against Trend:** Reduced position size or skip
- **Neutral Trend:** Standard position size with tight management
**Risk Hierarchy:**
1. **Primary:** Current timeframe signal quality
2. **Secondary:** Higher timeframe trend alignment
3. **Tertiary:** Mathematical field strength
4. **Quaternary:** Market regime classification
---
## 📚 EDUCATIONAL VALUE AND MATHEMATICAL CONCEPTS
### Advanced Mathematical Concepts
**Tensor Analysis in Markets:**
The TMAE introduces traders to tensor analysis, a branch of mathematics typically reserved for physics and advanced engineering. Tensors provide a framework for understanding multi-dimensional market relationships that scalar and vector analysis cannot capture.
**Information Theory Applications:**
Transfer entropy implementation teaches traders about information flow in markets, a concept from information theory that quantifies directional causality between variables. This provides intuition about market microstructure and participant behavior.
**Fractal Geometry in Trading:**
The Hurst exponent calculation exposes traders to fractal geometry concepts, helping understand that markets exhibit self-similar patterns across multiple timeframes. This mathematical insight transforms how traders view market structure.
**Stochastic Process Theory:**
The Hawkes process implementation introduces concepts from stochastic process theory, specifically self-exciting point processes. This provides mathematical framework for understanding why market events cluster and exhibit memory effects.
### Learning Progressive Complexity
**Beginner Mathematical Concepts:**
- **Volatility Dimensions:** Understanding multi-dimensional analysis
- **Regime Classification:** Learning market personality types
- **Signal Democracy:** Algorithmic consensus building
- **Visual Mathematics:** Interpreting mathematical concepts visually
**Intermediate Mathematical Applications:**
- **Mahalanobis Distance:** Statistical distance in multi-dimensional space
- **Rescaled Range Analysis:** Fractal dimension measurement
- **Information Entropy:** Quantifying uncertainty and causality
- **Field Theory:** Understanding mathematical fields in market context
**Advanced Mathematical Integration:**
- **Tensor Field Dynamics:** Multi-dimensional market force analysis
- **Stochastic Self-Excitation:** Event clustering and memory effects
- **Categorical Composition:** Mathematical signal combination theory
- **Topological Market Analysis:** Understanding market shape and connectivity
### Practical Mathematical Intuition
**Developing Market Mathematics Intuition:**
The TMAE serves as a bridge between abstract mathematical concepts and practical trading applications. Traders develop intuitive understanding of:
- **How markets exhibit mathematical structure beneath apparent randomness**
- **Why multi-dimensional analysis reveals patterns invisible to single-variable approaches**
- **How information flows through markets in measurable, predictable ways**
- **Why mathematical models provide probabilistic edges rather than certainties**
---
## 🔬 IMPLEMENTATION AND OPTIMIZATION
### Getting Started Protocol
**Phase 1: Observation (Week 1)**
1. **Apply with defaults:** Use standard settings on your primary trading timeframe
2. **Study visual elements:** Learn to interpret tensor fields, portals, and streams
3. **Monitor dashboard:** Observe how metrics change with market conditions
4. **No trading:** Focus entirely on pattern recognition and understanding
**Phase 2: Pattern Recognition (Week 2-3)**
1. **Identify signal patterns:** Note what market conditions produce different signal qualities
2. **Regime correlation:** Observe how Hurst regimes affect signal performance
3. **Visual confirmation:** Learn to read tensor field expansion and portal signals
4. **Component analysis:** Understand which components drive signals in different markets
**Phase 3: Parameter Optimization (Week 4-5)**
1. **Asset-specific tuning:** Adjust parameters for your specific trading instrument
2. **Timeframe optimization:** Fine-tune for your preferred trading timeframe
3. **Sensitivity adjustment:** Balance signal frequency with quality
4. **Visual customization:** Optimize colors and intensity for your trading environment
**Phase 4: Live Implementation (Week 6+)**
1. **Paper trading:** Test signals with hypothetical trades
2. **Small position sizing:** Begin with minimal risk during learning phase
3. **Performance tracking:** Monitor actual vs. expected signal performance
4. **Continuous optimization:** Refine settings based on real performance data
### Performance Monitoring System
**Signal Quality Tracking:**
- **ELITE Signal Win Rate:** Track highest quality signals separately
- **Component Performance:** Monitor which components provide best signals
- **Regime Performance:** Analyze performance across different market regimes
- **Timeframe Analysis:** Compare performance across different session times
**Mathematical Metric Correlation:**
- **Field Strength vs. Performance:** Higher field strength should correlate with better performance
- **Component Agreement vs. Win Rate:** More component agreement should improve win rates
- **Regime Alignment vs. Success:** Trading with mathematical regime should outperform
### Continuous Optimization Process
**Monthly Review Protocol:**
1. **Performance Analysis:** Review win rates, profit factors, and maximum drawdown
2. **Parameter Assessment:** Evaluate if current settings remain optimal
3. **Market Adaptation:** Adjust for changes in market character or volatility
4. **Component Weighting:** Consider if certain components should receive more/less emphasis
**Quarterly Deep Analysis:**
1. **Mathematical Model Validation:** Verify that mathematical relationships remain valid
2. **Regime Distribution:** Analyze time spent in different market regimes
3. **Signal Evolution:** Track how signal characteristics change over time
4. **Correlation Analysis:** Monitor correlations between different mathematical components
---
## 🌟 UNIQUE INNOVATIONS AND CONTRIBUTIONS
### Revolutionary Mathematical Integration
**First-Ever Implementations:**
1. **Multi-Dimensional Volatility Tensor:** First indicator to implement true tensor analysis for market volatility
2. **Real-Time Hawkes Process:** First trading implementation of self-exciting point processes
3. **Transfer Entropy Trading Signals:** First practical application of information theory for trade generation
4. **Democratic Component Voting:** First algorithmic consensus system for signal generation
5. **Fractal-Projected Signal Quality:** First system to predict signal quality at future price levels
### Advanced Visualization Innovations
**Mathematical Visualization Breakthroughs:**
- **Tensor Field Radiation:** Visual representation of mathematical field energy
- **Dimensional Portal System:** Category theory visualization for regime transitions
- **Information Flow Streams:** Real-time visual display of market information transfer
- **Multi-Layer Fractal Grid:** Intelligent spacing and projection system
- **Regime Intensity Mapping:** Dynamic background showing mathematical regime strength
### Practical Trading Innovations
**Trading System Advances:**
- **Quality-Weighted Signal Generation:** Signals rated by mathematical confidence
- **Regime-Adaptive Strategy Selection:** Automatic strategy optimization based on market personality
- **Anti-Spam Signal Protection:** Mathematical prevention of signal clustering
- **Component Performance Tracking:** Real-time monitoring of algorithmic component success
- **Field-Strength Position Sizing:** Mathematical volatility integration for risk management
---
## ⚖️ RESPONSIBLE USAGE AND LIMITATIONS
### Mathematical Model Limitations
**Understanding Model Boundaries:**
While the TMAE implements sophisticated mathematical concepts, traders must understand fundamental limitations:
- **Markets Are Not Purely Mathematical:** Human psychology, news events, and fundamental factors create unpredictable elements
- **Past Performance Limitations:** Mathematical relationships that worked historically may not persist indefinitely
- **Model Risk:** Complex models can fail during unprecedented market conditions
- **Overfitting Potential:** Highly optimized parameters may not generalize to future market conditions
### Proper Implementation Guidelines
**Risk Management Requirements:**
- **Never Risk More Than 2% Per Trade:** Regardless of signal quality
- **Diversification Mandatory:** Don't rely solely on mathematical signals
- **Position Sizing Discipline:** Use mathematical field strength for sizing, not confidence
- **Stop Loss Non-Negotiable:** Every trade must have predefined risk parameters
**Realistic Expectations:**
- **Mathematical Edge, Not Certainty:** The indicator provides probabilistic advantages, not guaranteed outcomes
- **Learning Curve Required:** Complex mathematical concepts require time to master
- **Market Adaptation Necessary:** Parameters must evolve with changing market conditions
- **Continuous Education Important:** Understanding underlying mathematics improves application
### Ethical Trading Considerations
**Market Impact Awareness:**
- **Information Asymmetry:** Advanced mathematical analysis may provide advantages over other market participants
- **Position Size Responsibility:** Large positions based on mathematical signals can impact market structure
- **Sharing Knowledge:** Consider educational contributions to trading community
- **Fair Market Participation:** Use mathematical advantages responsibly within market framework
### Professional Development Path
**Skill Development Sequence:**
1. **Basic Mathematical Literacy:** Understand fundamental concepts before advanced application
2. **Risk Management Mastery:** Develop disciplined risk control before relying on complex signals
3. **Market Psychology Understanding:** Combine mathematical analysis with behavioral market insights
4. **Continuous Learning:** Stay updated on mathematical finance developments and market evolution
---
## 🔮 CONCLUSION
The Tensor Market Analysis Engine represents a quantum leap forward in technical analysis, successfully bridging the gap between advanced pure mathematics and practical trading applications. By integrating multi-dimensional volatility analysis, fractal market theory, and information flow dynamics, the TMAE reveals market structure invisible to conventional analysis while maintaining visual clarity and practical usability.
### Mathematical Innovation Legacy
This indicator establishes new paradigms in technical analysis:
- **Tensor analysis for market volatility understanding**
- **Stochastic self-excitation for event clustering prediction**
- **Information theory for causality-based trade generation**
- **Democratic algorithmic consensus for signal quality enhancement**
- **Mathematical field visualization for intuitive market understanding**
### Practical Trading Revolution
Beyond mathematical innovation, the TMAE transforms practical trading:
- **Quality-rated signals replace binary buy/sell decisions**
- **Regime-adaptive strategies automatically optimize for market personality**
- **Multi-dimensional risk management integrates mathematical volatility measures**
- **Visual mathematical concepts make complex analysis immediately interpretable**
- **Educational value creates lasting improvement in trading understanding**
### Future-Proof Design
The mathematical foundations ensure lasting relevance:
- **Universal mathematical principles transcend market evolution**
- **Multi-dimensional analysis adapts to new market structures**
- **Regime detection automatically adjusts to changing market personalities**
- **Component democracy allows for future algorithmic additions**
- **Mathematical visualization scales with increasing market complexity**
### Commitment to Excellence
The TMAE represents more than an indicator—it embodies a philosophy of bringing rigorous mathematical analysis to trading while maintaining practical utility and visual elegance. Every component, from the multi-dimensional tensor fields to the democratic signal generation, reflects a commitment to mathematical accuracy, trading practicality, and educational value.
### Trading with Mathematical Precision
In an era where markets grow increasingly complex and computational, the TMAE provides traders with mathematical tools previously available only to institutional quantitative research teams. Yet unlike academic mathematical models, the TMAE translates complex concepts into intuitive visual representations and practical trading signals.
By combining the mathematical rigor of tensor analysis, the statistical power of multi-dimensional volatility modeling, and the information-theoretic insights of transfer entropy, traders gain unprecedented insight into market structure and dynamics.
### Final Perspective
Markets, like nature, exhibit profound mathematical beauty beneath apparent chaos. The Tensor Market Analysis Engine serves as a mathematical lens that reveals this hidden order, transforming how traders perceive and interact with market structure.
Through mathematical precision, visual elegance, and practical utility, the TMAE empowers traders to see beyond the noise and trade with the confidence that comes from understanding the mathematical principles governing market behavior.
Trade with mathematical insight. Trade with the power of tensors. Trade with the TMAE.
*"In mathematics, you don't understand things. You just get used to them." - John von Neumann*
*With the TMAE, mathematical market understanding becomes not just possible, but intuitive.*
— Dskyz, Trade with insight. Trade with anticipation.

Enhanced Volume Trend Indicator with BB SqueezeEnhanced Volume Trend Indicator with BB Squeeze: Comprehensive Explanation
The visualization system allows traders to quickly scan multiple securities to identify high-probability setups without detailed analysis of each chart. The progression from squeeze to breakout, supported by volume trend confirmation, offers a systematic approach to identifying trading opportunities.
The script combines multiple technical analysis approaches into a comprehensive dashboard that helps traders make informed decisions by identifying high-probability setups while filtering out noise through its sophisticated confirmation requirements. It combines multiple technical analysis approaches into an integrated visual system that helps traders identify potential trading opportunities while filtering out false signals.
Core Features
1. Volume Analysis Dashboard
The indicator displays various volume-related metrics in customizable tables:
AVOL (After Hours + Pre-Market Volume): Shows extended hours volume as a percentage of the 21-day average volume with color coding for buying/selling pressure. Green indicates buying pressure and red indicates selling pressure.
Volume Metrics: Includes regular volume (VOL), dollar volume ($VOL), relative volume compared to 21-day average (RVOL), and relative volume compared to 90-day average (RVOL90D).
Pre-Market Data: Optional display of pre-market volume (PVOL), pre-market dollar volume (P$VOL), pre-market relative volume (PRVOL), and pre-market price change percentage (PCHG%).
2. Enhanced Volume Trend (VTR) Analysis
The Volume Trend indicator uses adaptive analysis to evaluate buying and selling pressure, combining multiple factors:
MACD (Moving Average Convergence Divergence) components
Volume-to-SMA (Simple Moving Average) ratio
Price direction and market conditions
Volume change rates and momentum
EMA (Exponential Moving Average) alignment and crossovers
Volatility filtering
VTR Visual Indicators
The VTR score ranges from 0-100, with values above 50 indicating bullish conditions and below 50 indicating bearish conditions. This is visually represented by colored circles:
"●" (Filled Circle):
Green: Strong bullish trend (VTR ≥ 80)
Red: Strong bearish trend (VTR ≤ 20)
"◯" (Hollow Circle):
Green: Moderate bullish trend (VTR 65-79)
Red: Moderate bearish trend (VTR 21-35)
"·" (Small Dot):
Green: Weak bullish trend (VTR 55-64)
Red: Weak bearish trend (VTR 36-45)
"○" (Medium Hollow Circle): Neutral conditions (VTR 46-54), shown in gray
In "Both" display mode, the VTR shows both the numerical score (0-100) alongside the appropriate circle symbol.
Enhanced VTR Settings
The Enhanced Volume Trend component offers several advanced customization options:
Adaptive Volume Analysis (volTrendAdaptive):
When enabled, dynamically adjusts volume thresholds based on recent market volatility
Higher volatility periods require proportionally higher volume to generate significant signals
Helps prevent false signals during highly volatile markets
Keep enabled for most trading conditions, especially in volatile markets
Speed of Change Weight (volTrendSpeedWeight, range 0-1):
Controls emphasis on volume acceleration/deceleration rather than absolute levels
Higher values (0.7-1.0): More responsive to new volume trends, better for momentum trading
Lower values (0.2-0.5): Less responsive, better for trend following
Helps identify early volume trends before they fully develop
Momentum Period (volTrendMomentumPeriod, range 2-10):
Defines lookback period for volume change rate calculations
Lower values (2-3): More responsive to recent changes, better for short timeframes
Higher values (7-10): Smoother, better for daily/weekly charts
Directly affects how quickly the indicator responds to new volume patterns
Volatility Filter (volTrendVolatilityFilter):
Adjusts significance of volume by factoring in current price volatility
High volume during high volatility receives less weight
High volume during low volatility receives more weight
Helps distinguish between genuine volume-driven moves and volatility-driven moves
EMA Alignment Weight (volTrendEmaWeight, range 0-1):
Controls importance of EMA alignments in final VTR calculation
Analyzes multiple EMA relationships (5, 10, 21 period)
Higher values (0.7-1.0): Greater emphasis on trend structure
Lower values (0.2-0.5): More focus on pure volume patterns
Display Mode (volTrendDisplayMode):
"Value": Shows only numerical score (0-100)
"Strength": Shows only symbolic representation
"Both": Shows numerical score and symbol together
3. Bollinger Band Squeeze Detection (SQZ)
The BB Squeeze indicator identifies periods of low volatility when Bollinger Bands contract inside Keltner Channels, often preceding significant price movements.
SQZ Visual Indicators
"●" (Filled Circle): Strong squeeze - high probability setup for an impending breakout
Green: Strong squeeze with bullish bias (likely upward breakout)
Red: Strong squeeze with bearish bias (likely downward breakout)
Orange: Strong squeeze with unclear direction
"◯" (Hollow Circle): Moderate squeeze - medium probability setup
Green: With bullish EMA alignment
Red: With bearish EMA alignment
Orange: Without clear directional bias
"-" (Dash): Gray dash indicates no squeeze condition (normal volatility)
The script identifies squeeze conditions through multiple methods:
Bollinger Bands contracting inside Keltner Channels
BB width falling to bottom 20% of recent range (BB width percentile)
Very narrow Keltner Channel (less than 5% of basis price)
Tracking squeeze duration in consecutive bars
Different squeeze strengths are detected:
Strong Squeeze: BB inside KC with tight BB width and narrow KC
Moderate Squeeze: BB inside KC with either tight BB width or narrow KC
No Squeeze: Normal market conditions
4. Breakout Detection System
The script includes two breakout indicators working in sequence:
4.1 Pre-Breakout (PBK) Indicator
Detects potential upcoming breakouts by analyzing multiple factors:
Squeeze conditions lasting 2-3 bars or more
Significant price ranges
Strong volume confirmation
EMA/MACD crossovers
Consistent price direction
PBK Visual Indicators
"●" (Filled Circle): Detected pre-breakout condition
Green: Likely upward breakout (bullish)
Red: Likely downward breakout (bearish)
Orange: Direction not yet clear, but breakout likely
"-" (Dash): Gray dash indicates no pre-breakout condition
The PBK uses sophisticated conditions to reduce false signals including minimum squeeze length, significant price movement, and technical confirmations.
4.2 Breakout (BK) Indicator
Confirms actual breakouts in progress by identifying:
End of squeeze or strong expansion of Bollinger Bands
Volume expansion
Price moving outside Bollinger Bands
EMA crossovers with volume confirmation
MACD crossovers with significant price range
BK Visual Indicators
"●" (Filled Circle): Confirmed breakout in progress
Green: Upward breakout (bullish)
Red: Downward breakout (bearish)
Orange: Unusual breakout pattern without clear direction
"◆" (Diamond): Special breakout conditions (meets some but not all criteria)
"-" (Dash): Gray dash indicates no breakout detected
The BK indicator uses advanced filters for confirmation:
Requires consecutive breakout signals to reduce false positives
Strong volume confirmation requirements (40% above average)
Significant price movement thresholds
Consistency checks between price action and indicators
5. Market Metrics and Analysis
Price Change Percentage (CHG%)
Displays the current percentage change relative to the previous day's close, color-coded green for positive changes and red for negative changes.
Average Daily Range (ADR%)
Calculates the average daily percentage range over a specified period (default 20 days), helping traders gauge volatility and set appropriate price targets.
Average True Range (ATR)
Shows the Average True Range value, a volatility indicator developed by J. Welles Wilder that measures market volatility by decomposing the entire range of an asset price for that period.
Relative Strength Index (RSI)
Displays the standard 14-period RSI, a momentum oscillator that measures the speed and change of price movements on a scale from 0 to 100.
6. External Market Indicators
QQQ Change
Shows the percentage change in the Invesco QQQ Trust (tracking the Nasdaq-100 Index), useful for understanding broader tech market trends.
UVIX Change
Displays the percentage change in UVIX, a volatility index, providing insight into market fear and potential hedging activity.
BTC-USD
Shows the current Bitcoin price from Coinbase, useful for traders monitoring crypto correlation with equities.
Market Breadth (BRD)
Calculates the percentage difference between ATHI.US and ATLO.US (high vs. low securities), indicating overall market direction and strength.
7. Session Analysis and Volume Direction
Session Detection
The script accurately identifies different market sessions:
Pre-market: 4:00 AM to 9:30 AM
Regular market: 9:30 AM to 4:00 PM
After-hours: 4:00 PM to 8:00 PM
Closed: Outside trading hours
This detection works on any timeframe through careful calculation of current time in seconds.
Buy/Sell Volume Direction
The script analyzes buying and selling pressure by:
Counting up volume when close > open
Counting down volume when close < open
Tracking accumulated volume within the day
Calculating intraday pressure (up volume minus down volume)
Enhanced AVOL Calculation
The improved AVOL calculation works in all timeframes by:
Estimating typical pre-market and after-hours volume percentages
Combining yesterday's after-hours with today's pre-market volume
Calculating this as a percentage of the 21-day average volume
Determining buying/selling pressure by analyzing after-hours and pre-market price changes
Color-coding results: green for buying pressure, red for selling pressure
This calculation is particularly valuable because it works consistently across any timeframe.
Customization Options
Display Settings
The dashboard has two customizable tables: Volume Table and Metrics Table, with positions selectable as bottom_left or bottom_right.
All metrics can be individually toggled on/off:
Pre-market data (PVOL, P$VOL, PRVOL, PCHG%)
Volume data (AVOL, RVOL Day, RVOL 90D, Volume, SEED_YASHALGO_NSE_BREADTH:VOLUME )
Price metrics (ADR%, ATR, RSI, Price Change%)
Market indicators (QQQ, UVIX, Breadth, BTC-USD)
Analysis indicators (Volume Trend, BB Squeeze, Pre-Breakout, Breakout)
These toggle options allow traders to customize the dashboard to show only the metrics they find most valuable for their trading style.
Table and Text Customization
The dashboard's appearance can be customized:
Table background color via tableBgColor
Text color (White or Black) via textColorOption
The indicator uses smart formatting for volume and price values, automatically adding appropriate suffixes (K, M, B) for readability.
MACD Configuration for VTR
The Volume Trend calculation incorporates MACD with customizable parameters:
Fast Length: Controls the period for the fast EMA (default 3)
Slow Length: Controls the period for the slow EMA (default 9)
Signal Length: Controls the period for the signal line EMA (default 5)
MACD Weight: Controls how much influence MACD has on the volume trend score (default 0.3)
These settings allow traders to fine-tune how momentum is factored into the volume trend analysis.
Bollinger Bands and Keltner Channel Settings
The Bollinger Bands and Keltner Channels used for squeeze detection have preset (hidden) parameters:
BB Length: 20 periods
BB Multiplier: 2.0 standard deviations
Keltner Length: 20 periods
Keltner Multiplier: 1.5 ATR
These settings follow standard practice for squeeze detection while maintaining simplicity in the user interface.
Practical Trading Applications
Complete Trading Strategies
1. Squeeze Breakout Strategy
This strategy combines multiple components of the indicator:
Wait for a strong squeeze (SQZ showing ●)
Look for pre-breakout confirmation (PBK showing ● in green or red)
Enter when breakout is confirmed (BK showing ● in same direction)
Use VTR to confirm volume supports the move (VTR ≥ 65 for bullish or ≤ 35 for bearish)
Set profit targets based on ADR (Average Daily Range)
Exit when VTR begins to weaken or changes direction
2. Volume Divergence Strategy
This strategy focuses on the volume trend relative to price:
Identify when price makes a new high but VTR fails to confirm (divergence)
Look for VTR to show weakening trend (● changing to ◯ or ·)
Prepare for potential reversal when SQZ begins to form
Enter counter-trend position when PBK confirms reversal direction
Use external indicators (QQQ, BTC, Breadth) to confirm broader market support
3. Pre-Market Edge Strategy
This strategy leverages pre-market data:
Monitor AVOL for unusual pre-market activity (significantly above 100%)
Check pre-market price change direction (PCHG%)
Enter position at market open if VTR confirms direction
Use SQZ to determine if volatility is likely to expand
Exit based on RVOL declining or price reaching +/- ADR for the day
Market Context Integration
The indicator provides valuable context for trading decisions:
QQQ change shows tech market direction
BTC price shows crypto market correlation
UVIX change indicates volatility expectations
Breadth measurement shows market internals
This context helps traders avoid fighting the broader market and align trades with overall market direction.
Timeframe Optimization
The indicator is designed to work across different timeframes:
For day trading: Focus on AVOL, VTR, PBK/BK, and use shorter momentum periods
For swing trading: Focus on SQZ duration, VTR strength, and broader market indicators
For position trading: Focus on larger VTR trends and use EMA alignment weight
Advanced Analytical Components
Enhanced Volume Trend Score Calculation
The VTR score calculation is sophisticated, with the base score starting at 50 and adjusting for:
Price direction (up/down)
Volume relative to average (high/normal/low)
Volume acceleration/deceleration
Market conditions (bull/bear)
Additional factors are then applied, including:
MACD influence weighted by strength and direction
Volume change rate influence (speed)
Price/volume divergence effects
EMA alignment scores
Volatility adjustments
Breakout strength factors
Price action confirmations
The final score is clamped between 0-100, with values above 50 indicating bullish conditions and below 50 indicating bearish conditions.
Anti-False Signal Filters
The indicator employs multiple techniques to reduce false signals:
Requiring significant price range (minimum percentage movement)
Demanding strong volume confirmation (significantly above average)
Checking for consistent direction across multiple indicators
Requiring prior bar consistency (consecutive bars moving in same direction)
Counting consecutive signals to filter out noise
These filters help eliminate noise and focus on high-probability setups.
MACD Enhancement and Integration
The indicator enhances standard MACD analysis:
Calculating MACD relative strength compared to recent history
Normalizing MACD slope relative to volatility
Detecting MACD acceleration for stronger signals
Integrating MACD crossovers with other confirmation factors
EMA Analysis System
The indicator uses a comprehensive EMA analysis system:
Calculating multiple EMAs (5, 10, 21 periods)
Detecting golden cross (10 EMA crosses above 21 EMA)
Detecting death cross (10 EMA crosses below 21 EMA)
Assessing price position relative to EMAs
Measuring EMA separation percentage
Recent Enhancements and Evolution
Version 5.2 includes several improvements:
Enhanced AVOL to show buying/selling direction through color coding
Improved VTR with adaptive analysis based on market conditions
AVOL display now works in all timeframes through sophisticated estimation
Removed animal symbols and streamlined code with bright colors for better visibility
Improved anti-false signal filters throughout the system
Optimizing Indicator Settings
For Different Market Types
Range-Bound Markets:
Lower EMA Alignment Weight (0.2-0.4)
Higher Speed of Change Weight (0.8-1.0)
Focus on SQZ and PBK signals for breakout potential
Trending Markets:
Higher EMA Alignment Weight (0.7-1.0)
Moderate Speed of Change Weight (0.4-0.6)
Focus on VTR strength and BK confirmations
Volatile Markets:
Enable Volatility Filter
Enable Adaptive Volume Analysis
Lower Momentum Period (2-3)
Focus on strong volume confirmation (VTR ≥ 80 or ≤ 20)
For Different Asset Classes
Equities:
Standard settings work well
Pay attention to AVOL for gap potential
Monitor QQQ correlation
Futures:
Consider higher Volume/RVOL weight
Reduce MACD weight slightly
Pay close attention to SQZ duration
Crypto:
Higher volatility thresholds may be needed
Monitor BTC price for correlation
Focus on stronger confirmation signals
Integrated Visual System for Trading Decisions
The colored circle indicators create an intuitive visual system for quick market assessment:
Progression Sequence: SQZ (Squeeze) → PBK (Pre-Breakout) → BK (Breakout)
This sequence often occurs in order, with the squeeze leading to pre-breakout conditions, followed by an actual breakout.
VTR (Volume Trend): Provides context about the volume supporting these movements.
Color Coding: Green for bullish conditions, red for bearish conditions, and orange/gray for neutral or undefined conditions.

Central Bank Assets YoY % with StdDev BandsCentral Bank Assets YoY % with StdDev Bands - Indicator Documentation
Overview
This indicator tracks the year-over-year (YoY) percentage change in combined central bank assets using a custom formula. It displays the annual growth rate along with statistical bands showing when the growth is significantly above or below historical norms.
Formula Components
The indicator is based on a custom symbol combining multiple central bank balance sheets:
Federal Reserve balance sheet (FRED)
Bank of Japan assets converted to USD (FX_IDC*FRED)
European Central Bank assets converted to USD (FX_IDC*FRED)
Subtracting Fed reverse repo operations (FRED)
Subtracting Treasury General Account (FRED)
Calculations
Year-over-Year Percentage Change: Calculates the percentage change between the current value and the value from exactly one year ago (252 trading days).
Formula: ((current - year_ago) / year_ago) * 100
Statistical Measures:
Mean (Average): The 252-day simple moving average of the YoY percentage changes
Standard Deviation: The 252-day standard deviation of YoY percentage changes
Display Components
The indicator displays:
Main Line: YoY percentage change (green when positive, red when negative)
Zero Line: Reference line at 0% (gray dashed)
Mean Line: Average YoY change over the past 252 days (blue)
Standard Deviation Bands: Shows +/- 1 standard deviation from the mean
Upper band (+1 StdDev): Green, line with breaks style
Lower band (-1 StdDev): Red, line with breaks style
Interpretation
Values above zero indicate YoY growth in central bank assets
Values below zero indicate YoY contraction
Values above the +1 StdDev line indicate unusually strong growth
Values below the -1 StdDev line indicate unusually severe contraction
Crossing above/below the mean line can signal shifts in central bank policy trends
Usage
This indicator is useful for:
Monitoring global central bank liquidity trends
Identifying unusual periods of balance sheet expansion/contraction
Analyzing correlations between central bank activity and market performance
Anticipating potential market impacts from changes in central bank policy
The 252-day lookback period (approximately one trading year) provides a balance between statistical stability and responsiveness to changing trends in central bank behavior.

Air Gap MTF with alert settingsWhat it shows:
This indicator will show a horizontal line at a price where each EMAs are on on different time frames, which will remove the effort of having to flick through different time frames or look at different chart.
The lines itself will move in real time as price moves and therefore as the EMA values changes so no need to manually adjustment the lines.
How to use it:
The price gap between each of the lines are known as "air gaps", which are essentially zones price can move with less resistance. Therefore bigger the airgap there is more likely more movement in price.
In other words, where lines are can be a resistance (or support) and can expect price stagnation or rejection.
On the chart it is clear to see lines are acting as resistances/supports.
Key settings:
The time frame are fixed to: 30min, 1hr and 4hr. This cannot be changed as of now.
EMA values for each time frame are user changeable in the settings, and up to 4 different values can be chosen for each time frame. Default is 5,12,34 and 50 for each timeframe.
Line colour, thickness and style can be user adjusted. Start point for where line will be drawn can be changed in the settings, either: start of day, user defined start or across the chart. In case of user defined scenario user can input a number that specifies a offset from current candle.
Label colour, font, alignment, text size and text itself can be user adjusted in the settings. Price can be also displayed if user chooses to do so. Position of label (offset from current candle) is user specified and can be adjusted by the user.
Both the lines and labels can be turned off (both and individually), for each lines.
Alert Settings:
Manually, user can set alerts for when price crosses a specific line.
This can be done by:
right click on any of line
choose first option (add alert on...)
On the second option under condition, use the dropdown menu to choose the desired EMA/timeframe to set alert for.
Hit "create" at bottom right of option
----------------------------------------------------------------------
If anything is not clear please let me know!

AI Adaptive Oscillator [PhenLabs]📊 Algorithmic Adaptive Oscillator
Version: PineScript™ v6
📌 Description
The AI Adaptive Oscillator is a sophisticated technical indicator that employs ensemble learning and adaptive weighting techniques to analyze market conditions. This innovative oscillator combines multiple traditional technical indicators through an AI-driven approach that continuously evaluates and adjusts component weights based on historical performance. By integrating statistical modeling with machine learning principles, the indicator adapts to changing market dynamics, providing traders with a responsive and reliable tool for market analysis.
🚀 Points of Innovation:
Ensemble learning framework with adaptive component weighting
Performance-based scoring system using directional accuracy
Dynamic volatility-adjusted smoothing mechanism
Intelligent signal filtering with cooldown and magnitude requirements
Signal confidence levels based on multi-factor analysis
🔧 Core Components
Ensemble Framework : Combines up to five technical indicators with performance-weighted integration
Adaptive Weighting : Continuous performance evaluation with automated weight adjustment
Volatility-Based Smoothing : Adapts sensitivity based on current market volatility
Pattern Recognition : Identifies potential reversal patterns with signal qualification criteria
Dynamic Visualization : Professional color schemes with gradient intensity representation
Signal Confidence : Three-tiered confidence assessment for trading signals
🔥 Key Features
The indicator provides comprehensive market analysis through:
Multi-Component Ensemble : Integrates RSI, CCI, Stochastic, MACD, and Volume-weighted momentum
Performance Scoring : Evaluates each component based on directional prediction accuracy
Adaptive Smoothing : Automatically adjusts based on market volatility
Pattern Detection : Identifies potential reversal patterns in overbought/oversold conditions
Signal Filtering : Prevents excessive signals through cooldown periods and minimum change requirements
Confidence Assessment : Displays signal strength through intuitive confidence indicators (average, above average, excellent)
🎨 Visualization
Gradient-Filled Oscillator : Color intensity reflects strength of market movement
Clear Signal Markers : Distinct bullish and bearish pattern signals with confidence indicators
Range Visualization : Clean representation of oscillator values from -6 to 6
Zero Line : Clear demarcation between bullish and bearish territory
Customizable Colors : Color schemes that can be adjusted to match your chart style
Confidence Symbols : Intuitive display of signal confidence (no symbol, +, or ++) alongside direction markers
📖 Usage Guidelines
⚙️ Settings Guide
Color Settings
Bullish Color
Default: #2b62fa (Blue)
This setting controls the color representation for bullish movements in the oscillator. The color appears when the oscillator value is positive (above zero), with intensity indicating the strength of the bullish momentum. A brighter shade indicates stronger bullish pressure.
Bearish Color
Default: #ce9851 (Amber)
This setting determines the color representation for bearish movements in the oscillator. The color appears when the oscillator value is negative (below zero), with intensity reflecting the strength of the bearish momentum. A more saturated shade indicates stronger bearish pressure.
Signal Settings
Signal Cooldown (bars)
Default: 10
Range: 1-50
This parameter sets the minimum number of bars that must pass before a new signal of the same type can be generated. Higher values reduce signal frequency and help prevent overtrading during choppy market conditions. Lower values increase signal sensitivity but may generate more false positives.
Min Change For New Signal
Default: 1.5
Range: 0.5-3.0
This setting defines the minimum required change in oscillator value between consecutive signals of the same type. It ensures that new signals represent meaningful changes in market conditions rather than minor fluctuations. Higher values produce fewer but potentially higher-quality signals, while lower values increase signal frequency.
AI Core Settings
Base Length
Default: 14
Minimum: 2
This fundamental setting determines the primary calculation period for all technical components in the ensemble (RSI, CCI, Stochastic, etc.). It represents the lookback window for each component’s base calculation. Shorter periods create a more responsive but potentially noisier oscillator, while longer periods produce smoother signals with potential lag.
Adaptive Speed
Default: 0.1
Range: 0.01-0.3
Controls how quickly the oscillator adapts to new market conditions through its volatility-adjusted smoothing mechanism. Higher values make the oscillator more responsive to recent price action but potentially more erratic. Lower values create smoother transitions but may lag during rapid market changes. This parameter directly influences the indicator’s adaptiveness to market volatility.
Learning Lookback Period
Default: 150
Minimum: 10
Determines the historical data range used to evaluate each ensemble component’s performance and calculate adaptive weights. This setting controls how far back the AI “learns” from past performance to optimize current signals. Longer periods provide more stable weight distribution but may be slower to adapt to regime changes. Shorter periods adapt more quickly but may overreact to recent anomalies.
Ensemble Size
Default: 5
Range: 2-5
Specifies how many technical components to include in the ensemble calculation.
Understanding The Interaction Between Settings
Base Length and Learning Lookback : The base length determines the reactivity of individual components, while the lookback period determines how their weights are adjusted. These should be balanced according to your timeframe - shorter timeframes benefit from shorter base lengths, while the lookback should generally be 10-15 times the base length for optimal learning.
Adaptive Speed and Signal Cooldown : These settings control sensitivity from different angles. Increasing adaptive speed makes the oscillator more responsive, while reducing signal cooldown increases signal frequency. For conservative trading, keep adaptive speed low and cooldown high; for aggressive trading, do the opposite.
Ensemble Size and Min Change : Larger ensembles provide more stable signals, allowing for a lower minimum change threshold. Smaller ensembles might benefit from a higher threshold to filter out noise.
Understanding Signal Confidence Levels
The indicator provides three distinct confidence levels for both bullish and bearish signals:
Average Confidence (▲ or ▼) : Basic signal that meets the minimum pattern and filtering criteria. These signals indicate potential reversals but with moderate confidence in the prediction. Consider using these as initial alerts that may require additional confirmation.
Above Average Confidence (▲+ or ▼+) : Higher reliability signal with stronger underlying metrics. These signals demonstrate greater consensus among the ensemble components and/or stronger historical performance. They offer increased probability of successful reversals and can be traded with less additional confirmation.
Excellent Confidence (▲++ or ▼++) : Highest quality signals with exceptional underlying metrics. These signals show strong agreement across oscillator components, excellent historical performance, and optimal signal strength. These represent the indicator’s highest conviction trade opportunities and can be prioritized in your trading decisions.
Confidence assessment is calculated through a multi-factor analysis including:
Historical performance of ensemble components
Degree of agreement between different oscillator components
Relative strength of the signal compared to historical thresholds
✅ Best Use Cases:
Identify potential market reversals through oscillator extremes
Filter trade signals based on AI-evaluated component weights
Monitor changing market conditions through oscillator direction and intensity
Confirm trade signals from other indicators with adaptive ensemble validation
Detect early momentum shifts through pattern recognition
Prioritize trading opportunities based on signal confidence levels
Adjust position sizing according to signal confidence (larger for ++ signals, smaller for standard signals)
⚠️ Limitations
Requires sufficient historical data for accurate performance scoring
Ensemble weights may lag during dramatic market condition changes
Higher ensemble sizes require more computational resources
Performance evaluation quality depends on the learning lookback period length
Even high confidence signals should be considered within broader market context
💡 What Makes This Unique
Adaptive Intelligence : Continuously adjusts component weights based on actual performance
Ensemble Methodology : Combines strength of multiple indicators while minimizing individual weaknesses
Volatility-Adjusted Smoothing : Provides appropriate sensitivity across different market conditions
Performance-Based Learning : Utilizes historical accuracy to improve future predictions
Intelligent Signal Filtering : Reduces noise and false signals through sophisticated filtering criteria
Multi-Level Confidence Assessment : Delivers nuanced signal quality information for optimized trading decisions
🔬 How It Works
The indicator processes market data through five main components:
Ensemble Component Calculation :
Normalizes traditional indicators to consistent scale
Includes RSI, CCI, Stochastic, MACD, and volume components
Adapts based on the selected ensemble size
Performance Evaluation :
Analyzes directional accuracy of each component
Calculates continuous performance scores
Determines adaptive component weights
Oscillator Integration :
Combines weighted components into unified oscillator
Applies volatility-based adaptive smoothing
Scales final values to -6 to 6 range
Signal Generation :
Detects potential reversal patterns
Applies cooldown and magnitude filters
Generates clear visual markers for qualified signals
Confidence Assessment :
Evaluates component agreement, historical accuracy, and signal strength
Classifies signals into three confidence tiers (average, above average, excellent)
Displays intuitive confidence indicators (no symbol, +, ++) alongside direction markers
💡 Note:
The AI Adaptive Oscillator performs optimally when used with appropriate timeframe selection and complementary indicators. Its adaptive nature makes it particularly valuable during changing market conditions, where traditional fixed-weight indicators often lose effectiveness. The ensemble approach provides a more robust analysis by leveraging the collective intelligence of multiple technical methodologies. Pay special attention to the signal confidence indicators to optimize your trading decisions - excellent (++) signals often represent the most reliable trade opportunities.

Neon Momentum Waves StrategyIntroduction
The Neon Momentum Waves Strategy is a momentum-based indicator designed to help traders visualize potential shifts in market direction. It builds upon a MACD-style calculation while incorporating an enhanced visual representation of momentum waves. This approach may assist traders in identifying areas of increasing or decreasing momentum, potentially aligning with market trends or reversals.
How It Works
This strategy is based on a modified MACD (Moving Average Convergence Divergence) method, calculating the difference between two Exponential Moving Averages (EMAs). The momentum wave represents this difference, while an additional smoothing line (signal line) helps highlight potential momentum shifts.
Key Components:
Momentum Calculation:
Uses a fast EMA (12-period) and a slow EMA (26-period) to measure short-term and long-term momentum.
A signal line (20-period EMA of the MACD difference) smooths fluctuations.
The histogram (momentum wave) represents the divergence between the MACD value and the signal line.
Interpreting Momentum Changes:
Momentum Increasing: When the histogram rises above the zero line, it may indicate strengthening upward movement.
Momentum Decreasing: When the histogram moves below the zero line, it may signal a weakening trend or downward momentum.
Potential Exhaustion Points: Users can define custom threshold levels (default: ±10) to highlight when momentum is significantly strong or weak.
Visual Enhancements:
The neon glow effect is created by layering multiple plots with decreasing opacity, enhancing the clarity of momentum shifts.
Aqua-colored waves highlight upward momentum, while purple waves represent downward momentum.
Horizontal reference lines mark the zero line and user-defined thresholds to improve interpretability.
How It Differs from Traditional Indicators
Improved Visualization: Unlike standard MACD histograms, this approach provides clearer visual cues using a neon-style wave format.
Customizable Thresholds: Rather than relying solely on MACD crossovers, users can adjust sensitivity settings to better suit their trading style.
Momentum-Based Approach: The strategy is focused on visualizing shifts in momentum strength, rather than predicting price movements.
Potential Use Cases
Momentum Trend Awareness: Helps traders identify periods where momentum appears to be strengthening or fading.
Market Structure Analysis: May complement other indicators to assess whether price action aligns with momentum changes.
Flexible Timeframe Application: Can be used across different timeframes, depending on the trader’s strategy.
Important Considerations
This strategy is purely momentum-based and does not incorporate volume, fundamental factors, or price action confirmation.
Momentum shifts do not guarantee price direction changes—they should be considered alongside broader market context.
The strategy may perform differently in trending vs. ranging markets, so adjustments in sensitivity may be needed.
Risk management is essential—traders should apply proper stop-losses and position sizing techniques in line with their risk tolerance.
Conclusion
The Neon Momentum Waves Strategy provides a visually enhanced method of tracking momentum, allowing traders to observe potential changes in market strength. While not a predictive tool, it serves as a complementary indicator that may help traders in momentum-based decision-making. As with any technical tool, it should be used as part of a broader strategy that considers multiple factors in market analysis.

AO/AC Trading Zones Strategy [Skyrexio] Overview
AO/AC Trading Zones Strategy leverages the combination of Awesome Oscillator (AO), Acceleration/Deceleration Indicator (AC), Williams Fractals, Williams Alligator and Exponential Moving Average (EMA) to obtain the high probability long setups. Moreover, strategy uses multi trades system, adding funds to long position if it considered that current trend has likely became stronger. Combination of AO and AC is used for creating so-called trading zones to create the signals, while Alligator and Fractal are used in conjunction as an approximation of short-term trend to filter them. At the same time EMA (default EMA's period = 100) is used as high probability long-term trend filter to open long trades only if it considers current price action as an uptrend. More information in "Methodology" and "Justification of Methodology" paragraphs. The strategy opens only long trades.
Unique Features
No fixed stop-loss and take profit: Instead of fixed stop-loss level strategy utilizes technical condition obtained by Fractals and Alligator to identify when current uptrend is likely to be over. In some special cases strategy uses AO and AC combination to trail profit (more information in "Methodology" and "Justification of Methodology" paragraphs)
Configurable Trading Periods: Users can tailor the strategy to specific market windows, adapting to different market conditions.
Multilayer trades opening system: strategy uses only 10% of capital in every trade and open up to 5 trades at the same time if script consider current trend as strong one.
Short and long term trend trade filters: strategy uses EMA as high probability long-term trend filter and Alligator and Fractal combination as a short-term one.
Methodology
The strategy opens long trade when the following price met the conditions:
1. Price closed above EMA (by default, period = 100). Crossover is not obligatory.
2. Combination of Alligator and Williams Fractals shall consider current trend as an upward (all details in "Justification of Methodology" paragraph)
3. Both AC and AO shall print two consecutive increasing values. At the price candle close which corresponds to this condition algorithm opens the first long trade with 10% of capital.
4. If combination of Alligator and Williams Fractals shall consider current trend has been changed from up to downtrend, all long trades will be closed, no matter how many trades has been opened.
5. If AO and AC both continue printing the rising values strategy opens the long trade on each candle close with 10% of capital while number of opened trades reaches 5.
6. If AO and AC both has printed 5 rising values in a row algorithm close all trades if candle's low below the low of the 5-th candle with rising AO and AC values in a row.
Script also has additional visuals. If second long trade has been opened simultaneously the Alligator's teeth line is plotted with the green color. Also for every trade in a row from 2 to 5 the label "Buy More" is also plotted just below the teeth line. With every next simultaneously opened trade the green color of the space between teeth and price became less transparent.
Strategy settings
In the inputs window user can setup strategy setting:
EMA Length (by default = 100, period of EMA, used for long-term trend filtering EMA calculation).
User can choose the optimal parameters during backtesting on certain price chart.
Justification of Methodology
Let's explore the key concepts of this strategy and understand how they work together. We'll begin with the simplest: the EMA.
The Exponential Moving Average (EMA) is a type of moving average that assigns greater weight to recent price data, making it more responsive to current market changes compared to the Simple Moving Average (SMA). This tool is widely used in technical analysis to identify trends and generate buy or sell signals. The EMA is calculated as follows:
1.Calculate the Smoothing Multiplier:
Multiplier = 2 / (n + 1), Where n is the number of periods.
2. EMA Calculation
EMA = (Current Price) × Multiplier + (Previous EMA) × (1 − Multiplier)
In this strategy, the EMA acts as a long-term trend filter. For instance, long trades are considered only when the price closes above the EMA (default: 100-period). This increases the likelihood of entering trades aligned with the prevailing trend.
Next, let’s discuss the short-term trend filter, which combines the Williams Alligator and Williams Fractals. Williams Alligator
Developed by Bill Williams, the Alligator is a technical indicator that identifies trends and potential market reversals. It consists of three smoothed moving averages:
Jaw (Blue Line): The slowest of the three, based on a 13-period smoothed moving average shifted 8 bars ahead.
Teeth (Red Line): The medium-speed line, derived from an 8-period smoothed moving average shifted 5 bars forward.
Lips (Green Line): The fastest line, calculated using a 5-period smoothed moving average shifted 3 bars forward.
When the lines diverge and align in order, the "Alligator" is "awake," signaling a strong trend. When the lines overlap or intertwine, the "Alligator" is "asleep," indicating a range-bound or sideways market. This indicator helps traders determine when to enter or avoid trades.
Fractals, another tool by Bill Williams, help identify potential reversal points on a price chart. A fractal forms over at least five consecutive bars, with the middle bar showing either:
Up Fractal: Occurs when the middle bar has a higher high than the two preceding and two following bars, suggesting a potential downward reversal.
Down Fractal: Happens when the middle bar shows a lower low than the surrounding two bars, hinting at a possible upward reversal.
Traders often use fractals alongside other indicators to confirm trends or reversals, enhancing decision-making accuracy.
How do these tools work together in this strategy? Let’s consider an example of an uptrend.
When the price breaks above an up fractal, it signals a potential bullish trend. This occurs because the up fractal represents a shift in market behavior, where a temporary high was formed due to selling pressure. If the price revisits this level and breaks through, it suggests the market sentiment has turned bullish.
The breakout must occur above the Alligator’s teeth line to confirm the trend. A breakout below the teeth is considered invalid, and the downtrend might still persist. Conversely, in a downtrend, the same logic applies with down fractals.
In this strategy if the most recent up fractal breakout occurs above the Alligator's teeth and follows the last down fractal breakout below the teeth, the algorithm identifies an uptrend. Long trades can be opened during this phase if a signal aligns. If the price breaks a down fractal below the teeth line during an uptrend, the strategy assumes the uptrend has ended and closes all open long trades.
By combining the EMA as a long-term trend filter with the Alligator and fractals as short-term filters, this approach increases the likelihood of opening profitable trades while staying aligned with market dynamics.
Now let's talk about the trading zones concept and its signals. To understand this we need to briefly introduce what is AO and AC. The Awesome Oscillator (AO), developed by Bill Williams, is a momentum indicator designed to measure market momentum by contrasting recent price movements with a longer-term historical perspective. It helps traders detect potential trend reversals and assess the strength of ongoing trends.
The formula for AO is as follows:
AO = SMA5(Median Price) − SMA34(Median Price)
where:
Median Price = (High + Low) / 2
SMA5 = 5-period Simple Moving Average of the Median Price
SMA 34 = 34-period Simple Moving Average of the Median Price
The Acceleration/Deceleration (AC) Indicator, introduced by Bill Williams, measures the rate of change in market momentum. It highlights shifts in the driving force of price movements and helps traders spot early signs of trend changes. The AC Indicator is particularly useful for identifying whether the current momentum is accelerating or decelerating, which can indicate potential reversals or continuations. For AC calculation we shall use the AO calculated above is the following formula:
AC = AO − SMA5(AO) , where SMA5(AO)is the 5-period Simple Moving Average of the Awesome Oscillator
When the AC is above the zero line and rising, it suggests accelerating upward momentum.
When the AC is below the zero line and falling, it indicates accelerating downward momentum.
When the AC is below zero line and rising it suggests the decelerating the downtrend momentum. When AC is above the zero line and falling, it suggests the decelerating the uptrend momentum.
Now let's discuss the trading zones concept and how it can create the signal. Zones are created by the combination of AO and AC. We can divide three zone types:
Greed zone: when the AO and AC both are rising
Red zone: when the AO and AC both are decreasing
Gray zone: when one of AO or AC is rising, the other is falling
Gray zone is considered as uncertainty. AC and AO are moving in the opposite direction. Strategy skip such price action to decrease the chance to stuck in the losing trade during potential sideways. Red zone is also not interesting for the algorithm because both indicators consider the trend as bearish, but strategy opens only long trades. It is waiting for the green zone to increase the chance to open trade in the direction of the potential uptrend. When we have 2 candles in a row in the green zone script executes a long trade with 10% of capital.
Two green zone candles in a row is considered by algorithm as a bullish trend, but now so strong, that's the reason why trade is going to be closed when the combination of Alligator and Fractals will consider the the trend change from bullish to bearish. If id did not happens, algorithm starts to count the green zone candles in a row. When we have 5 in a row script change the trade closing condition. Such situation is considered is a high probability strong bull market and all trades will be closed if candle's low will be lower than fifth green zone candle's low. This is used to increase probability to secure the profit. If long trades are initiated, the strategy continues utilizing subsequent signals until the total number of trades reaches a maximum of 5. Each trade uses 10% of capital.
Why we use trading zones signals? If currently strategy algorithm considers the high probability of the short-term uptrend with the Alligator and Fractals combination pointed out above and the long-term trend is also suggested by the EMA filter as bullish. Rising AC and AO values in the direction of the most likely main trend signaling that we have the high probability of the fastest bullish phase on the market. The main idea is to take part in such rapid moves and add trades if this move continues its acceleration according to indicators.
Backtest Results
Operating window: Date range of backtests is 2023.01.01 - 2024.12.31. It is chosen to let the strategy to close all opened positions.
Commission and Slippage: Includes a standard Binance commission of 0.1% and accounts for possible slippage over 5 ticks.
Initial capital: 10000 USDT
Percent of capital used in every trade: 10%
Maximum Single Position Loss: -9.49%
Maximum Single Profit: +24.33%
Net Profit: +4374.70 USDT (+43.75%)
Total Trades: 278 (39.57% win rate)
Profit Factor: 2.203
Maximum Accumulated Loss: 668.16 USDT (-5.43%)
Average Profit per Trade: 15.74 USDT (+1.37%)
Average Trade Duration: 60 hours
How to Use
Add the script to favorites for easy access.
Apply to the desired timeframe and chart (optimal performance observed on 4h BTC/USDT).
Configure settings using the dropdown choice list in the built-in menu.
Set up alerts to automate strategy positions through web hook with the text: {{strategy.order.alert_message}}
Disclaimer:
Educational and informational tool reflecting Skyrex commitment to informed trading. Past performance does not guarantee future results. Test strategies in a simulated environment before live implementation
These results are obtained with realistic parameters representing trading conditions observed at major exchanges such as Binance and with realistic trading portfolio usage parameters.

Kalman Filter Trend BreakersThe Kalman filter is a recursive algorithm developed in 1960 by Rudolf E. Kálmán, a Hungarian-American engineer and mathematician, that provides optimal estimates of a system's state by combining noisy measurements with a predictive model. It is widely used in control systems, signal processing, and finance for tracking and forecasting.
In trading, KF might be a good replacement for a moving average, as it reacts to price changes in a different way. Not only it follows price direction, but can also track the velocity of price change. This specific behaviour of KF is used in this indicator to track changes in trends.
Trend is characterized by price moving directionally, however, any trend comes to pause or complete stop and reversal, as the price changes more slowly (a trend fades into a sideways movement for a while) or the price movement changes direction, thus making a reversal.
This indicator detects the points where such changes occur (trend breaker points), and produces signals, which serve as points of current trend pausing or reversing. By applying different settings for KF calculation, you can produce less or more signals that indicate change in trend character, and either detect only significant trends changes, or less and shorter trends changes as well.
The signals do not differentiate the exact type of a trend change (it can be a brief trend pause followed by a continuation, as well as a complete reversal). However, once you are in a trend, the significant velocity change indicates a change in trend structure. In this sense, trend breaker signals should not be followed blindly, and can be used only as trend (and subsequently, position) exit confirmations, but not the entry contrarian confirmations.
For better visual representation, you can use chart signals attached to bars, and additionally paint a vertical gradient at each signal which shows significant trend deceleration.
Kalman filter calculations used in this indicator are partially based on an open-source code from @loxx which was published in 2022 as Kalman filter overlay .

Nasan Hull-smoothed envelope The Nasan Hull-Smoothed Envelope indicator is a sophisticated overlay designed to track price movement within an adaptive "envelope." It dynamically adjusts to market volatility and trend strength, using a series of smoothing and volatility-correction techniques. Here's a detailed breakdown of its components, from the input settings to the calculated visual elements:
Inputs
look_back_length (500):
Defines the lookback period for calculating intraday volatility (IDV), smoothing it over time. A higher value means the indicator considers a longer historical range for volatility calculations.
sl (50):
Sets the smoothing length for the Hull Moving Average (HMA). The HMA smooths various lines, creating a balance between sensitivity and stability in trend signals.
mp (1.5):
Multiplier for IDV, scaling the volatility impact on the envelope. A higher multiplier widens the envelope to accommodate higher volatility, while a lower one tightens it.
p (0.625):
Weight factor that determines the balance between extremes (highest high and lowest low) and averages (sma of high and sma of low) in the high/low calculations. A higher p gives more weight to extremes, making the envelope more responsive to abrupt market changes.
Volatility Calculation (IDV)
The Intraday Volatility (IDV) metric represents the average volatility per bar as an exponentially smoothed ratio of the high-low range to the close price. This is calculated over the look_back_length period, providing a base volatility value which is then scaled by mp. The IDV enables the envelope to dynamically widen or narrow with market volatility, making it sensitive to current market conditions.
Composite High and Low Bands
The high and low bands define the upper and lower bounds of the envelope.
High Calculation
a_high:
Uses a multi-period approach to capture the highest highs over several intervals (5, 8, 13, 21, and 34 bars). Averaging these highs provides a more stable reference for the high end of the envelope, capturing both immediate and recent peak values.
b_high:
Computes the average of shorter simple moving averages (5, 8, and 13 bars) of the high prices, smoothing out fluctuations in the recent highs. This generates a balanced view of high price trends.
high_c:
Combines a_high and b_high using the weight p. This blend creates a composite high that balances between recent peaks and smoothed averages, making the upper envelope boundary adaptive to short-term price shifts.
Low Calculation
a_low and b_low:
Similar to the high calculation, these capture extreme lows and smooth low values over the same intervals. This approach creates a stable and adaptive lower bound for the envelope.
low_c:
Combines a_low and b_low using the weight p, resulting in a composite low that adjusts to price fluctuations while maintaining a stable trend line.
Volatility-Adjusted Bands
The final composite high (c_high) and composite low (c_low) bands are adjusted using IDV, which accounts for intraday volatility. When volatility is high, the bands expand; when it’s low, they contract, providing a visual representation of volatility-adjusted price bounds.
Basis Line
The basis line is a Hull Moving Average (HMA) of the average of c_high and c_low. The HMA is known for its smoothness and responsiveness, making the basis line a central trend indicator. The color of the basis line changes:
Green when the basis line is increasing.
Red when the basis line is decreasing.
This color-coded basis line serves as a quick visual reference for trend direction.
Short-Term Trend Strength Block
This component analyzes recent price action to assess short-term bullish and bearish momentum.
Conditions (green, red, green1, red1):
These are binary conditions that categorize price movements as bullish or bearish based on the close compared to the open and the close’s relationship with the exponential moving average (EMA). This separation helps capture different types of strength (above/below EMA) and different bullish or bearish patterns.
Composite Trend Strength Values:
Each of the bullish and bearish counts (above and below the EMA) is normalized, resulting in the following values:
green_EMAup_a and red_EMAup_a for bullish and bearish strength above the EMA.
green_EMAdown_a and red_EMAdown_a for bullish and bearish strength below the EMA.
Trend Strength (t_s):
This calculated metric combines the normalized trend strengths with extra weight to conditions above the EMA, giving more relevance to trends that have momentum behind them.
Enhanced Trend Strength
avg_movement:
Calculates the average absolute price movement over the short_term_length, providing a measurement of recent price activity that scales with volatility.
enhanced_t_s:
Multiplies t_s by avg_movement, creating an enhanced trend strength value that reflects both directional strength and the magnitude of recent price movement.
min and max:
Minimum and maximum percentile thresholds, respectively, based on enhanced_t_s for controlling the color gradient in the fill area.
Fill Area
The fill area between plot_c_high and plot_c_low is color-coded based on the enhanced trend strength (enhanced_t_s):
Gradient color transitions from blue to green based on the strength level, with blue representing weaker trends and green indicating stronger trends.
This visual fill provides an at-a-glance assessment of trend strength across the envelope, with color shifts highlighting momentum shifts.
Summary
The indicator’s purpose is to offer an adaptive price envelope that reflects real-time market volatility and trend strength. Here’s what each component contributes:
Basis Line: A trend-following line in the center that adjusts color based on trend direction.
Envelope (c_high, c_low): Adapts to volatility by expanding and contracting based on IDV, giving traders a responsive view of expected price bounds.
Fill Area: A color-gradient region representing trend strength within the envelope, helping traders easily identify momentum changes.
Overall, this tool helps to identify trend direction, market volatility, and strength of price movements, allowing for more informed decisions based on visual cues around price boundaries and trend momentum.

Performance Summary and Shading (Offset Version)Modified "Recession and Crisis Shading" Indicator by @haribotagada (Original Link: )
The updated indicator accepts a days offset (positive or negative) to calculate performance between the offset date and the input date.
Potential uses include identifying performance one week after company earnings or an FOMC meeting.
This feature simplifies input by enabling standardized offset dates, while still allowing flexibility to adjust ranges by overriding inputs as needed.
Summary of added features and indicator notes:
Inputs both positive and negative offset.
By default, the script calculates performance from the close of the input date to the close of the date at (input date + offset) for positive offsets, and from the close of (input date - offset) to the close of the input date for negative offsets. For example, with an input date of November 1, 2024, an offset of 7 calculates performance from the close on November 1 to the close on November 8, while an offset of -7 calculates from the close on October 25 to the close on November 1.
Allows user to perform the calculation using the open price on the input date instead of close price
The input format has been modified to allow overrides for the default duration, while retaining the original capabilities of the indicator.
The calculation shows both the average change and the average annualized change. For bar-wise calculations, annualization assumes 252 trading days per year. For date-wise calculations, it assumes 365 days for annualization.
Carries over all previous inputs to retain functionality of the previous script. Changes a few small settings:
Calculates start to end date performance by default instead of peak to trough performance.
Updates visuals of label text to make it easier to read and less transparent.
Changed stat box color scheme to make the text easier to read
Updated default input data to new format of input with offsets
Changed default duration statistic to number of days instead of number of bars with an option to select number of bars.
Potential Features to Add:
Import dataset from CSV files or by plugging into TradingView calendar
Example Input Datasets:
Recessions:
2020-02-01,COVID-19,59
2007-12-01,Subprime mortgages,547
2001-03-01,Dot-com,243
1990-07-01,Oil shock,243
1981-07-01,US unemployment,788
1980-01-01,Volker,182
1973-11-01,OPEC,485
Japan Revolving Door Elections
2006-09-26, Shinzo Abe
2007-09-26, Yasuo Fukuda
2008-09-24, Taro Aso
2009-09-16, Yukio Hatoyama
2010-07-08, Naoto Kan
2011-09-02, Yoshihiko Noda
Hope you find the modified indicator useful and let me know if you would like any features to be added!
NIFTY - Heatmap [DRK]Nifty 50 Heatmap by Percentage Change
This Pine Script generates a dynamic heatmap for the top 40 weighted stocks in the Nifty 50 index, ordered by their percentage change. The heatmap visually represents the performance of these stocks, with green indicating positive changes and red indicating negative changes.
Features :
Real-time Updates : The heatmap updates in real-time, providing an up-to-date snapshot of market performance.
Color Coding : Stocks are color-coded based on their percentage change, making it easy to identify gainers and losers at a glance.
Future Enhancements:
Indicator : Planned updates include popups or descriptions that provide additional insights, such as key indicators and their positive or negative signals.
Detailed Analysis : Future versions will offer more detailed analysis and insights to help traders make informed decisions.
Stay tuned for these exciting updates!

Interest Rate Trading (Manually Added Rate Decisions) [TANHEF]Interest Rate Trading: How Interest Rates Can Guide Your Next Move.
How were interest rate decisions added?
All interest rate decision dates were manually retrieved from the 'Record of Policy Actions' and 'Minutes of Actions' on the Federal Reserve's website due to inconsistent dates from other sources. These were manually added as Pine Script currently only identifies rate changes, not pauses.
█ Simple Explanation:
This script is designed for analyzing and backtesting trading strategies based on U.S. interest rate decisions which occur during Federal Open Market Committee (FOMC) meetings, to make trading decisions. No trading strategy is perfect, and it's important to understand that expectations won't always play out. The script leverages historical interest rate changes, including increases, decreases, and pauses, across multiple economic time periods from 1971 to the present. The tool integrates two key data sources for interest rates—USINTR and FEDFUNDS—to support decision-making around rate-based trades. The focus is on identifying opportunities and tracking trades driven by interest rate movements.
█ Interest Rate Decision Sources:
As noted above, each decision date has been manually added from the 'Record of Policy Actions' and 'Minutes of Actions' documents on the Federal Reserve's website. This includes +50 years of more than 600 rate decisions.
█ Interest Rate Data Sources:
USINTR: Reflects broader U.S. interest rate trends, including Treasury yields and various benchmarks. This is the preferred option as it corresponds well to the rate decision dates.
FEDFUNDS: Tracks the Federal Funds Rate, which is a more specific rate targeted by the Federal Reserve. This does not change on the exact same days as the rate decisions that occur at FOMC meetings.
█ Trade Criteria:
A variety of trading conditions are predefined to suit different trading strategies. These conditions include:
Increase/Decrease: Standard rate increases or decreases.
Double/Triple Increase/Decrease: A series of consecutive changes.
Aggressive Increase/Decrease: Rate changes that exceed recent movements.
Pause: Identification of no changes (pauses) between rate decisions, including double or triple pauses.
Complex Patterns: Combinations of pauses, increases, or decreases, such as "Pause after Increase" or "Pause or Increase."
█ Trade Execution and Exit:
The script allows automated trade execution based on selected criteria:
Auto-Entry: Option to enter trades automatically at the first valid period.
Max Trade Duration: Optional exit of trades after a specified number of bars (candles).
Pause Days: Minimum duration (in days) to validate rate pauses as entry conditions. This is especially useful for earlier periods (prior to the 2000s), where rate decisions often seemed random compared to the consistency we see today.
█ Visualization:
Several visual elements enhance the backtesting experience:
Time Period Highlighting: Economic time periods are visually segmented on the chart, each with a unique color. These periods include historical phases such as "Stagflation (1971-1982)" and "Post-Pandemic Recovery (2021-Present)".
Trade and Holding Results: Displays the profit and loss of trades and holding results directly on the chart.
Interest Rate Plot: Plots the interest rate movements on the chart, allowing for real-time tracking of rate changes.
Trade Status: Highlights active long or short positions on the chart.
█ Statistics and Criteria Display:
Stats Table: Summarizes trade results, including wins, losses, and draw percentages for both long and short trades.
Criteria Table: Lists the selected entry and exit criteria for both long and short positions.
█ Economic Time Periods:
The script organizes interest rate decisions into well-defined economic periods, allowing traders to backtest strategies specific to historical contexts like:
(1971-1982) Stagflation
(1983-1990) Reaganomics and Deregulation
(1991-1994) Early 1990s (Recession and Recovery)
(1995-2001) Dot-Com Bubble
(2001-2006) Housing Boom
(2007-2009) Global Financial Crisis
(2009-2015) Great Recession Recovery
(2015-2019) Normalization Period
(2019-2021) COVID-19 Pandemic
(2021-Present) Post-Pandemic Recovery
█ User-Configurable Inputs:
Rate Source Selection: Choose between USINTR or FEDFUNDS as the primary interest rate source.
Trade Criteria Customization: Users can select the criteria for long and short trades, specifying when to enter or exit based on changes in the interest rate.
Time Period: Select the time period that you want to isolate testing a strategy with.
Auto-Entry and Pause Settings: Options to automatically enter trades and specify the number of days to confirm a rate pause.
Max Trade Duration: Limits how long trades can remain open, defined by the number of bars.
█ Trade Logic:
The script manages entries and exits for both long and short trades. It calculates the profit or loss percentage based on the entry and exit prices. The script tracks ongoing trades, dynamically updating the profit or loss as price changes.
█ Examples:
One of the most popular opinions is that when rate starts begin you should sell, then buy back in when rate cuts stop dropping. However, this can be easily proven to be a difficult task. Predicting the end of a rate cut is very difficult to do with the the exception that assumes rates will not fall below 0.25%.
2001-2009
Trade Result: +29.85%
Holding Result: -27.74%
1971-2024
Trade Result: +533%
Holding Result: +5901%
█ Backtest and Real-Time Use:
This backtester is useful for historical analysis and real-time trading. By setting up various entry and exit rules tied to interest rate movements, traders can test and refine strategies based on real historical data and rate decision trends.
This powerful tool allows traders to customize strategies, backtest them through different economic periods, and get visual feedback on their trading performance, helping to make more informed decisions based on interest rate dynamics. The main goal of this indicator is to challenge the belief that future events must mirror the 2001 and 2007 rate cuts. If everyone expects something to happen, it usually doesn’t.

Reflected ema Difference (RED) This script, titled "Reflected EMA Difference (RED)," is based on the logic of evaluating the percentage of convergence and divergence between two moving averages, specifically the Hull Moving Averages (HMA), to make price-related decisions. The Hull Moving Average, created by Alan Hull, is used as the foundation of this strategy, offering a faster and more accurate way to analyze market trends. In this script, the concept is employed to measure and reflect price variations.
Script Functionality Overview:
Hull Moving Averages (HMA): The script utilizes two HMAs, one short-term and one long-term. The main idea is to compute the Delta Difference between these two moving averages, which represents how much they are converging or diverging from each other. This difference is key to identifying potential market trend changes.
Reflected HMA Value: Using the Delta Difference between the HMAs, the value of the short-term HMA is reflected, creating a visual reference point that helps traders see the relationship between price and HMAs on the chart.
Percentage Change Index: The second key parameter is the percentage change index. This determines when a trend is reversing, allowing buy or sell orders to be established based on significant changes in the relationship between the HMAs and the price.
Delta Multiplier: The script comes with a default Delta multiplier of 2 for calculating the difference between HMAs, allowing traders to adjust the sensitivity of the analysis based on the time frame being analyzed.
Trend Reversal Signals: When the price crosses the thresholds defined by the percentage change index, buy or sell signals are triggered, based on the detection of a potential trend reversal.
Visual Cues with Boxes: Boxes are drawn on the chart when the HullMA crosses the reflected HMA value, providing a visual aid to identify critical moments where risk should be evaluated.
Alerts for Receiving Signals:
This script allows you to set up buy and sell alerts via TradingView's alert system. These alerts are triggered when trend changes are detected based on the conditions coded in the script. Traders can receive instant notifications, allowing them to make decisions without needing to constantly monitor the chart.
Additional Considerations:
The percentage change parameter is adjustable and should be configured based on the time frame you are trading on. For longer time frames, it's advisable to use a larger percentage change to avoid false signals.
The use of Hull Moving Averages (HMA) provides a faster and more reactive approach to trend evaluation compared to other moving averages, making it a powerful tool for traders seeking quick reversal signals.
This approach combines the power of Hull Moving Averages with an alert system to improve the trader’s response to trend changes.
Spanish
Este script, titulado "Reflected EMA Difference (RED)", está fundamentado en la lógica de evaluar el porcentaje de acercamiento y distancia entre dos medias móviles, específicamente las medias móviles de Hull (HMA), para tomar decisiones sobre el valor del precio. El creador de la media móvil de Hull, Alan Hull, diseñó este indicador para ofrecer una forma más rápida y precisa de analizar tendencias de mercado, y en este script se utiliza su concepto como base para medir y reflejar las variaciones de precio.
Descripción del funcionamiento:
Medias Móviles de Hull (HMA): Se utilizan dos HMAs, una de corto plazo y otra de largo plazo. La idea principal es calcular la diferencia Delta entre estas dos medias móviles, que representa cuánto se están alejando o acercando entre sí. Esta diferencia es clave para identificar cambios potenciales en la tendencia del mercado.
Valor Reflejado de la HMA: Con la diferencia Delta calculada entre las HMAs, se refleja el valor de la HMA corta, creando un punto de referencia visual que ayuda a los traders a observar la relación entre el precio y las HMAs en el gráfico.
Índice de Cambio de Porcentaje: El segundo parámetro clave del script es el índice de cambio porcentual. Este define el momento en que una tendencia está revirtiendo, permitiendo establecer órdenes de compra o venta en función de un cambio significativo en la relación entre las HMAs y el precio.
Multiplicador Delta: El script tiene un multiplicador predeterminado de 2 para el cálculo de la diferencia Delta, lo que permite ajustar la sensibilidad del análisis según la temporalidad del gráfico.
Señales de Reversión de Tendencia: Cuando el precio cruza los límites definidos por el índice de cambio porcentual, se emiten señales para comprar o vender, basadas en la detección de una posible reversión de tendencia.
Visualización con Cajas: Se dibujan cajas en el gráfico cuando el indicador HullMA cruza el valor reflejado de la HMA, ayudando a identificar visualmente los momentos críticos en los que se debe evaluar el riesgo de las operaciones.
Alertas para Recibir Señales:
Este script permite configurar alertas de compra y venta desde el apartado de alertas de TradingView. Estas alertas se activan cuando se detectan cambios de tendencia en función de las condiciones establecidas en el código. El trader puede recibir notificaciones instantáneas, lo que facilita la toma de decisiones sin necesidad de estar constantemente observando el gráfico.
Consideraciones adicionales:
El porcentaje de cambio es un parámetro ajustable y debe configurarse según la temporalidad que se esté operando. En temporalidades más largas, es recomendable usar un porcentaje de cambio mayor para evitar señales falsas.
La utilización de las medias móviles de Hull (HMA) proporciona un enfoque más rápido y reactivo para evaluar tendencias en comparación con otras medias móviles, lo que lo convierte en una herramienta poderosa para traders que buscan señales rápidas de reversión.
Este enfoque combina la potencia de las medias móviles de Hull con un sistema de alertas que mejora la reactividad a cambios de tendencia.