Price Percent Change (O/C)This bar chart indicates the percent change between open and close.
- In addition, the min percent move input, filters out the bars that do not contain the specified min value.
- for example, a value of 4, will filter all the bars that had a +/- 4% or greater move between the open and close.
i'm simply using: (close_price-open_price)/open_price
This is not a supper guru indicator, just a simple filter the days that had similar interday moves.
ค้นหาในสคริปต์สำหรับ "change"

Simple Percentage Change IndicatorFeatures:
- Shows % change per Bar.
- Shows countdown per bar.
- Shows Day, Month, and Yearly % Change in Bottom Right Corner.

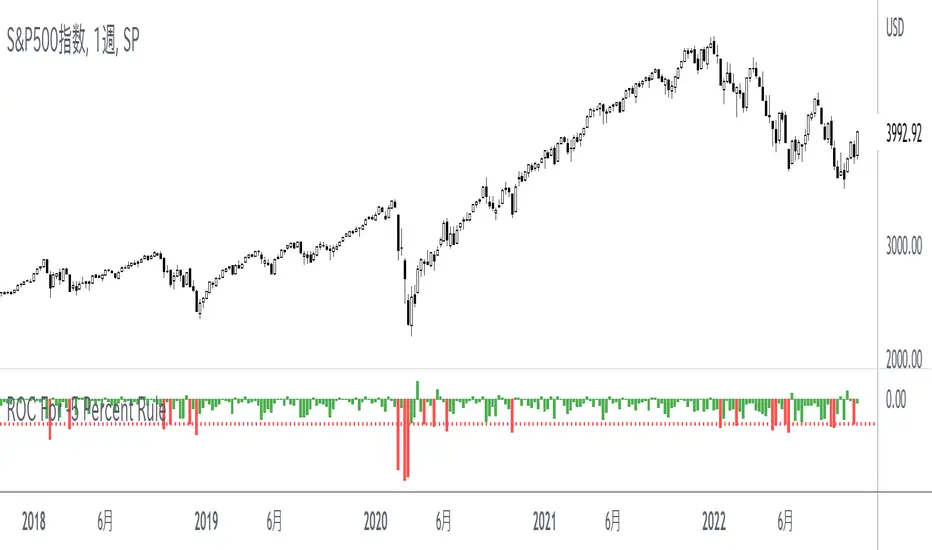
Rate Of Change Trend Strategy (ROC)This is very simple trend following or momentum strategy. If the price change over the past number of bars is positive, we buy. If the price change over the past number of bars is negative, we sell. This is surprisingly robust, simple, and effective especially on trendy markets such as cryptos.
Works for many markets such as:
INDEX:BTCUSD
INDEX:ETHUSD
SP:SPX
NASDAQ:NDX
NASDAQ:TSLA

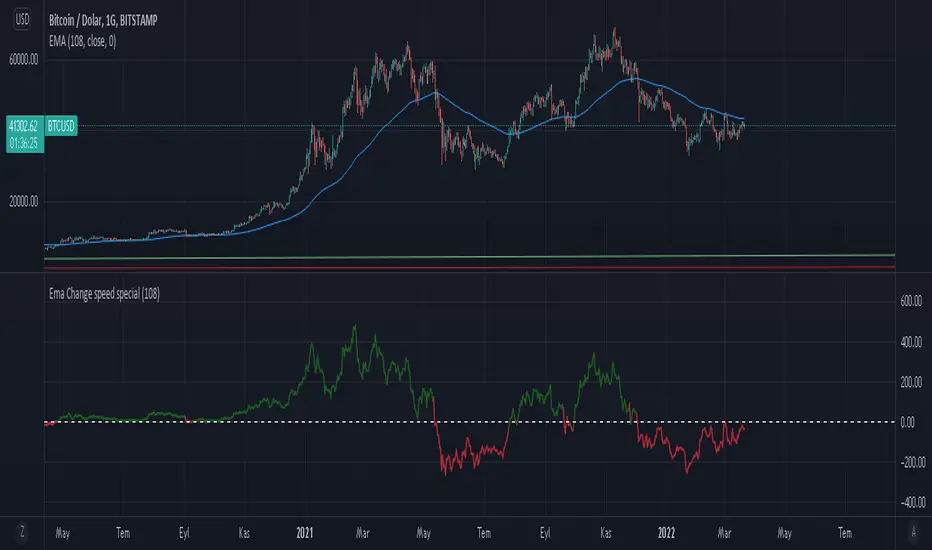
Ema Change speed specialEMA değişim hızını rakamsal olarak gösterir ve grafiğini çizer.
Yeşil = Mevcut fiyat seçili EMA nın üzerinde. EMA yukarı çıkıyor.
Kırmızı = Mevcut fiyat seçili EMA nın altında. EMA düşüyor.
-----------------------------------------
This is showing EMA change speed, as numerical and on the graph.
Green = Current price is above the selected ema . EMA going up.
Red = Current price is below the selected ema . EMA going down.
By Werrasd508
Rate Of Change and rsi zonesHi,
I played with the ROC ( Rate of change ) indicator.
First of all I made it smooth. And came up with decent buy sell signals for long-term potential trades. It can be useful for DCA and profit booking in market tops ( before potential crash)
Recommended time frame = 1 Daily , 3 Daily , Weekly.
Usage :
1. Look for Buy and sell arrow signals. But don't jump straight away. Specially for sell. You might sell early. Instead you can move up your stop loss when you see a sell signal or profit book partially.
if you wait and combine with your own supply and demand zones you can get some nice sell price.
2. Better to wait and look for a divergence in price and ROC. As price will slow down it will reflect on the ROC line. Which means market is exhausted and potentially a correction might happen.
3. You can draw trendline one the ROC and look for breakout. ( warning won't always work )
4. You can also see the RSI in thick red/green color. It will help you determine oversold and overbought zones. Trick is don't sell when it's oversold ( red thick line) . Because it might be a start of a strong uptrend.
So better is to wait and see when the signal is printing then execute.
Best strategy is to DCA and sell in parts whenever you see such signals.
I believe it will visually help us that when to be bull and when to be bear.
Anyway if you find it useful let me know in the comment.
Also if you have some idea to improve the code you can contribute as well.
Thanks . Feedbacks are welcome.

Bitcoin Movement vs. Coin's Movement MTFThis script tracks the percent change of Bitcoin vs. the percent change of the coin on the chart. Crypto markets are usually affected greatly by Bitcoin swings so being able to see if the given coin is trending above or below Bitcoin is useful market data. All choices made with this script are your own! Thanks.

Percentage Change ToolHere is a script that will allow you to see the percentage change from any entry to the current price. You will manually enter the price you bought at in the indicator price menu. The indicator will calculate and display the percentage difference(change) between the buy price and current price, in REAL TIME.
See Screenshot (TOP_RIGHT) for indicator.
Double Click on the Yellow Block and insert your entry price. Click OK. Indicator will display percentage.

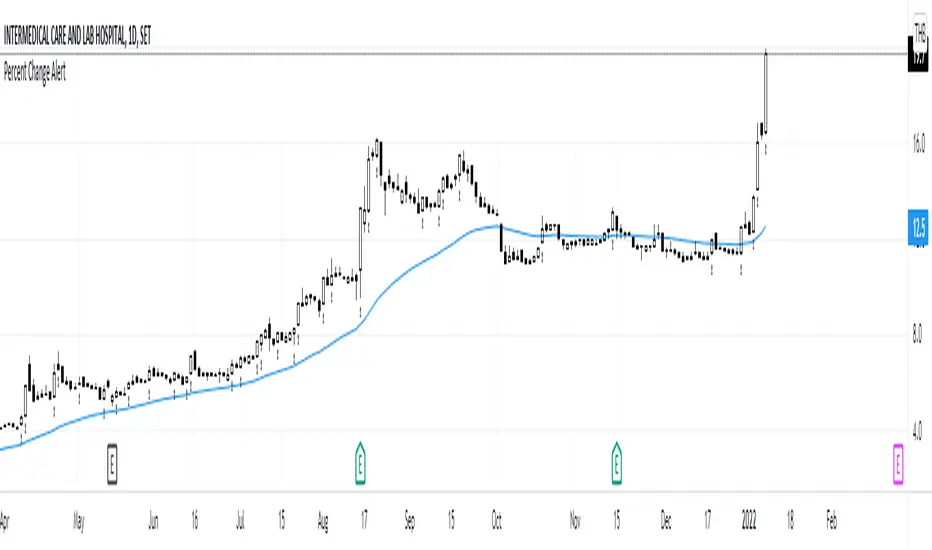
Percent Change AlertUse for alert setting
1st condition = percent change from close price yesterday > 0
2nd condition = volume today > volume yesterday 30%
if both condition is happened at the same time it will show the signal (Black arrow below bar)
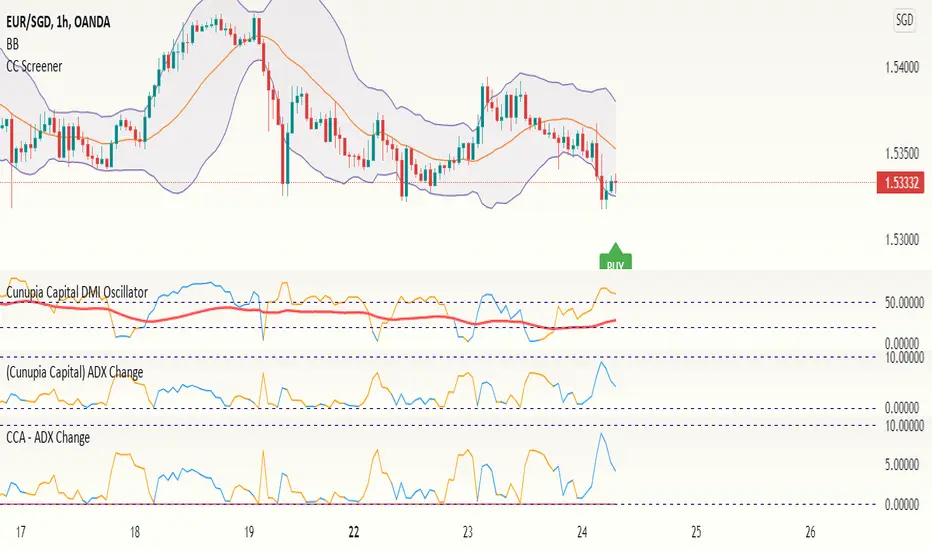
CCA - ADX ChangeThis shows the velocity in which the ADX value is moving. If the velocity is decreasing, the value will go to 0, if it's negative, the line will change to orange. Very useful to tell when the momentum is changing in a particular direction.
Directional Movement w/Hann Slope Change SignalModified version of
Presented here is code for the "Directional Movement w/Hann" indicator originally conceived by John Ehlers. The code is also published in the December 2021 issue of Trader's Tips by Technical Analysis of Stocks & Commodities (TASC) magazine.
John Ehlers is continuing to revamp old indictors with Hann windowing. The original script uses zero line cross to signal buy/sell in this modified version buy/sell is signaled based on slope change, where signal is generated on with previous value is greater/less than current value
If current > previous = buy and if current < previous = sell

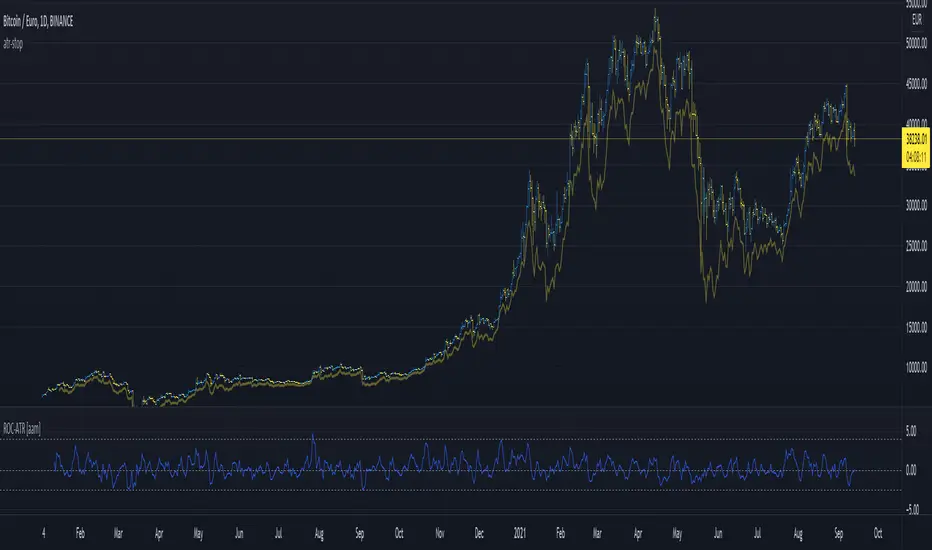
Rate Of Change ATRThis is a very basic, but powerful script.
It gives you the ratio between the rate of change of the last x days and the average true range of the last y days.
---> ROC-ATR Ratio = ROC/ATR
Therefore, you can see how much the price has moved relative to the prices in the past.
This is important because (in my opinion) the basic ROC indicator is not very meaningful if you don't look at the average volatility of recent history.
For example, a ROC of 5% over the last 3 days might be very high for Forex but very small for some crypto.
Consequently, this indicator makes it possible to compare (and be used on) every instrument in every industry the same way.
Generally speaking, it makes more sense if the ATR length is larger than the ROC length.
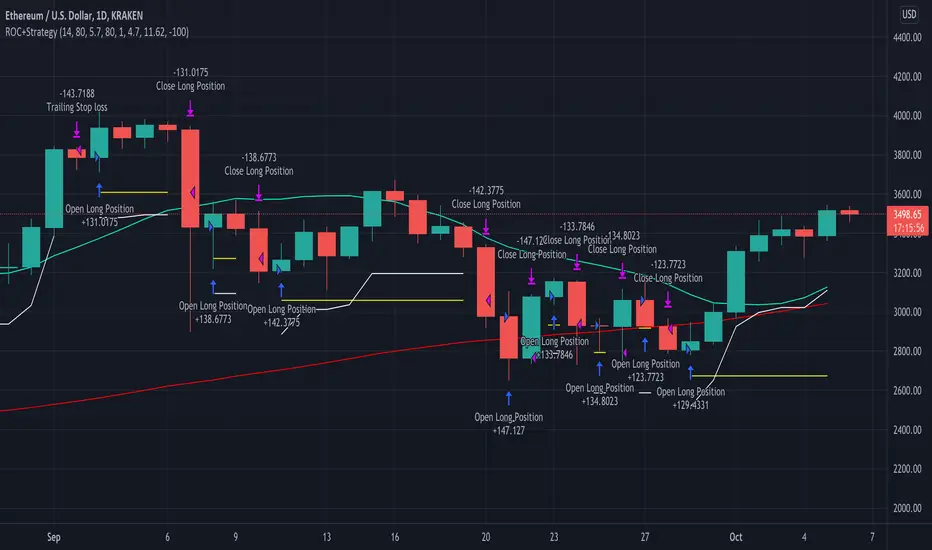
Rate of Change StrategyThis strategy calculates the rate of change over time to determine buy/sell points. This strategy is best run with 1 hour candles .
Configurable values:
SMA Fast (days)
SMA Slow (days)
SMA Reference (days)
ROC Low (%)
ROC High (%)
Order Stake (%)
Look back Candles
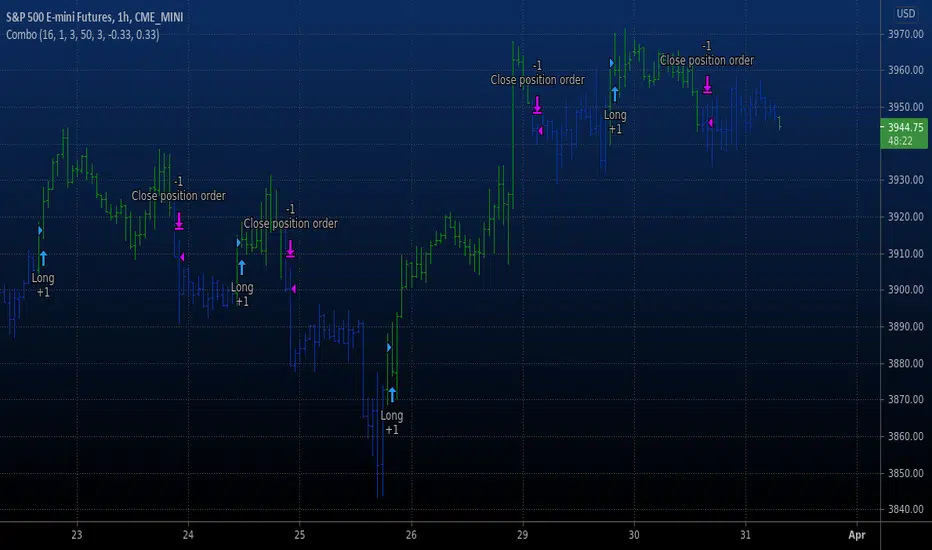
Combo Backtest 123 Percent change bar This is combo strategies for get a cumulative signal.
First strategy
This System was created from the Book "How I Tripled My Money In The
Futures Market" by Ulf Jensen, Page 183. This is reverse type of strategies.
The strategy buys at market, if close price is higher than the previous close
during 2 days and the meaning of 9-days Stochastic Slow Oscillator is lower than 50.
The strategy sells at market, if close price is lower than the previous close price
during 2 days and the meaning of 9-days Stochastic Fast Oscillator is higher than 50.
Second strategy
This histogram displays price or % change from previous bar.
WARNING:
- For purpose educate only
- This script to change bars colors.

Percent changeThis indicator shows WMA ribbons of the percentage of price movements.
Strong peaks show unusual price movement and might indicate a good time to close your position.
A narrow band shows stable price movement and could indicate a good time to get into a position. (Squeeze)

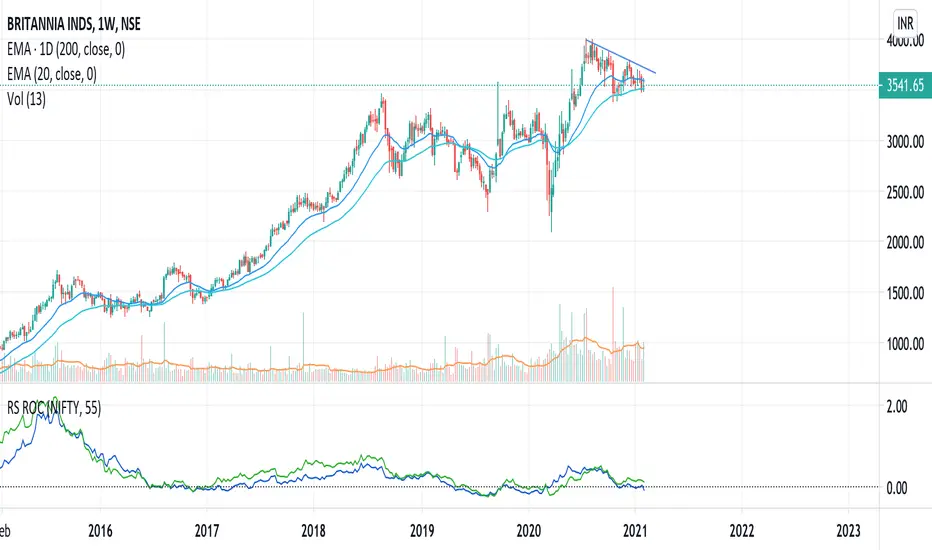
Relative Strength (RS) and Rate of Change (ROC) Combined in oneThis indicator combines Relative Strength and Rate of Change (ROC) in one plot. Change the period and comparative symbol (defaulted to NSE:NIFTY) in settings.

Moving Average Rate of changeThis indicator measures rate of change of moving average.
Steps to derive are as follows:
Calculate moving average of Source based on Moving Average Type and Moving Average Length
Find the difference between moving average value of present bar and LoopbackPeriod bars back.
Calculate ROC of moving average with respect to either Moving average itself or with respect to close price. PercentOfSource when unchecked calculates percent based on Moving Average. If not based on close price.
Calculate moving average of ROC based on ROC Moving Average Type and ROC Moving Average Length .

Candle Color ChangeSimple code for change in Barcolor if the range (high-low) is bigger than the last 5 candles.

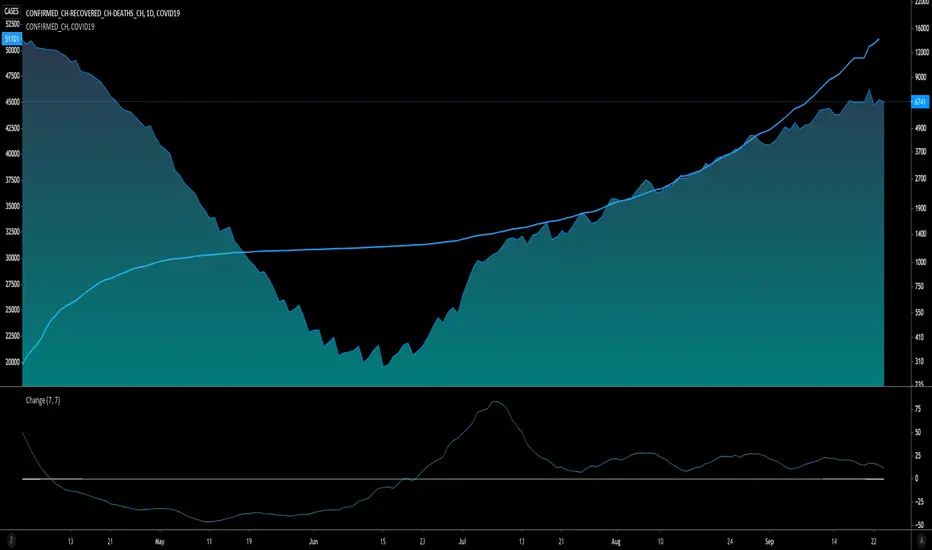
Smooth ChangePercentage of change, compared to a certain number of candles back, and optionally smoothened as a moving average. I use this for Covid-19 numbers, where I compare to 7 days ago, and use a 7 day moving average over that, which gives me a nice idea of the real corona trend.
Average change histogramThis histogram shows the average change in price between the past x candles close. If the average change is increasing the color of the histogram becomes dark green (if above 0) or dark red (if below 0).
This can be used for trend detection or the spotting of parabolas.

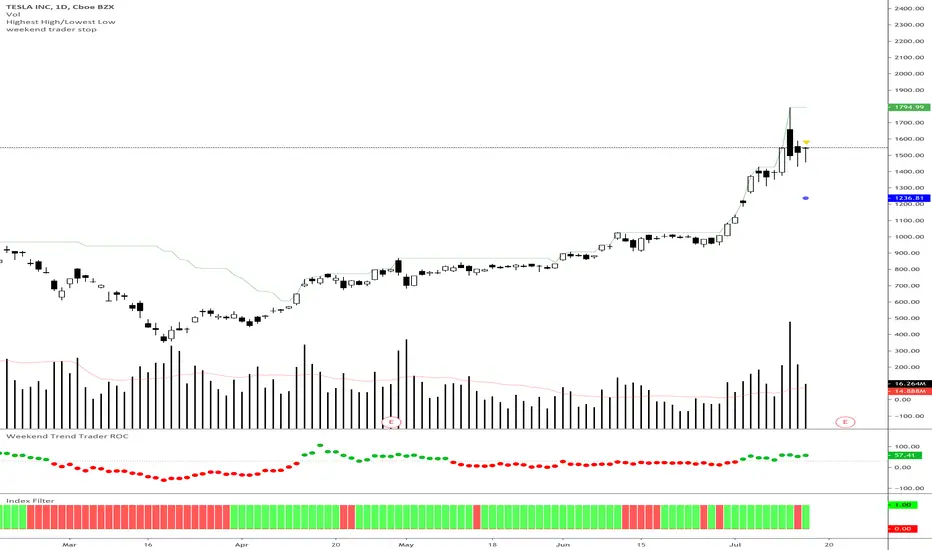
Weekend Trader Smoothed Rate of Change
Rate of change indicator based on Nick Radge's Weekend Trend Trader Strategy, with an added extra of EMA smoothing if you want it.
This indicator simply turns green when the rate of change is above a certain level (value is set in threshold)
Threshold is defaulted to 30 as outlined in the strategy rules