EulerMethod: CryptoCapEN
Shows the cryptocurrency market capitalization balance for the period
Initial data
Bitcoin Capitalization - CRYPTOCAP: BTC
Altcoin Capitalization - CRYPTOCAP: TOTAL2
Money circulates from fiat to bitcoin, from bitcoin to altcoins, from altcoins to fiat
This indicator applies the RSI algorithm to changes in capitalization
The divergence of indices shows an imbalance
Balance level: 0, Maximum: +100, Minimum: -100
(!) Artifacts of indicator readings may occur due to incorrect input data
RU
Показывает баланс капитализации крипторынка за период
Исходные данные
Капитализация Биткоина — CRYPTOCAP:BTC
Капитализация Альткоинов — CRYPTOCAP:TOTAL2
Деньги циркулируют из фиата в биткоин, из биткоина в альткоины, из альткоинов в фиат
В этом индикаторе применяется алгоритм RSI к изменениям капитализации
Расхождения индексов показывают дисбаланс
Балансовый уровень: 0, Максимум: +100, Минимум: -100
(!) Могут возникать артефакты показаний индикатора из-за неправильных исходных данных
ค้นหาในสคริปต์สำหรับ "btc股市下跌"

Buy the dip in Bull Market by BensonBuy the dip in Bull Market by Benson
This indicators is used for showing buying timing in bull market, buy BTC when the index is below 0.
牛市作多指標 By Benson
在指標下穿零軸時買入 BTC

Noro's Channel Close StrategyFor:
- BTC/USD (or XBT/USD, or BTC/USDT) and ETH/USD (or ETH/USDT)
- timeframe 4h
Strategy
Donchain Channel is used.
If the candle is closed above the top line of the channel, open the long (and close the short)
If the candle has closed below the bottom line of the channel - you must open the short (and close the long)
Reverse trading.
Take-profit and stop-loss are not used

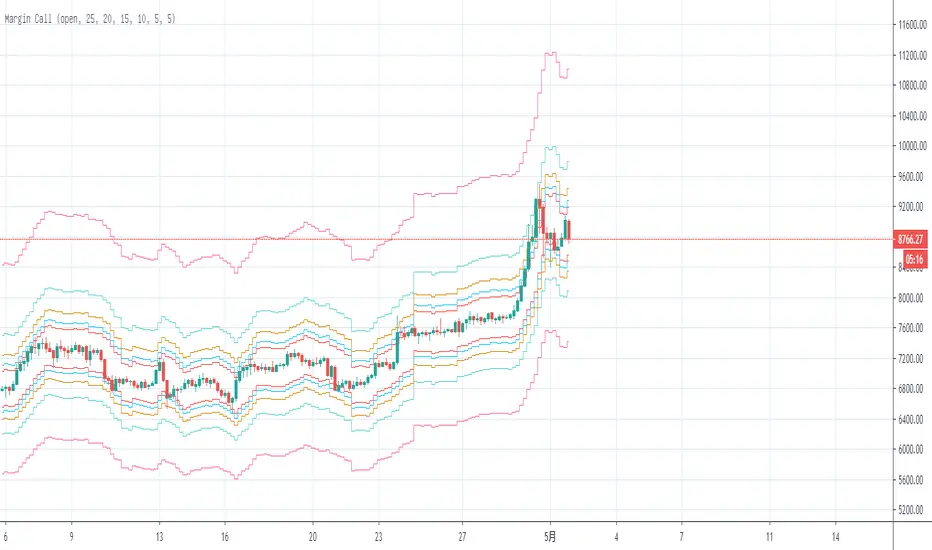
Margin Call MovingAverageThe first edition;
This is a tool to calculate BTC long “Margin Call” price line, you can intuitively adjust the leverage multiple to calculate the current “Margin Call” price line position, you can also adjust the average price to see the average“Margin Call” price;
这是一个计算BTC“爆仓”多头价格线的工具,可以直观地调整杠杆倍数来计算当前“爆仓”价格线位置,也可以调整平均价格来查看平均“爆仓”价格
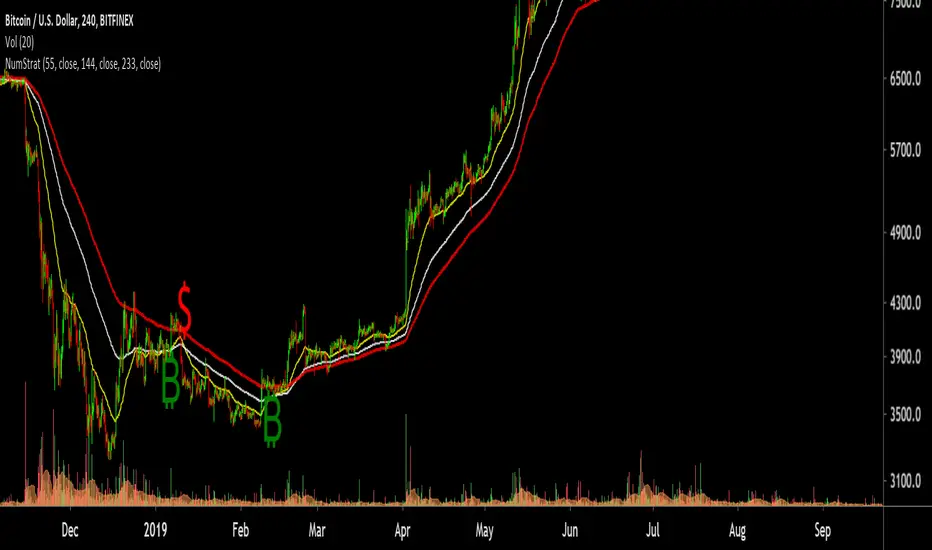
Number StrategyA simple strategy based on fib ratios and numbers
Best time frames for highest accuracy ( Requires Tradingview Pro )
34 mins for quick scalps
89 mins for weekly Swings
254 mins for monthly swings
-Ability to set alerts for btc and $ singals
-Modify Ema values, Set colour
-Trend following strategy, Needs an active trend for best results
-sideways/choppy action results in bad signals
How to trade:
-----------------
Long if Btc signal appears , preferred if price is trading above the 233 EMA .
You can use the 233 EMA for activating trades during price retest
Short if $ signal appears , preferred if price is trading Below the 233 EMA .
You can use the 233 EMA for activating trades during price retest
VWAPVWMAATRAdapted ATR that i am using in BTC 15M charts. It is an usual ATR-Stop smoothed by a VWAP and a VWMA.
This crazy config i am using only for BTC, but i found others configs with others assets, like brlusd contracts.
You can turn off the barcolor function and change the lenght of the VWAP and VWMA.

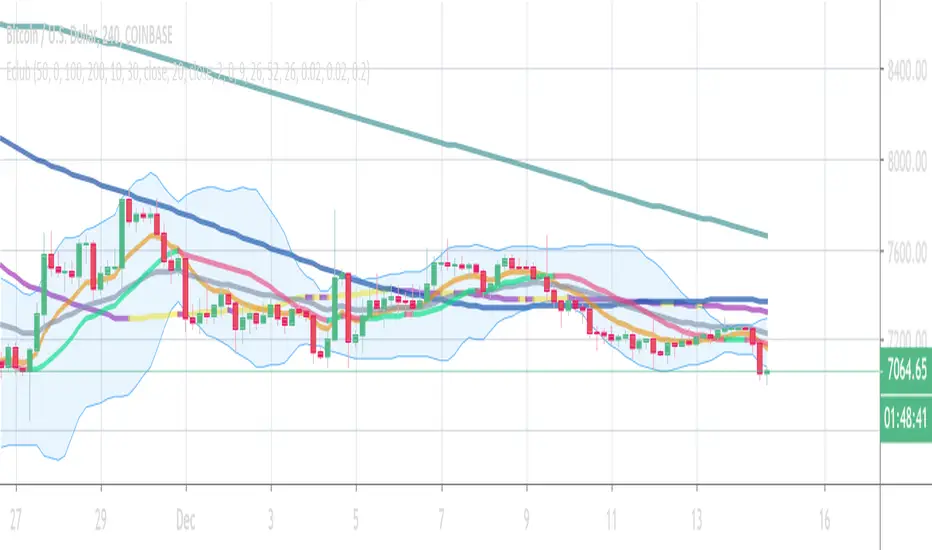
Eclub Multi IndicatorThis multi Indicator includes:
3 Moving Averages
2 Exponential Moving Averages
Bollinger Band
Ichimoku
Parabolic SAR
You can change the colors if you want. Go to setting to enable Ichimoku or SAR or disable others.
The color tolerance is by default zero which results in a very sensitive color change. You can change it to decrease the sensitivity. The value should be the last decimal of the price or the last two decimals of price etc.
If you like this indicator donate some BTC to the following address:
BTC address:
18NSD2xdJyYWoC4CSr4xg1hMk2q5cBbr8T
Robot WhiteBox ChannelPrice Channel
The strategy uses the price channel indicator. In the chart, the price channel is displayed in black lines. Offset 1 candle to the right for clarity. The red line is the middle of the price channel.
Trading
You must use market stop orders.
If the price is higher than the top black line, open the long position (and close the short position)
If the price is lower than the lower black line, open the short position (and close the long position)
If the price has returned to the middle of the price channel (red line) - it is necessary to close any position.
You can disable the stop-loss orders. It will be a reverse-trading system.
For
- BTC/USD, XBT/USD, ETH/USD, etc (Do not use ANY/BTC symbols!)
- Timeframes: 1h, 4h, 1d

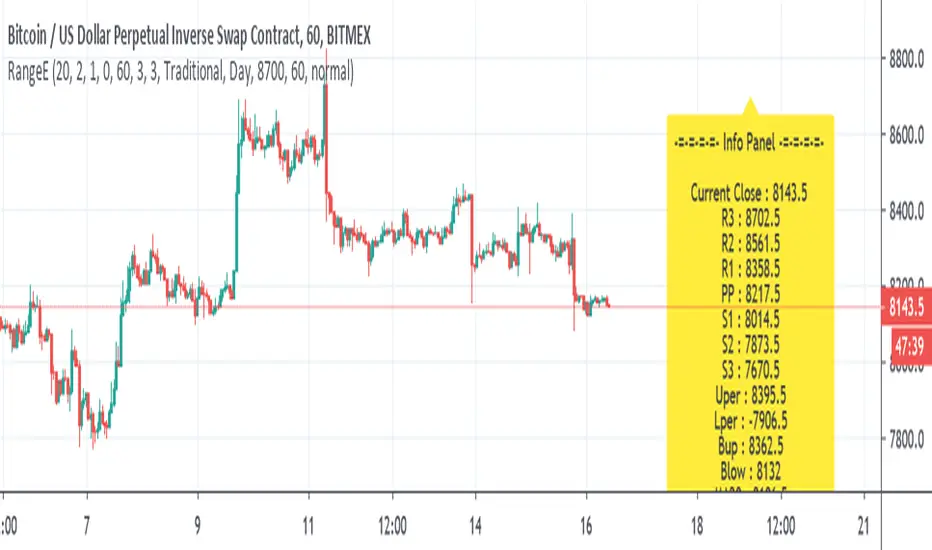
Range EstimateAs a trader I need to know what are the best ranges to get in or out
So this tool try to help a little bit .
First we have Pivot points (all forms with fib ,traditional etc)
next is percentage channel (uper=upper % from close and Lper=lower % from close) , in btc I use 3% up or low for 1 hour candles as it give me good range of lower and upper bound . This you need to change for different TF or different assets
next we have Bollinger upper and lower (Bup= Bollinger upper and Blow=Bollinger lower) it has also MTF function
last we MA =,20,50,100,200
in total the aim of this indicator is to give fast glance on the numbers that important to you as trader fast with a clean graph so you can add your indicator to it to see better how they work
The info panel you can change the font size, you can change distance by offset
and the position on the graph , you need to adjust with position -in this case since it btc I put number of 8700
let say it ETH then I put a number 5% above the close number
if it XRP = then the same trick , lets say 0.3 etc
Bitcoin Network Value to Transactions [aamonkey]Cryptoassets have been quite turbulent in the past few weeks.
At times like this, it is especially important to look at the fundamental foundations of cryptoassets.
This indicator is based on the Network Value to Transactions , or NVT .
Definition:
NVT = Network Value / Daily Transaction Volume
Because this indicator is pulling the Daily Transaction Volume for BTC it can only be used for BTC and the daily timeframe.

A Simple Bitcoin Stock to Flow ModelThis is just a bit of fun. Stock to flow is a hot topic so I thought I'd mess around. Here is a model that is very closely based on the one available here: digitalik.net . I take no credit for the actual model.
It can be tuned with parameters a and b, but this is the best fit imo.
The model is a bit pointless as Tradingview doesn't let us run scripts on future candles, so no predictions.
The blue line is the actual model and the pink line is a 200 MA.
Run this script on the DAILY chart please ;)
Here's a close up of current action. Interesting maybe ;)

Volumen Consolidado por DIVISAS contra BITCOIN #09/2019Volumen Consolidado de Bitcoin clasificado por divisas. Gracias a este indicador se podrá obtener la dominancia y participación en el mercado de las diferentes divisas o contratos. Actualmente el indicador incluye un aproximado de 40 pares de BTC contra diferentes divisas, en las cuales resaltan:
*USD
*USDT
*USDC
*XBT
*CNY
*KRW
*GBP
*EUR
Este indicador es un criterio utilizado para un indicador que estaré subiendo en proximamente, el cuál sí contará con el volumen total expresado en un solo panel. Es decir, este indicador, solo especifica una parte del indicador general, que será el volumen consolidado total, que este expresará la cantidad total de bitcoins negociados a nivel mundial. El USD es la moneda con la que el "Market Maker", respalda sus fondos para operar el mercado, cosa que sabemos, por lo tanto otras divisas serían solo un metodo de compra para el retailer(cosa que me motivó a la creación del indicador ya que se podría conocer el sentimiento y reacción de los mismos en lo que ocurre en el mercado).
Recordemos que el principal problema de los análisis que toman en cuenta el precio y volumen en bitcoin es que tradingview te da a conocer solo el "volumen del exchange", por lo tanto no obtienes una cifra exacta de los bitcoins comprados y/o vendidos en todos los sitios en los que se negocia, lo que dificulta tener una percepción objetiva de lo que sucede en el mercado, ya que te guiarías por el volumen que te da el exchange dónde operas y no el que es real.
Sin nada más que decir, espero que tome en cuenta este recurso para sus análisis, que será esencial para aquellos que operan con precio y volumen.
Si quiere realizar alguna colaboración y/o donación por mí obra, será muy bien bienvenida y agradecida:
BTC: 1TqvNSQs39pr2mLeDo3swcrkYvkK1YQAN
LTC: LKYYkJQHBvnEaJSatp53pg8C7iKp9Jp45B
ETH: 0x6e0902a16a0a0d6379cd8600c455a7ab335278cc

Hedging CryptocurrencyПри написании скрипта автор мотивировался статьей о хэджировании криптовалют . Для работы с данным скрипом необходима установить дневной таймфрейм.
Скрипт " Hedging Cryptocurrency ", по своей сути, является стохастическим осциллятором данных спрэда между ценой (годичной давности) на BTC и равноценным количестве выбранного альткоина. Стоит сразу заметить, что для корректного использования данного скрипта необходима выбирать инструмент вида XXX/USD (где XXX - выбранный альткоин, а USD - стабильный альткоин, привязанный к доллару). В настройках можно включать/выключать сигналы на покупку (зеленые точки) и продажу (красные точки) альткоина. Закрывать сделку можно, когда осциллятор перешагнет нулевую отметку. ВАЖНО, что для хэджирования криптовалют, при открытии сделки на альткоин, необходимо также открыть сделку и на BTC, но уже в обратном направлении. Кроме всего перечисленного сам осциллятор имеет градацию зеленых и красных оттенков, которые говорят об условной перекупленности и перепроданности соответственно. Добавлю, что индикатор чаще ошибается при низкой корреляции между инструментами, поэтому в такие моменты он начинает сигнализировать черными крестиками. В этих ситуациях скрипт не гарантирует ту точность, которую может предложить :-)
Само собой данный индикатор только инструмент, а его сигналы не являются абсолютно верными, поэтому с большим удовольствием почитаю в комментариях ваши предложения по его усовершенствованию.

ETH World Volume (Multi-Exchange) [v2019-07-20]This is a fork of but applied to Ethereum instead of BTC

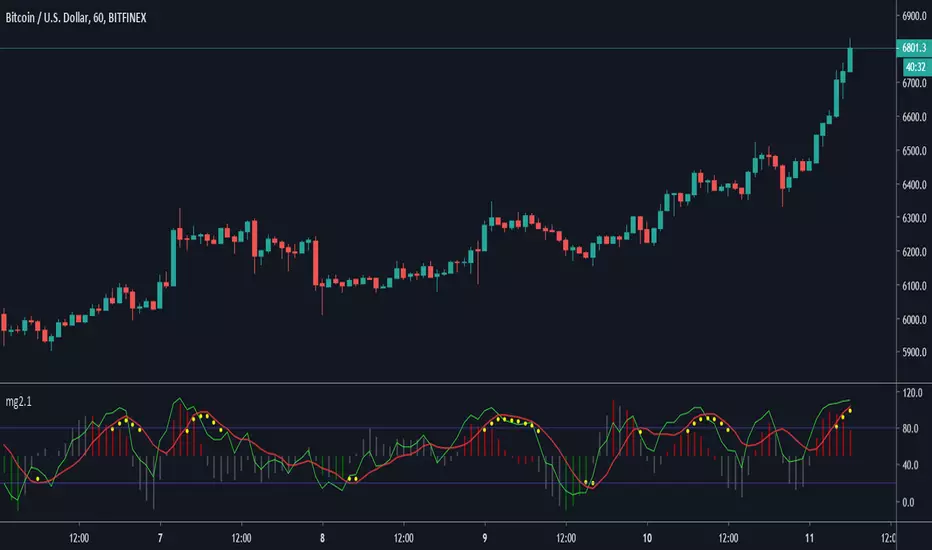
Minimal Godmode 2.1// Acknowledgments:
// Original Godmode Authors:
// @Legion, @LazyBear, @Ni6HTH4wK, @xSilas
// Drop a line if you use or modify this code.
// Godmode 3.1.4: @SNOW_CITY
// Godmode 3.2: @sco77m4r7in and @oh92
// Godmode3.2+LSMA: @scilentor
// Godmode 4.0.0-4.0.1: @chrysopoetics
// Jurik Moving Average: @everget
// Constance Brown Composite Index RSI: @LazyBear
// Wavetrend Oscillator: @fskrypt
// TTM Squeeze: @Greeny
// True TSI/RSI: @cI8DH and @chrysopoetics
// Laguerre RSI (Self-Adjusting Alpha with Fractals Energy): @everget
// RSI Shaded: @mortdiggiddy
// Minimal Godmode v2.0:
// 6 BTC pairs/exchanges (instead of 11) to reduce loading time from the pinescript security() function
// Volume Composite for engine calculation
// TTM Squeeze on Wavetrend Signal
// Constance Brown Composite Index RSI (CBCI)
// TrueTSI (Godmode 4.0.0 implementation)
// Laguerre RSI (LRSI)
// Minimal Godmode v2.1:
// Removed TTM Squeeze and Volume Composite
// EMA for Wavetrend Signal
// Multi-exchange for BTC no longer the default
// mg engine toggle for CBCI, Laguerre RSI, and TTSI
// Wavetrend Histogram component toggle
Big 9 Real volume exchanges - On Balance VolumeHere is an On Balance Volume indicator using only volume data from the 9 biggest exchanges trading BTC/USD or BTC/USDT. These 9 exchanges were chosen based on the report by Bitwise Invest stating that 95% of the volume on CoinMarketCap is fake. On these 9 exchanges, however, volume data appears to be reliable. Please note BitFlyer was not included because it does not trade in USD. Please note also that data on all 9 exchanges is only available from August 2017. A separate volume indicator indicator is available at
Anyone is welcome to share and modify.
- stargazer
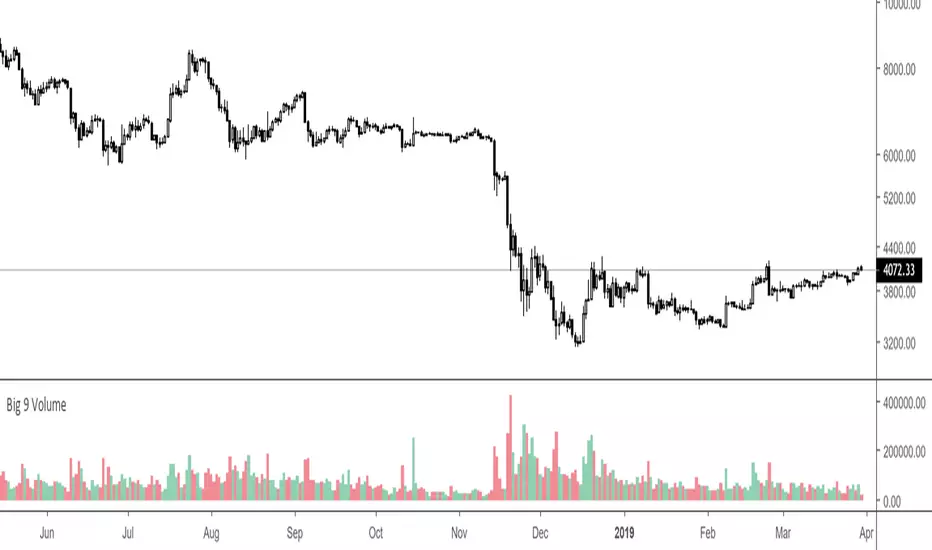
Big 9 Volume - Volume indicator from exchanges with real volumeHere is a very basic indicator combining the volumes of the 9 biggest exchanges trading BTC/USD or BTC/USDT. These 9 exchanges were chosen based on the report by Bitwise Invest stating that 95% of the volume on CoinMarketCap is fake. On these 9 exchanges, however, volume data appears to be reliable. Please note BitFlyer was not included because it does not trade in USD. Please note also that data on all 9 exchanges is only available from June 2018.
Anyone is welcome to modify this and make it more elegant, this was just a quick implementation.
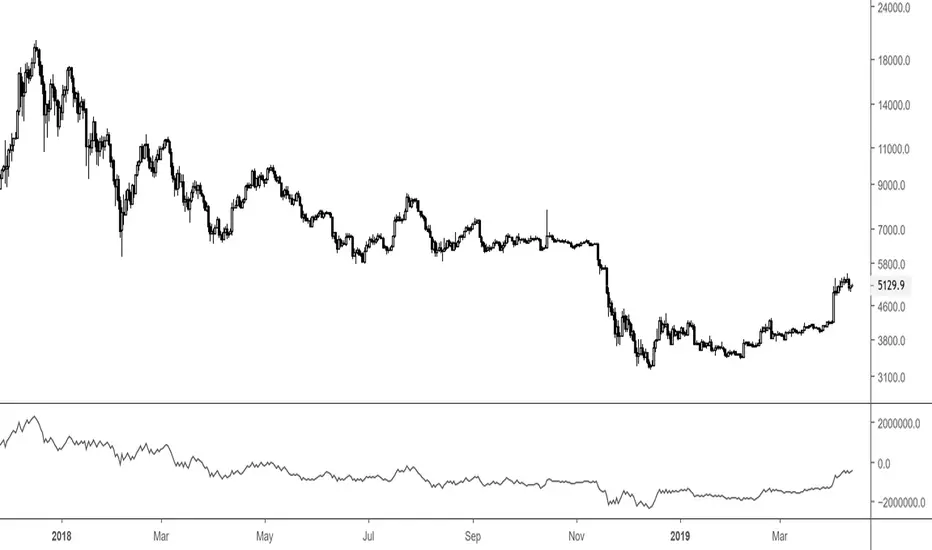
Major Mayer MultipleAdjusted version of the BTC Mayer Multiple developed by Trace Mayer www.theinvestorspodcast.com
This version includes two novelties. The first one replaces BTC with Total Market Cap from 2016/2017 (depending on your moving averages) to present and the second is that we consider two Moving Averages to produce more detailed lows.

Volume RSI altsSo this allow you to put major alts against each other and compare the Volume RSI to each other and to the alts that you are currently looking In this example we see TRX breaking from the major pack of the other alts in 1D chart making the breakthrough up
Each alt has it own color
if you want to add more alts just copi paste and add the code for your alt to make this system better for you
here you see how XRP break from the pack show in arrow down
here on 4 h chart we see LTC is breaking before BTC (its a btc chart and LTC in orange)

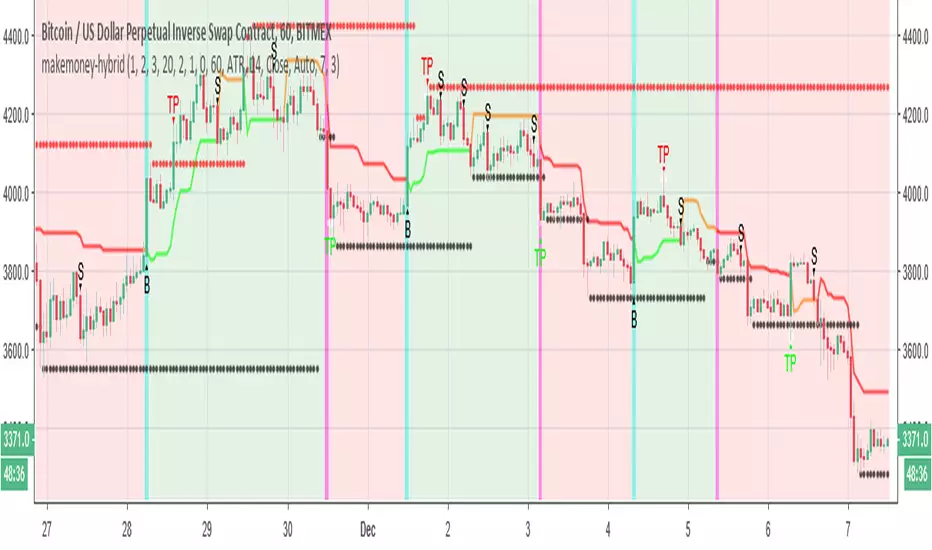
makemoney-hybridSo this model is little different from moneymaker model in the following :
The buy system based on super trend , the sell system =S is based on the volume model of money maker
in the example we set 7% take profit for both long or short . you can set it even higher since btc very volatile now
in cases where it did not reach the target its made min of 3% each direction
So the buy in this system will be in true uptrend . since now the btc is falling more then going up we can make more money on shorts and wait for the longs when they come :)
the bullish and bear zone based on super system
you need to set correctly your take profit in order to make it to work . the more volatile will be the coin the better will be the results (this is the theory )
HEAVI - HawkEye Aggregated Volume IndicatorThis is combined Aggregated BTC Exchange Volume by Neobutane with HawkEye volume clone indicator by LazyBear.
Indicator includes aggregated raw BTC volume from 9 user selectable fiat and tether exchanges + Exponential MA + hawkeye bar coloring where: green is bullish volume, red - bearish and white - volume neutral to the market:
Bitfinex
Coinbase
Bitstamp
Kraken
Binance
Poloniex
Bittrex
bitFlyer
Bithumb

RSI / Stoch / SRSI / MFI / Aroon Overlay [SigmaDraconis]Combines 4 popular indicators (RSI, Stoch, SRSI, MFI) and 1 peculiar one (Aroon) in 1 for those who want to save indicators but not only.
This is an evolution of my (simpler) "RSI / Stoch / Stoch RSI (SRSI) Overlay " that you can find on my scripts.
Added bands for oversold/overbought areas (70/30 common for RSI and 80/20 for SRSI and MFI), as well as a middle 50 horizontal line.
Neutral bands around 55-45 added as well that can be hidden for less clutter. I also recommend a more transparent coloring for these since Pine script doesn't allow default transparency for horizontal lines.
By default only RSI and Stoch are activated, you can activate Aroon, MFI and SRSI on the inputs window.
Some extra notes:
* RSI, Stoch and MFI can help to strengthen one's decision as well as Aroon to predict a possible trend reversal, SRSI can show when RSI has high probability of being topped or bottomed when oversold/overbought but don't forget to look at volume and how the trend progresses that can keep SRSI above 80 or below 20 while RSI and price continues to trend, divergences are most helpful here to find possible reversal areas.
* This chart depicts some interesting divergences, as well as Stoch tops and bottoms and confluences between RSI/MFI and Stoch on some over-extended tops and bottoms that shown being good reversal zones.
RSI resistances are shown as well, failing to break above 60 or the neutral zone (this is a bearish BTC trend chart after all) or failing to gain support to break up certain levels (RSI notes a more bullish trend when consistently above 60 and more bearish below 40).
If you like it and use it to profit, please tip me below :)
Tip jars:
BTC: 15nMBiEGVrdGcu9C1h6QRcTNRvugHkqrMQ
ETH: 0xC33845946c48B61fBCbEA0367ec2238CaF2b73bc
BTS: sigma-draconis

