Fierytrading: Volatility DepthDear Tradingview community,
I'd like to share one of my staple indicators with you. The volatility depth indicator calculates the volatility over a 7-day period and plots it on your chart.
This indicator only works for the DAILY chart on BTC/USD.
Colors
I've color coded the indicator as follows:
- Red: Extreme Volatility
- Orange: High Volatility
- Yellow: Normal Volatility
- Green: Low Volatility
Red: extreme changes in price. Often during local tops and bottoms.
Orange: higher than average moves in price. Often before or after a "red" period. Often seen in the middle of bear or bull markets.
Yellow: normal price action. Often seen during early stage bull-markets and late stage bear-markets.
Green: very low price movement. Often during times of indecision. Once this indicator becomes green, you can expect a big move in either direction. Low volatility is always followed by high volatility.
In a long-term uptrend, a green period often signals a bullish break out. In a long-term downtrend it often signals a bearish break out.
How to use
Save the indicator and apply it to your chart. You can change the length in the settings, but it's optimized for 7 days, so no need to change it.
I've build in alerts for all 4 different volatility periods. In most cases, the low volatility alert is enough.
Good luck!
ค้นหาในสคริปต์สำหรับ "btc期权交割时间"

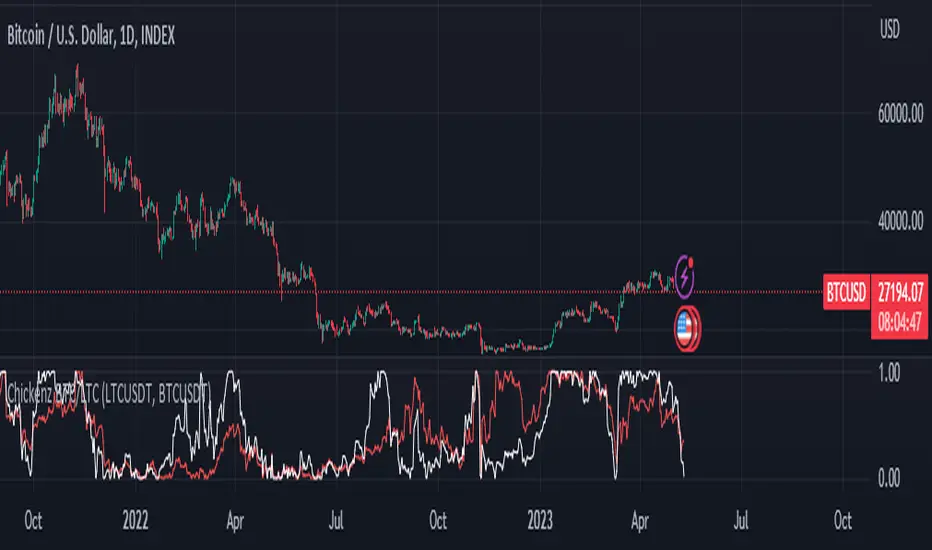
Chickenz Compare performance of 2 Tickers (Default - BTC/LTC)Compare relative performance of 2 Tickers directly on one chart. Default BTC/LTC but can be adjusted to any pair.
First attempt at pine scripts so go gentle on feedback ;)
Altcoin Dominance (without ETH) Excluding Stablecoins UnsymetricAltcoin Dominance (without ETH) Excluding Stablecoins Unsymetric
The purpose of the script is to show Altcoin's strength without Ethereum once we exclude stablecoins.
So we look into all altcoins besides eth and besides stablecoins divided by a value of eth+btc

PSAR BBPT ZLSMA BTC 1minLong entry:
PSAR gives buy signal
BBPT prints green histogram
ZLSMA is below the price
ZLSMA has uptrend
SL is smaller than the max SL
Optional Sessions and EMA filters
Short entry
PSAR gives sell signal
BBPT prints red histogram
ZLSMA is above the price
ZLSMA has downtrend
SL is smaller than the max SL
Optional Sessions and EMA filters
SL:
Placed below ZLSMA + offset on long
Placed above ZLSMA + offset on short
TP1:
1x the SL by default
Takes no profit by default, 50% is also a good setting
TP2:
2x the SL by default
Take out all remaining position size.
If price reaches TP1, the SL is set to the entry price.

Time Based Crypto DayTrade StrategyThis is a time based strategy, designed to enter and exit within the same day of the week, using different hours for entry and exit.
The script is long only direction, and it has no risk management inside, so use it with caution.
At the same time you can also calculate each individual hour return within a certain day, and make your own idea about the best moments to be enter.
In order to filter a bit from the bad trades, I have applied an ATR filter, to check if that volatility is rising in order to help eliminate some of the bad trades when there is no volatility around.
For this example, on BTC, it seems that for the last years, on tuesday and thursday, enterring at the beginning of the daily candle, 01:00hours and exit at 00:00 hours, seems to give positive results giving the idea that can be converted in some sort of edge into our favor.
However dont take this entirelly for granted and conduct your own searches

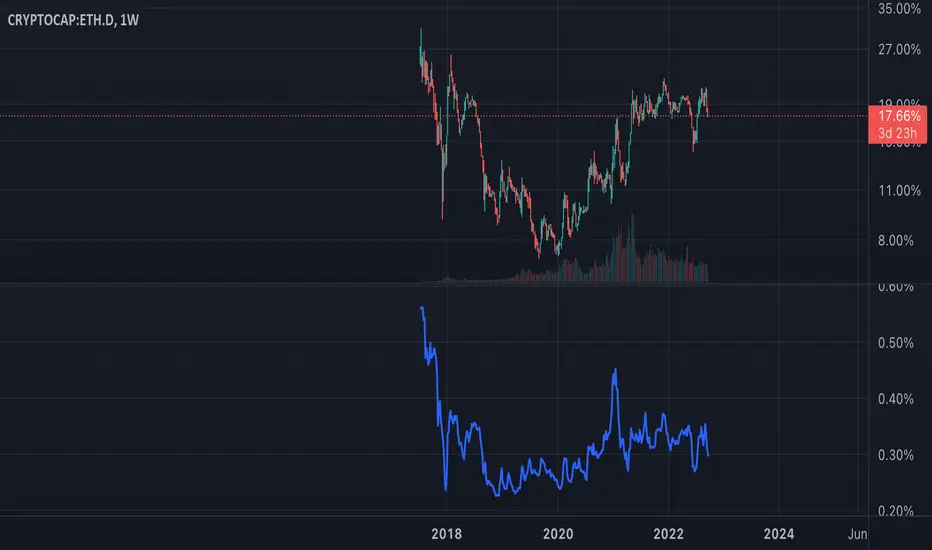
ETH Dominance Excluding BTCThe indicator shows when ETH is undervalued or overvalued with regard to other alts. BTC capitalization is not taken into account.

Bitfinex Shorts StratOverview
This strat applies the data from BITFINEX:USDSHORTS to the RSI indicator in order to provide SHORT/LONG entries as the number of contracts goes up and down. Although Bitfinex has lost relevance over the years its generally considered an exchange dominated by smart money rather than retail. I'd like to see if any insights can be gained by following their trading behaviour.
How to use
Select the underlying security you wish to trade and load the indicator. Select the appropriate short security by searching in the Bitfinex Short Symbol. RSI settings apply to short symbol not the actual asset. Strategy shorts the underlying asset when shorts rise and longs when they drop. The shorts symbol will follow the value of the loaded chart. Works best on 4 hour chart.
Why use shorts only rather than both long/shorts?
Bitfinex longs seem to be on a long-term uptrend accounting for 25x the number of shorts. Might be enormous confidence on part of the whales, but more likely reflects selling spot and buying perp. Given the size disparity and price action I don't think longs info is adding much.
Problems with script:
a) We don't really know the intentions of short players (e.g. speculation or hedging spot)
b) The script uses a decline in shorts as a long signal
c) RSI is a blunt tool there are probably better options for calculating high/lows in shorts
d) Shorts are accumulated both at highs and also when BTC price is already heavily trending down. This suggests some are speculative (at the highs) or protective/hedging during a decline
Takeaways:
Based on this strat Bitfinex whales are more wrong than right.
Results don't carry across well into altcoins using the accompanying short symbol. However, what is interesting is that applying the BITFINEX:BTCUSDSHORTS to altcoin charts does work pretty well.
Strat needs some refinement to control for entries under different circumstances.
Probably not a great idea to use this as a strategy in isolation, but highlights how Bitfinex whale behaviour is a good gauge to follow.

Directional Index Macro IndicatorWhat is This For?
The default settings for this indicator are for BINANCE:BTCUSDT and intended to be used on the 3D timeframe to identify market trends. This indicator does a great job identifying whether the market is bullish, bearish, or consolidating. This can also work well on lower time frames to help identify when a trend is strong or when it's reversing.
Directional Index Rate of Change
Core to this indicator is the rate at which DI+ and DI- are moving away or towards each other. This is called The Rate of Change (ROC). "The ROC length dictates how many bars back you want to compare to the current bar to see how much it has changed. It is calculated like this:
(source - source /source ) * 100"
The rate of change is smoothed using an EMA. A shorter EMA length will cause the ROC to flip back and forth between positive and negative while a larger EMA length will cause the ROC to change less often. Since the rate of change is used to indicate periods of 'consolidation', you want to find a setting that doesn't flip back and forth too often. Between the DI+ and DI- is a blue centerline. Offset from this centerline is a channel that is used to filter out false crosses of the DI+ and DI-. Sometimes, the DI+ and DI- lines will come together in this channel and cross momentarily before resuming the direction prior to the cross. When this happens, you don't want to flip your bias too soon. The wider the channel, the later the indicator will signal a DI reversal. A narrower channel will call it sooner but risks being more choppy and indicating a false cross.
Indicator Status Line
This indicator has 4 values in the status line (in order):
DI+
DI-
Distance between DI+ and DI-
DI Rate of Change ( how quickly are DI+ and DI- moving away or towards center )
Indicator Plots
This indicator plots DI+ (green), DI- (red), and a center channel between DI- and DI+. Across the top of the indicator, red and green triangles indicate the market trend while the background changes to show whether the price is in an impulse wave or consolidating. This makes up 4 possible scenarios:
Bullish impulse wave ( green triangle up + green background )
Bullish consolidation ( green triangle up + yellow background )
Bearish impulse wave ( red triangle down + red background )
Bearish consolidation ( red triangle down + yellow background )
Summary
Combined with support and resistance levels, volume, and your other favorite indicators, this can be a useful tool for validating that your entries are not going against the trend.
Disclaimer
This is not financial advice. Do not take trades only based on the DI+ and DI- crossing. Always use multiple indicators to validate your entries and never take a trade when you aren’t emotionally grounded. Have a plan. Stick to the plan.
The screenshot for this strategy is of a manual historical review of BTC on the 3 day chart. The indicator was built to try and mimic the chart above. You’ll see that it nails it sometimes, is a little late sometimes, and chops around between consolidation and impulse waves when it should stay in consolidation. Share your settings if you are able to improve the choppiness without sacrificing catching the reversals early.

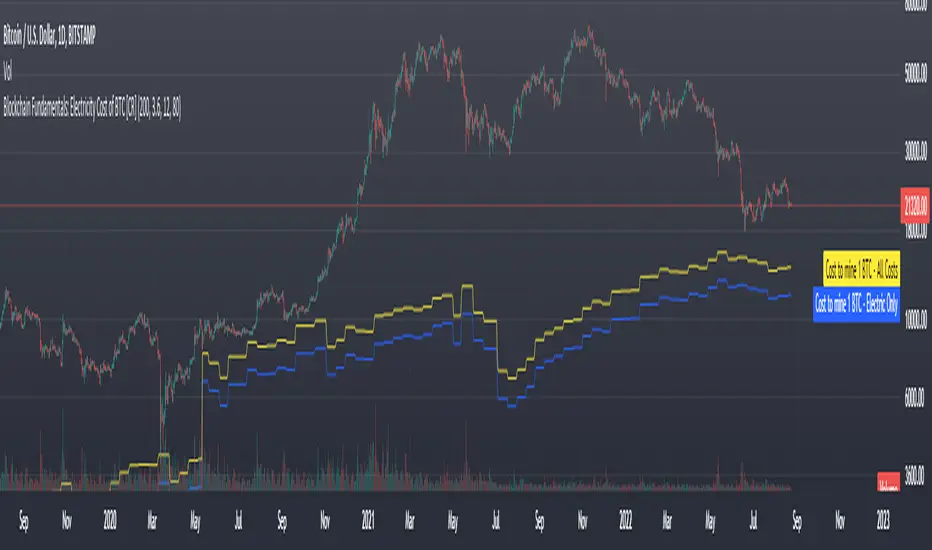
Blockchain Fundamentals: Electricity Cost of BTC [CR] Blockchain Fundamentals: Electricity Cost of BTC
After a hiatus, now a return to publishing tools and scripts for the community. This is my first script in over and year, and I have a number more coming soon as well! (so Stay Tuned!)
This is a simple calculator to estimate the cost of Bitcoin miners to mine one bitcoin. It works on all timeframes (doesnt have to be on daily).
By entering the inputs of total TH's, kWh used, cost of electricity per kWh (in USD cents) we can generate the electricity cost.
But miners also have other costs of operation including HVAC, maintenance, rent, etc. In light of that we include a multiplier that accounts for these extra costs. First, type in what percent of your total operating costs come from the electricity. Then check the enable total cost plot option and you will also see total costs in addition to electricity costs.
Its a simple model and gives anyone curious a starting point for their own testing and research.
ln(close/20 sma) adjusted for time (BTC)(This indicator was designed for the BTC index chart)
Designed for Bitcoin. Plots the log of the close/20W SMA with a linear offset m*t, where m is the gradient I've chosen and t is the candle index. Anything above 1 is a mania phase/market cycle top. If it peaks around 0.92 and rolls over, it could be a local/market cycle top.
This will obviously not work at all in the long term as Bitcoin will not continue following the trend line on the log plot (you can even see it start to deviate in the Jan-Feb 2021 peaks where the indicator went to 1.15).
It identifies the 2011, 2013 (both of them), 2017 tops as being just above 1. It also identifies the 2019 local peak and 2021 market cycle top at ~0.94.
Feel free to change the gradient or even add a function to curve the straight line eventually. I made this for fun, feel free to use it as you wish.

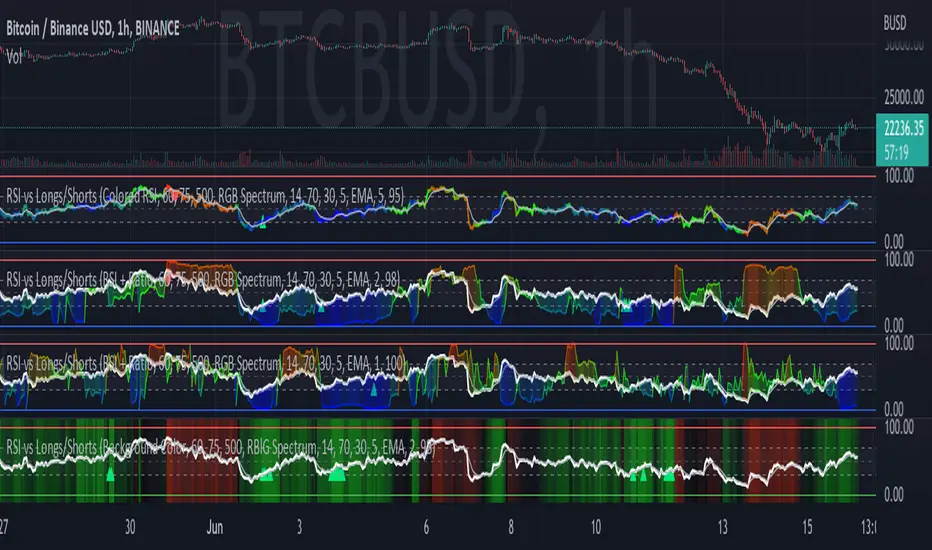
RSI vs BITFINEX BTC Longs/Shorts Margin Ratio Percentage RankThis indicator plots the RSI of the current token with a color based on percentage rank of the RSI of BITFINEX:BTCUSDLONGS divided by BITFINEX:BTCUSDSHORTS, with a plot of the moving average of the RSI. It can optionally plot the RSI in white and the ratio RSI in color, or the ratio as background color. It can also plot the raw ratio rather than the percentage rank if selected.
I was interested in the ratio of BITFINEX:BTCUSDLONGS to BITFINEX:BTCUSDSHORTS as a measure of market sentiment and how that sentiment would magnify RSI changes. The volatility of the BTCUSDLONGS : BTCUSDSHORTS ratio was too low to get a good read, using a percent rank of the RSI of the ratio made the results more visible.
This indicator should be used on a BTC chart.
Scalping Support Resistance StrategyScalping strategy for BTC using one line: Support Resistance.
The strategy draws a line based on the minimum value of the average of High, Low, and Close for a given bar. The entries are carried out on the breakdown of this line. Exits are managed by the specified in the script's inputs take-profit and stop-loss percentages.
From Stream:
www.tradingview.com

Volatility Calculator for Daily Top and Bottom RangeWith the usage of ATR, applied on the close of the daily candle, I am calculated the volatility channels for the TOP and BOTTOM
Based on this logic, we can estimate, with a huge confidence factor, where the prices are going to be compressed for the trading day.
Having said that, lets take a look at the data gathered among the most important financial markets:
SPX
TOP CROSSES : 2116
BOT CROSSES : 1954
Total Daily Candles : 18908
Occurance ratio = 0.215
NDX
TOP CROSSES : 1212
BOT CROSSES : 1183
Total Daily Candles : 9386
Occurance ratio = 0.255
DIA
TOP CROSSES : 759
BOT CROSSES : 769
Total Daily Candles : 6109
Occurance ratio = 0.25
DXY
TOP CROSSES : 1597
BOT CROSSES : 1598
Total Daily Candles : 13156
Occurance ratio = 0.243
DAX
TOP CROSSES : 1878
BOT CROSSES : 1848
Total Daily Candles : 13155
Occurance ratio = 0.283
BTC USD
TOP CROSSES : 416
BOT CROSSES : 417
Total Daily Candles : 4290
Occurance ratio = 0.194
ETH USD
TOP CROSSES : 247
BOT CROSSES : 268
Total Daily Candles : 2452
Occurance ratio = 0.21
EUR USD
TOP CROSSES : 820
BOT CROSSES : 805
Total Daily Candles : 7489
Occurance ratio = 0.217
GOLD
TOP CROSSES : 1722
BOT CROSSES : 1569
Total Daily Candles : 13747
Occurance ratio = 0.239
USOIL
TOP CROSSES : 1077
BOT CROSSES : 1089
Total Daily Candles : 10231
Occurance ratio = 0.212
US 10Y
TOP CROSSES : 1302
BOT CROSSES : 1365
Total Daily Candles : 9075
Occurance ratio = 0.294
Based on this, we can assume with a very high confidence ( 70-80%) that the market is going to stay, within the range created from the BOT and TOP ATR points.

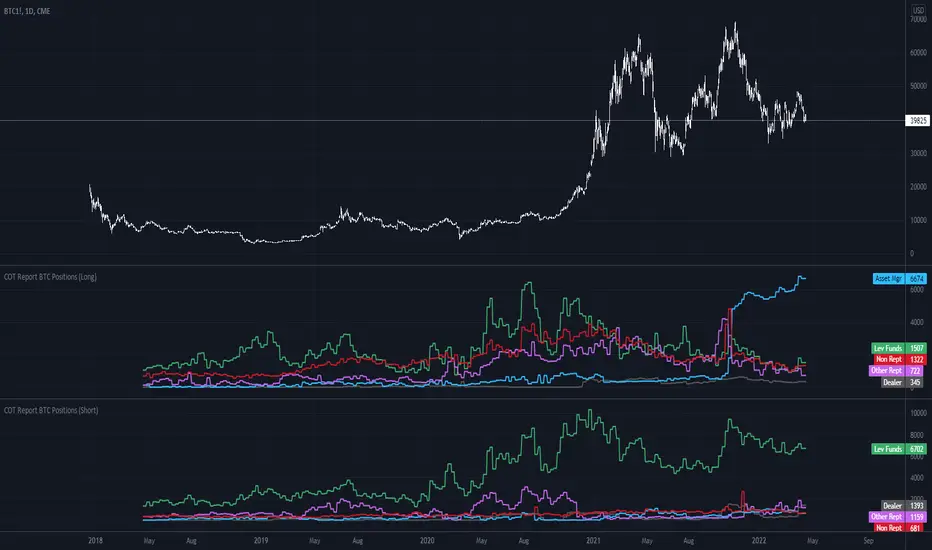
COT Report BTC Positions█ OVERVIEW
Showing the Commitments of Traders (COT) report(*) for BITCOIN Positions - CHICAGO MERCANTILE EXCHANGE (futures only) with COT charts on TradingView data.
* COT reports are released each Friday (except for U.S. holidays) by the CFTC.
* Each COT report release includes data from the previous Tuesday.
* Original data is www.cftc.gov
Data currently displayed are through April 12, 2022
█ FEATURES
You can switch the display for each of the following Positions :
Long
Short
You can switch the display for each of the following Categories :
Dealer
Asset manager
Leverage funds
Other reportable
Non reportable
█ HOW TO USE IT
This indicator allows you to see changes for each category within TradingView without having to refer directly to each report.
Aggregated Volume Based Coloured Bars - InFinitoModified version of Kivanc's Volume Based Colored Bars that colors the bars with Aggregated Volume Data.
Aggregation code originally from Crypt0rus
***The indicator can be used for any coin/symbol to aggregate volume , but it has to be set up manually***
***The indicator can be used with specific symbol data only by disabling the aggregation option, which allows for it to be used on any symbol***
- Calculated based on Aggregated Volume instead of by symbol volume . Using aggregated data makes it more accurate and allows to see if the move was supported (Volume-wise) in all exchanges.
- As well, in order to make the data as accurate as possible, the data from each exchange aggregated is normalized to report always in terms of 1 BTC . In case this indicator is used for another symbol, the calculations can be adjusted manually to make it always report data in terms of 1 contract/coin.

Saturday Strategy BTC By KziI take the hypothèse that saturday is the most stable day of the week because, no SP500, no fed announcement and no weekly closure.
My Strategy is very simple:
Take the friday color (Red = Short // Green = Long)
Then open at the friday close price
Take a small pourcentage (1 or 2 %) then close.
What ever close on midnight.
Work Well on the 1h chart.
The Yellow is the saturday.
Maybe we can add the monthly close information to avoid opening trade on saturday if we are at this event.
Enjoy and give me your comment.
Kzi

Volatility Stats compared to BTCMeasuring ADR we can find the difference between the daily range of BTC and the daily range of altcoins in order to find something more volatile (in percentage terms) to trade.
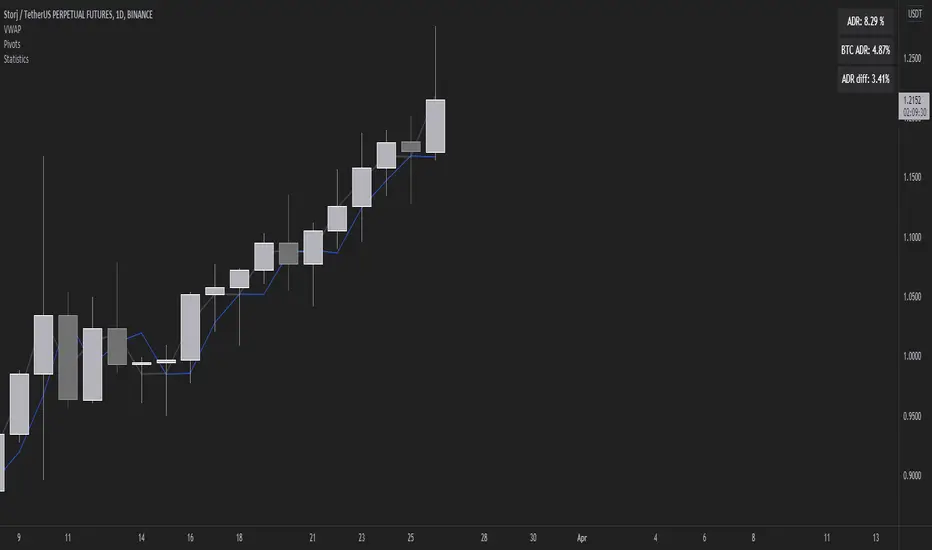
Lankou VS BTC all
/!\ To make it work well use -> pin at new right scale
This script displays the comparison with BTCUSDT
it permits to see if an asset is gaining value against BTC, and fastly scan USDT asset to determine if they are bullish
It works for ANY asset, as it's dividing it's price by the BTCUSDT one

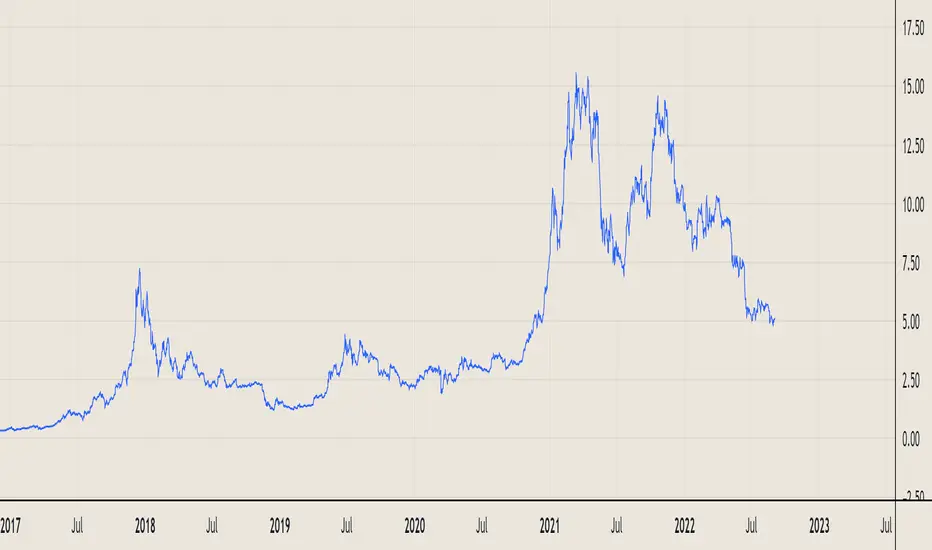
Premium on BTC in Russia (%)
Indicator shows the relative "premium" or "discount" of buying BTC with Ruble vs the USD on Binance.
Figures are shown in %.
Positive figures indicate a "premium" vs USD, negative indicates a "discount".
Indicator is calculated on the close of the 4h candles of each input.

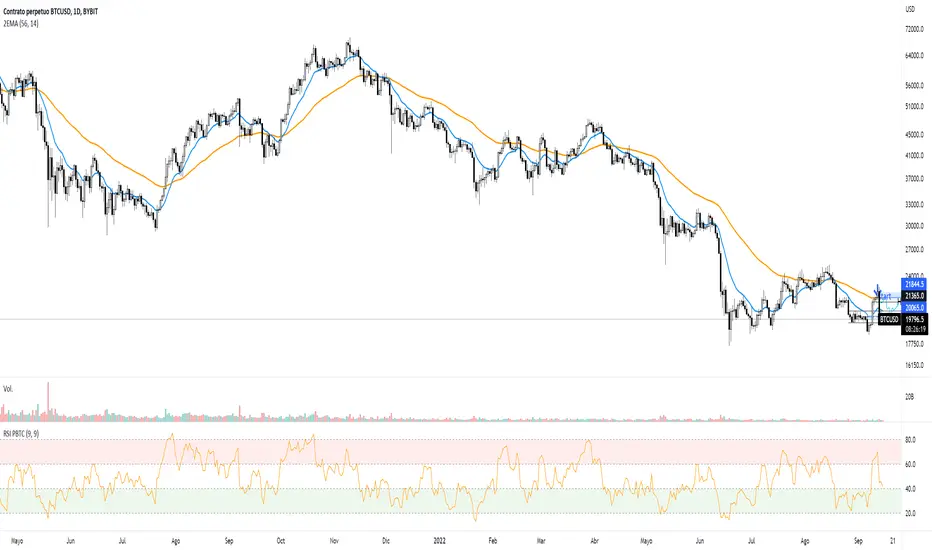
INVEST BTC RSI (from @tradinglord)RSI VERSION - no alerts
The script highlight point of interest for investors using EMA , RSI and a bit of criticism.
The script is built to be used on a weekly timeframe
When RSI is bellow 35 it can be interesting to invest in BTC , on the opposite when it is above 80 can be where to take a bit of profits.
Also using EMA to flow with the power of the trend or change your bias depending on conditions.
Feel free to use the included alerts to be informed when RSI is telling you something.
The idea is quite simple, and you will not gain x100 your investment, but with these kind of investments and some patience you could make your way out.
Obviously not financial advice, understand what you are doing.
"Sometimes it's better to be rational monkey than a greedy baboon" - Tradinglord 2022
