BEST Mayer MultipleHello traders
I'm not a HODLer by any means. I know when to sell (or I think I know....) when an asset starts going against me too much.
Even if it's a "long-term" investment.
My mentor used to telling me this: "If a short-term trade becomes a long-term investment, then you're in for a hell of a ride".
I have no clue if Bitcoin/BTC will go back up or not - I don't even care because I'm an intraday trader.
What if BTC was actually a way to accumulate more fiat? Satoshi fooled us
I coded this Mayer Multiple according to the specifications below. By the way, I'm a big fan of Willy Woo. I've been monitoring all his work since I learned about crypto (10 minutes ago.... it's a joke come on)
charts.woobull.com
Scaling
To respect the Mayer's multiple model, I recommend to select the Logarithmic scaling as shown below
imgur.com
What Mayer's model says
Using the reference below, the model says we're in the oversold zone. But, we can be in that zone for months/years...
When a model says an asset could bounce in a 1000-7000 USD range... well... I don't know how I would be able to perform optimally with that insight. This is very subjective and not a recommendation.
Mayer's Multiple model reference
All the BEST
Dave
ค้นหาในสคริปต์สำหรับ "btc期权交割时间"

Crypto Multi Exchange Volume (CMEV)Crypto Multi Exchange Volume (CMEV) aggregates and plots trading volumes for supported cryptoasset pairs over multiple different cryptoasset exchanges. For developers looking for more information and for those who want to compile their own version of CMEV, please check out my GitHub (jakobpredin/crypto-multi-exchange-volume).
Configuration
CMEV comes with two configurable settings - whether base volume or quote volume is plotted and the length of the volume's EMA. By default, the base volume is used for plotting and the length of the EMA is set to 12 periods.
Use cases
The indicator was primarily developed in order to be able to chart using the trading pair with the longest available trading history. Due to the fast-changing preferences of where cryptoassets are traded, volumes tend to be very inconsistent and can give a distorted picture of a pairs history. For illustration, check out the SC-BTC pair from Poloniex using their native volume and compare it to the CMEV volume.
The other use case is to be able to spot divergences in volume. A great example here is bitcoin's 2019 rally where volumes from derivatives exchanges are at all time highs but volumes from retail/spot exchanges are not.
Supported exchanges
CMEV currently supports asset pairs from the following exchanges:
Binance
Bitfinex
Bitstamp
Bittrex
Coinbase
Gemini
Kraken
Poloniex
Limitations
Because of the fact that CMEV is pulling data from from multiple different exchanges and is computationally intensive it can take a couple of seconds to load while charting certain cryptoasset pairs.
Additionally, due to Tradingview's various limitations only a certain number of pairs can be supported at a time. By default, only pairs with a BTC or USD quote are supported and many non-unique pairs with consistently low trading volumes have been removed. For a full explanation, please refer to the docs in my GitHub (jakobpredin/crypto-multi-exchange-volume).
Future of the project
I plan on supporting pairs from more exchanges in the future as I see fit and as they become available for charting on Tradingview. Further, I may develop a strategy script using CMEV as its core indicator.
I welcome everybody from the community to help me extend the functionality of CMEV in order to make investing in cryptoassets more transparent for everybody.


Yope BTC virus channelThis is a new version of the BTC tops channel, combined with a fitted curve of the function described in Cane Island Crypto's paper "Bitcoin Spreads Like a Virus" by Timothy Peterson (pink curve).
The big question is: Where will BTC price go from here? will it follow either of both curves? Which one?
The blue channel is nothing more than a curve function that seems to "fit well" the historical prive of bitcoin, while the pink curve actually has some pretty solid theory behind it ;)
NOTE: This script only works with the BLX ticker and on the 1W, 3D and 1D time-frames!
Feedback and comments welcome.

Trade LightswitchThis script is a follow-up to the following script:
An analysis shows that when BTC relative monthly volume change of retail is greater than non-retail, non-ideal conditions exist to trade (i.e. do not trade). When the default background color is gray, stay out.

Trend is your friendThis indicator evaluates the trend based on crosses of two McGinley moving averages. It paints candles accordingly (it does not repaint), so you can see what the indicator is saying more clearly and stay in your trade until you see a period of consolidation or a reversal. You can control how far away those moving averages need to be for you to consider it a trend. If this distance is not met candles color is not changed and it shows you that the market is in a period of consolidation. I also added visualization of RSI, so you can have an easier time finding appropriate profit targets. For stop loss I would recommend placing it a couple points above or below the previous high / low that is located above / below you final target for entry. You can also use a certain percentage that works for you. I tried adding a stop loss based on ATR, but I did not like the results. Using market structure is a better choice in my opinion.
Here is a basic trading strategy for the default settings:
Wait for the indicator to start printing a series of green or red candles. After that you can enter a long or a short around moving averages. Another valid place to entry is the specific RSI zone. If we are in an uptrend buying when RSI is oversold can be beneficial as you expect market to recover. I do not recommend changing RSI from 14. Vice versa for the downtrend. It gives you an edge as you know at what price RSI will be oversold and allows you to place trades in advance. Pretty neat! You need to realize that no indicator or strategy can give you an exact entry. There will always be some margin of error. What I wanted to say is that if there is a strong trend up and you buy around your key moving averages and when RSI is oversold you entered in good places and there is a pretty good chance you will make money.
Time frame settings:
If you want to use tighter stop losses I would recommend sticking to 15m. Do not go lower. It is not worth the stress. 1h and 4h seems to be very good as well, but expect your stop losses to be wider. What I personally tend to do is display 15m, 30m and 1h and compare it. Think of it as a short, mid and long term. That way you can see things little bit better.
Examples:
1H chart BTC
4h chart EUR / USD
1D chart NASDAQ
15m chart BTC (Daytrading)
That last chart shows that even if you were longing while the trend was about to change you still had a good chance to close it with a little profit and switch to short easily. The default settings is what has worked the best for me. Feel free to change them as you see fit and do not forget to let me know if you find something that works better :)
Notes:
Either disable wick display or change it to a neutral color like gray for both green and red candles. Unfortunately pine script does not allow wick painting, so if you have red / green wicks it will look terrible. If RSI visualization makes your candles look too small you can go to settings and disable the display of individual RSI levels. You will still be able to see the zones, but the scale won't be affected.

RSI+STOCHRSI StrategyRSI + STOCHASTIC RSI combination . It is useful for 5 min charts .
Profitable in EOS/BTC and BTC/USDT , don't apply all cryptocurrency.

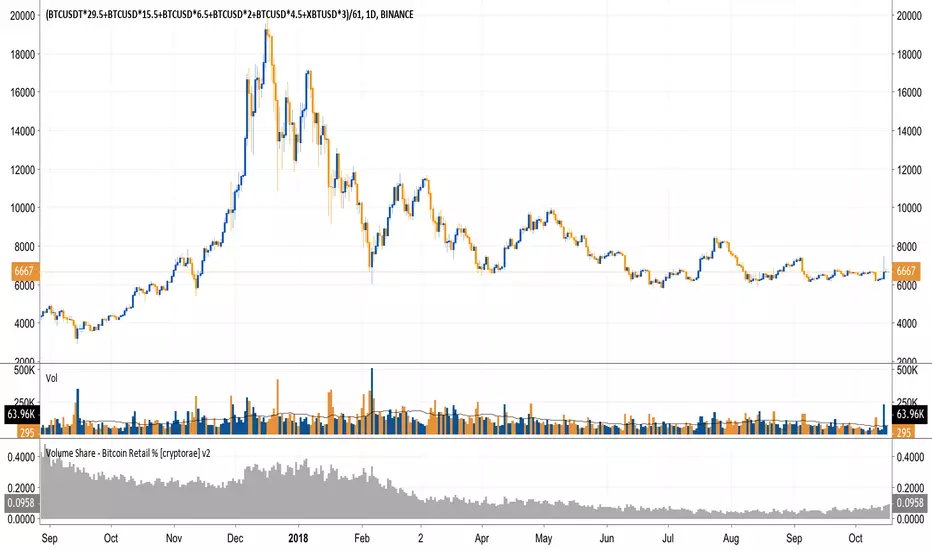
Volume Share - Bitcoin Retail % [cryptorae]I've been keeping my eyes on retail BTC trading volume as a % of total BTC trading volume (charted).
It's the single best chart showing the death of sentiment in this bear market. Retail fell to as low as 5.6% on 6/8. The good news is that the % has stabilized at these levels.
I think retail interest will need to trend higher in tandem with higher price moves for us to break through key resistance levels.
To know why, let's look closer at the anatomy of the recent bull and bear market.
In the 2017 bull market:
- Retail interest trended higher or sideways with each drive up
- Average retail volume share was ~46%
In other words, price movements were dominated by infusions of new money.
In the 2018 bear market:
- Retail interest trended LOWER with each recovery in price
- Average retail volume share was ~15%
In other words, price movements were dominated by money exchanging through the hands of traders.
Open thoughts:
- If the bear market persists and prices reach critical levels, I think that retail % would spike as some finally rush for the exit and new investors happily jump in
- If prices recover w/o a sustained increase in retail %, I'd not be so quick to call a bull market
Things I classify as "retail":
- Bitflyer
- Bithumb
- Coinbase
- Bistamp
- Kraken
Things classified as "non-retail"
- Bitmex
- Bitfinex
The formula is retail / (retail + non-retail)
The script is open for you to modify if you disagree. Let me know your thoughts/tweaks.
Crypto Market Change in BTC [Fingers]Crypto Market Change provides an indication of whether the value of a basket of 19 coins traded in BTC on Binance (as of July 12, 2018) are headed up or down. A simple moving average of the percentage change in BTC price for each coin is calculated. The moving averages are then summed and displayed. A measure of price volatility is indicated by standard deviation bands. Period, moving average length, and number of standard deviations are adjustable.

Crypto Market Change in BTC [Fingers]Crypto Market Change provides an indication of whether the value of a basket of 19 coins traded in BTC on Binance (as of July 12, 2018) are headed up or down. A simple moving average of the percentage change in BTC price for each coin is calculated. The moving averages are then summed and displayed. A measure of price volatility of indicated by standard deviation bands. Period, moving average length, and number of standard deviations are adjustable.

40 DOMINANT ALTCOINS BINANCEThis indicator is a combination of 40 different altcoins which are found on Binance exchange.
I have listed all Binance altcoins in the order of the oldest listed and the newest.
Due to limitations on TV for calling only 40 securities at the same time, I have limited myself with adding only the oldest ones (9+ months) and some 8+ to make up at least 40 for more data.
I have excluded BTC, BCC, ETH, USDT, BNB from list as these are the trading pairs.
I have some updates in mind and will try to add more options in coming months
Regularly updating 40 altcoins list by sorting them by market cap and available historical data from Binance
Adding Bitfinex, Bittrex and other exchanges separetly, as there is only 40 security call limit
Adding ETH; USDT pairs for all above exchanges.
You can add any indicator to this indicator - such as MACD, RSI, EMA and so on to help you analyse it more deeper
When you load this indicator, it takes about 1 min wait as it takes and calculates a lot of data. After it is loaded, it works perfectly.
Currently there is only 40 oldest altcoins to gather enough data, but as time passes, I will change some of them to create better picture of alt coins.
Please report any problems and give feedback.
Any idea of improvement is welcome and I will try my best.
Please support me an consider to give a small tip to addresses bellow. It would greatly help me to free more time for improvements as I am working to support family and my time is limited for markets.
ETH: 0xac290B4A721f5ef75b0971F1102e01E1942A4578
BTC: 39p3rKuJYKGqph1Qs35yEfNWoPvpUJBBcy
This will greatly help me to keep update this indicator and give me more time to analyse and sort out all altcoins my their market cap, volume and influence.

Mayer Multiple v2.0 - Klahr ThresholdThis is a simple update to the Mayer Multiple script by Unbound , which charts an indicator created by Trace Mayer and popularized by Preston Pysh.
The original post identified any price below 2.4x the 100-day MA as the BTC buy threshold. While the logic there is historically sound, it does not account for the fact that the BTC trend is parabolic in nature. With that in mind, I've attempted to update the 2.4x multiple to react based on the moving average of the Mayer Multiple itself. To do so, I simply found the number that, when added to the MM moving average, historically hit the 2.4x multiple during periods of low volatility. This turns out to be 1.17.
The green line represents the Klahr Threshold (is it obnoxious if I call it that? I've always wanted an indicator named after me). As you can see from the above chart, it hovers around 2.4x in late 2012 to early 2013, rises above it until mid 2014, and then stays below until 2016. It then stays almost exactly at 2.4x until April 2017, when it rises significantly above it for the first time since July 2014. The convergence in late 2012 and 2016-2017 is what leads me to believe that this should be the basis for the updated threshold.
It's entirely possible that there's a more robust method of calculating a reactive threshold (or a different number that should be added to the multiple's MA), but I think this is a good first step in refining the multiple to withstand the test of time.

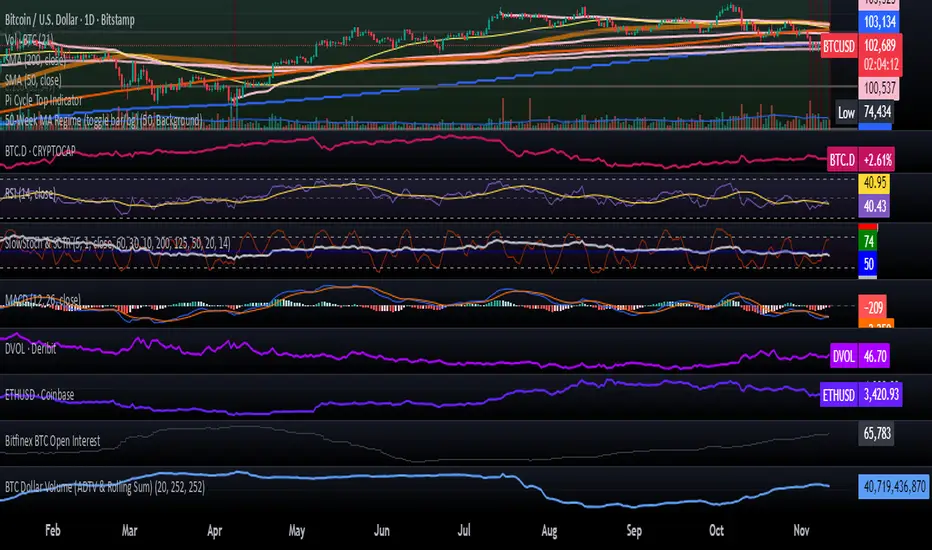
Bitcoin 50-Week MA “Cycle Line” — Bull/Bear RegimeOverview. This indicator plots the true 50-week simple moving average (SMA) on any timeframe by requesting weekly data, then colors the chart to show a bull/bear regime: green when price is above the 50-week MA, red when below. Many Bitcoin analysts treat this average as a cycle “line in the sand”—multiple weekly closes below it have historically coincided with the end of bull phases and the start of broader drawdowns, while holding above has aligned with continued strength.
Why it matters. Recently, research notes and market commentary have flagged the 50-week MA near ~$100k–$103k (feed-dependent) as a critical support/resistance area to watch. Use this tool to track that threshold on your own exchange feed and timeframe.
How it works.
Pulls weekly closes via request.security() and computes a 50-week SMA (not an EMA).
Plots the line on your current chart and applies a regime color (background or candles, toggle in settings).
Works on any symbol; optimized for BTC spot and futures.
Notes.
MA values vary by data source/exchange; confirm on a weekly chart if needed.
A single intrawEEK break can whipsaw; many analysts look for confirmed weekly closes. Pair with your macro/liquidity view and risk rules.
EMA 50/200 Pullback + RSI (BTC/USDT 15m - 2 Bar Logic)EMA 50/200 Pullback + RSI (BTC/USDT 15m - 2 Bar Logic)

Stablecoin to BTC Market Cap RatioThis indicator calculates the ratio of the combined market capitalization of USDT and USDC stablecoins to the market capitalization of BTC. Data is updated daily from TradingView's CRYPTOCAP sources. It is displayed as a line in a separate panel, allowing analysis of stablecoin liquidity dynamics relative to BTC.
How to Use
Add the indicator to any asset chart in TradingView. It is useful for assessing the potential buying power of stablecoins in the cryptocurrency market. High ratio values may signal accumulation of liquidity in stablecoins, often preceding growth in BTC or altcoins (bullish signal). Low values indicate a decrease in the role of stablecoins, which may be bearish. It is recommended to combine with other indicators, such as RSI or volumes, to confirm trends.

Power Law BTC IndicatorPOWER LAW BTC indicator:
A long-term price model that suggests Bitcoin's price follows a power law function over time. Unlike traditional stock market models that assume linear or exponential growth, the power law model suggests that Bitcoin's price scales in a predictable, non-random way over the long run

Bitcoin ETF Cumulative Net InflowIndicator Description:
This indicator calculates and plots the cumulative net inflow (in billions of USD) for selected Bitcoin ETFs on the main price chart. It uses AUM data from TradingView to estimate daily net flows, adjusted for BTC price changes, and accumulates them over time. The line is overlaid on the price chart (e.g., BTCUSD) with a right scale for better visibility, helping to identify correlations between ETF inflows and Bitcoin price movements.
Key Features:
Supports selection of 10 major Bitcoin ETFs (IBIT, FBTC, ARKB, etc.) via inputs.
Cumulative inflow line (purple, linewidth=2) for trend analysis.
Data sourced from request.financial("AUM", "D") for accuracy.

Hyper SAR Reactor Trend StrategyHyperSAR Reactor Adaptive PSAR Strategy
Summary
Adaptive Parabolic SAR strategy for liquid stocks, ETFs, futures, and crypto across intraday to daily timeframes. It acts only when an adaptive trail flips and confirmation gates agree. Originality comes from a logistic boost of the SAR acceleration using drift versus ATR, plus ATR hysteresis, inertia on the trail, and a bear-only gate for shorts. Add to a clean chart and run on bar close for conservative alerts.
Scope and intent
• Markets: large cap equities and ETFs, index futures, major FX, liquid crypto
• Timeframes: one minute to daily
• Default demo: BTC on 60 minute
• Purpose: faster yet calmer PSAR that resists chop and improves short discipline
• Limits: this is a strategy that places simulated orders on standard candles
Originality and usefulness
• Novel fusion: PSAR AF is boosted by a logistic function of normalized drift, trail is monotone with inertia, entries use ATR buffers and optional cooldown, shorts are allowed only in a bear bias
• Addresses false flips in low volatility and weak downtrends
• All controls are exposed in Inputs for testability
• Yardstick: ATR normalizes drift so settings port across symbols
• Open source. No links. No solicitation
Method overview
Components
• Adaptive AF: base step plus boost factor times logistic strength
• Trail inertia: one sided blend that keeps the SAR monotone
• Flip hysteresis: price must clear SAR by a buffer times ATR
• Volatility gate: ATR over its mean must exceed a ratio
• Bear bias for shorts: price below EMA of length 91 with negative slope window 54
• Cooldown bars optional after any entry
• Visual SAR smoothing is cosmetic and does not drive orders
Fusion rule
Entry requires the internal flip plus all enabled gates. No weighted scores.
Signal rule
• Long when trend flips up and close is above SAR plus buffer times ATR and gates pass
• Short when trend flips down and close is below SAR minus buffer times ATR and gates pass
• Exit uses SAR as stop and optional ATR take profit per side
Inputs with guidance
Reactor Engine
• Start AF 0.02. Lower slows new trends. Higher reacts quicker
• Max AF 1. Typical 0.2 to 1. Caps acceleration
• Base step 0.04. Typical 0.01 to 0.08. Raises speed in trends
• Strength window 18. Typical 10 to 40. Drift estimation window
• ATR length 16. Typical 10 to 30. Volatility unit
• Strength gain 4.5. Typical 2 to 6. Steepness of logistic
• Strength center 0.45. Typical 0.3 to 0.8. Midpoint of logistic
• Boost factor 0.03. Typical 0.01 to 0.08. Adds to step when strength rises
• AF smoothing 0.50. Typical 0.2 to 0.7. Adds inertia to AF growth
• Trail smoothing 0.35. Typical 0.15 to 0.45. Adds inertia to the trail
• Allow Long, Allow Short toggles
Trade Filters
• Flip confirm buffer ATR 0.50. Typical 0.2 to 0.8. Raise to cut flips
• Cooldown bars after entry 0. Typical 0 to 8. Blocks re entry for N bars
• Vol gate length 30 and Vol gate ratio 1. Raise ratio to trade only in active regimes
• Gate shorts by bear regime ON. Bear bias window 54 and Bias MA length 91 tune strictness
Risk
• TP long ATR 1.0. Set to zero to disable
• TP short ATR 0.0. Set to 0.8 to 1.2 for quicker shorts
Usage recipes
Intraday trend focus
Confirm buffer 0.35 to 0.5. Cooldown 2 to 4. Vol gate ratio 1.1. Shorts gated by bear regime.
Intraday mean reversion focus
Confirm buffer 0.6 to 0.8. Cooldown 4 to 6. Lower boost factor. Leave shorts gated.
Swing continuation
Strength window 24 to 34. ATR length 20 to 30. Confirm buffer 0.4 to 0.6. Use daily or four hour charts.
Properties visible in this publication
Initial capital 10000. Base currency USD. Order size Percent of equity 3. Pyramiding 0. Commission 0.05 percent. Slippage 5 ticks. Process orders on close OFF. Bar magnifier OFF. Recalculate after order filled OFF. Calc on every tick OFF. No security calls.
Realism and responsible publication
No performance claims. Past results never guarantee future outcomes. Shapes can move while a bar forms and settle on close. Strategies execute only on standard candles.
Honest limitations and failure modes
High impact events and thin books can void assumptions. Gap heavy symbols may prefer longer ATR. Very quiet regimes can reduce contrast and invite false flips.
Open source reuse and credits
Public domain building blocks used: PSAR concept and ATR. Implementation and fusion are original. No borrowed code from other authors.
Strategy notice
Orders are simulated on standard candles. No lookahead.
Entries and exits
Long: flip up plus ATR buffer and all gates true
Short: flip down plus ATR buffer and gates true with bear bias when enabled
Exit: SAR stop per side, optional ATR take profit, optional cooldown after entry
Tie handling: stop first if both stop and target could fill in one bar

sHip Crypto Buy/Sell Pro BTC 15minThis is a 15min BTC buy sell indicator that is made by Ai. Have not tested yet but you can give it a go if you want.

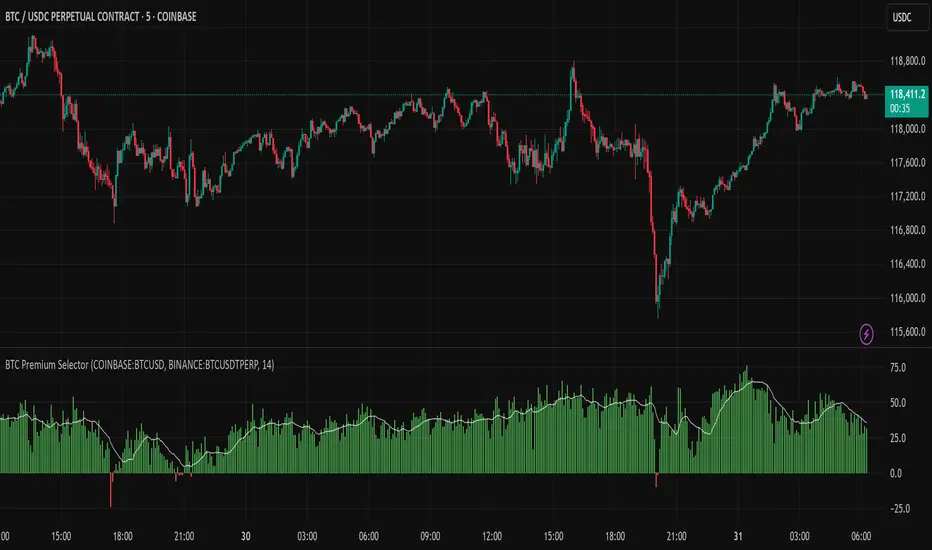
Multi CEX BTC Spot vs Perpetual PremiumThis Indicator shows the BTC Spot vs Perpetual premium across different CEX.
BTC_News_2025Library "BTC_News_2025"
This library contains the tooltips used in the script "Bitcoin History Events (BTC Story)"
V1 News from January to May
tt_020125()
tt_070125()
tt_200125()
tt_270125()
tt_300125()
tt_030225()
tt_260225()
tt_240225()
tt_020325()
tt_030325()
tt_090325()
tt_110325()
tt_190325()
tt_280325()
tt_310325()
tt_020425()
tt_060425()
tt_090425()
tt_150425()
tt_190425()
tt_220425()
tt_050525()
tt_080525()
tt_130525()
tt_200525()
tt_220525()
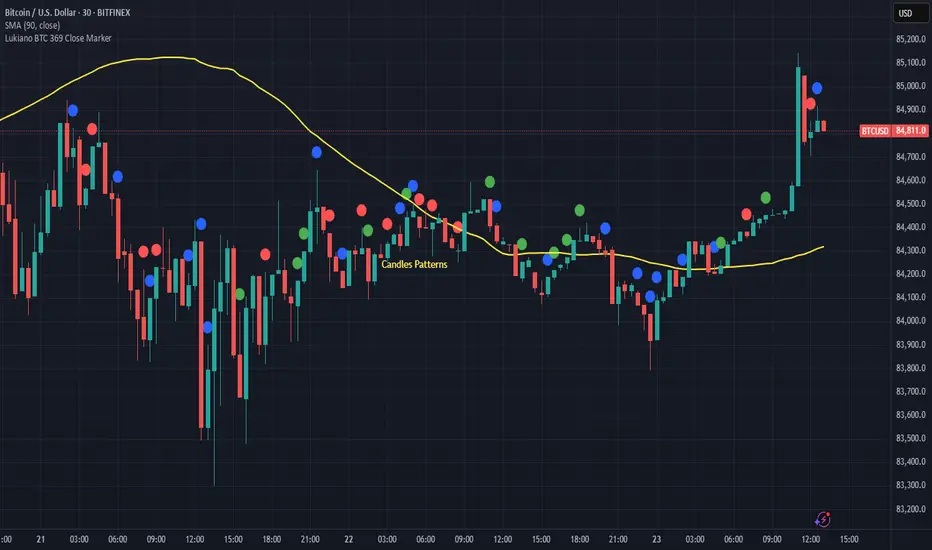
Lukiano BTC 369 Close MarkerThis indicator highlights candles where the closing price reduces to 3, 6, or 9 based on digital root calculation (sum of digits).
🔵 Blue dot = 3
🟢 Green dot = 6
🔴 Red dot = 9
Inspired by Tesla’s 369 theory and adapted for BTC traders who want to explore alternative energy-based signals.
Created by @Lukiano