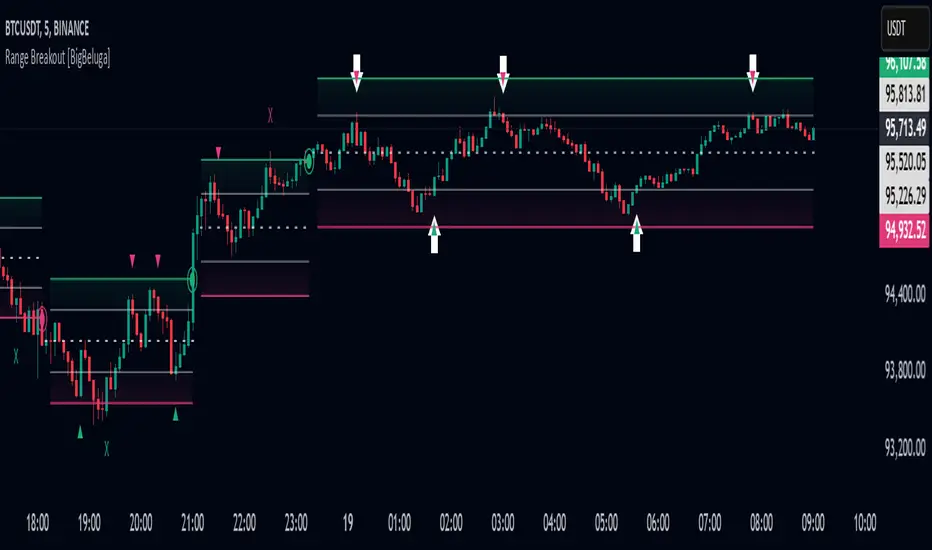
Range Breakout [BigBeluga]Range Breakout is a dynamic channel-based indicator designed to identify breakout opportunities and price reactions within defined ranges. It automatically creates upper and lower bands with a midline, helping traders spot breakout zones, retests, and potential fakeouts.
🔵 Key Features:
Dynamic Channel Formation:
Automatically plots upper and lower channel bands with a midline based on ATR calculations.
Channels adjust upon breakout events or after a predefined number of bars to reflect new price ranges.
Breakout Detection:
Green circles appear when price breaks above the upper channel edge.
Red circles appear when price breaks below the lower channel edge.
A new channel is formed after each breakout, allowing traders to monitor evolving price ranges.
Retest Signals:
Upward-pointing green triangles signal a retest of the lower band, indicating potential support.
Downward-pointing red triangles indicate a retest of the upper band, suggesting possible resistance.
Filter Signals by Trends (New Feature):
Optional toggle to filter ▲ and ▼ signals based on channel breakout conditions.
When enabled:
In a bullish channel (confirmed by a green circle breakout), only ▲ signals are displayed.
In a bearish channel (confirmed by a red circle breakout), only ▼ signals are displayed.
Helps traders align retest signals with the prevailing trend for higher-quality trade setups.
Fakeout Identification:
'X' symbols appear when price breaks the upper or lower edge of the channel and quickly returns back inside.
Helps traders identify and avoid false breakouts.
🔵 Usage:
Breakout Trading: Use the green and red circle signals to identify potential breakout trades.
Retest Confirmation: Look for triangle markers to confirm retests of key levels, aiding in entry or exit decisions.
Fakeout Alerts: Utilize the 'X' signals to spot and avoid potential trap moves.
Dynamic Range Monitoring: Stay aware of changing market conditions with automatically updating channels.
Range Breakout is an essential tool for traders seeking to capitalize on range breakouts, retests, and fakeout scenarios. Its dynamic channels and clear visual signals provide a comprehensive view of market structure and potential trade setups.
ค้นหาในสคริปต์สำหรับ "breakout"
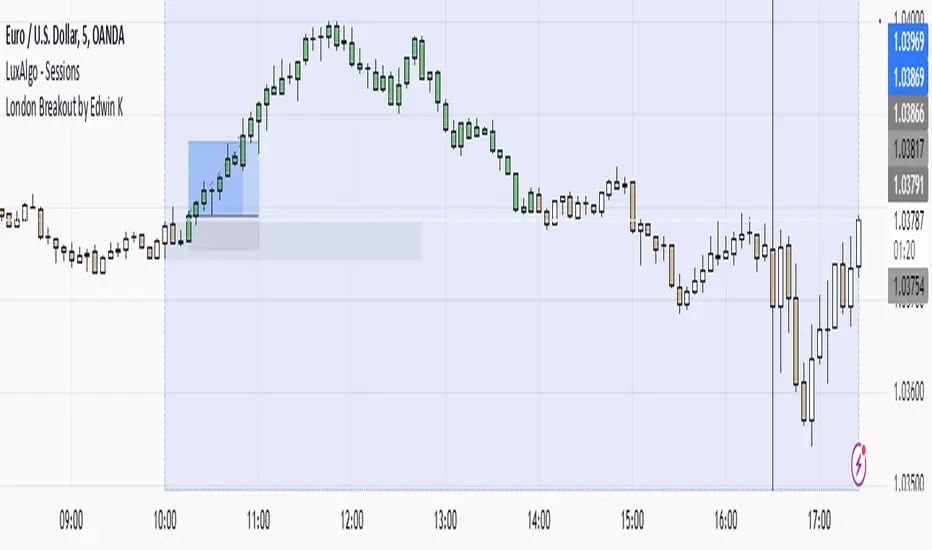
London Breakout by Edwin KPurpose:
The strategy visualizes breakouts based on price action during the London session. It highlights the candles from 09:59 AM to 01:59 PM UTC+3 with different colors depending on whether the price is above or below the high/low from the 10 AM candle.
Key Parts:
Timestamps:
The code defines specific times for the 09:59 AM candle, 10:00 AM candle, and 01:59 PM UTC+3 times.
The timestamp('UTC+3', ...) function creates the timestamps for those moments.
High and Low of the 10 AM Candle:
The high and low of the 10 AM candle are captured and stored in the ten_am_high and ten_am_low variables.
Bullish and Bearish Conditions:
If the price breaks above (bullish_break) or below (bearish_break) the high or low of the 10 AM candle, respectively.
Bar Coloring:
If the conditions are met (price breaking above or below the 10 AM levels), the script colors the candles during the time frame (09:59 AM to 01:59 PM).
Green color is applied for bullish breakouts.
Red color is applied for bearish breakouts.
Three Candle Breakout Marker**Title: Three Candle Breakout Marker**
**Description:**
The **Three Candle Breakout Marker** is a powerful trading indicator designed for traders who want to identify significant price movements based on recent price action. This script marks candles that break above the highest high or below the lowest low of the previous three candles, providing clear visual signals for potential trading opportunities.
### Key Features:
- **Visual Indicators**: The indicator uses upward blue triangles to signify when a candle closes above the highest high of the last three candles, indicating a bullish breakout. Conversely, it uses downward orange triangles to mark when a candle closes below the lowest low of the last three candles, signaling a bearish breakout.
- **Customizable Alerts**: Traders can easily customize this indicator to suit their trading strategies by adjusting colors and sizes for better visibility on their charts.
- **Enhanced Chart Analysis**: With optional horizontal lines drawn at the breakout levels, traders can quickly assess key support and resistance areas, enhancing their decision-making process.
### How to Use:
1. **Add to Chart**: Simply add the indicator to your TradingView chart for any asset or timeframe you are analyzing.
2. **Identify Breakouts**: Look for blue triangles above candles for bullish breakout signals and orange triangles below candles for bearish breakout signals.
3. **Combine with Other Tools**: Use this indicator in conjunction with other technical analysis tools and indicators to confirm signals and improve your trading strategy.
### Conclusion:
The **Three Candle Breakout Marker** is an essential tool for traders looking to capitalize on momentum shifts in the market. By clearly marking breakout points, it helps traders make informed decisions and enhances their ability to react swiftly to changing market conditions.
Feel free to explore and customize this indicator to fit your trading style! Happy trading!

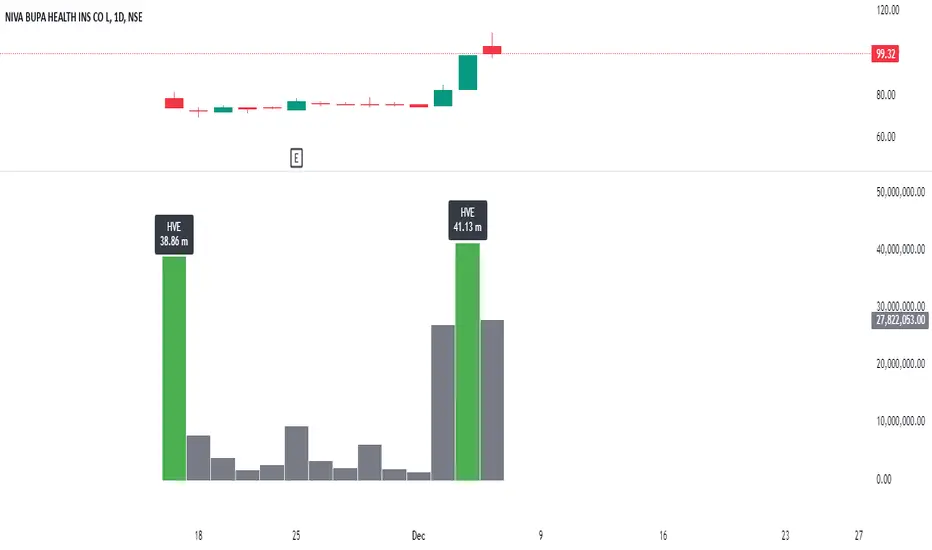
Highest Volume EverOverview:
The Highest Volume Ever (HVE) indicator highlights the highest volume bar in the visible chart history. It visually emphasizes significant volume spikes, helping traders identify key moments of market activity, such as breakout signals or accumulation phases.
Key Features:
Automatic Detection of Highest Volume:
The indicator dynamically scans the entire chart history to identify the bar with the highest trading volume, marking it with a clearly visible label.
Volume in Millions:
The label displays the highest volume in millions, providing a concise and readable format for better interpretation.
Adaptive Positioning:
The label is positioned slightly above the volume bar, ensuring it doesn't obstruct other chart elements while remaining close to the bar for easy reference.
Use Cases:
Identify Significant Market Activity: Detect periods of unusually high volume, often indicating the start of strong trends or the end of consolidations.
Confirm Breakouts: High volume often confirms the strength of breakout moves.
Spot Accumulation or Distribution: Unusually high volume can signal institutional buying or selling.
How to Use:
Add the indicator to your chart on TradingView.
The highest volume bar will be highlighted with a green bar and an "HVE" label above it.
Adjust the chart range to see how the indicator dynamically updates.
Perfect for:
Traders who rely on volume analysis to confirm price movements and detect significant market events.
Adaptive Range Breakout (ARB) IndicatorTitle: Adaptive Range Breakout (ARB) Indicator – Enhanced Mean Reversion with Dynamic Support/Resistance
Overview: The Adaptive Range Breakout (ARB) Indicator is designed to help traders identify potential mean reversion and breakout opportunities by leveraging a dynamic range based on recent price action and volatility. This script combines key elements such as Volume Profile analysis, ATR-based volatility adjustments, and an EMA trend filter to create a robust and adaptive trading tool. It aims to capture both trend continuations and reversals while filtering out noise in choppy markets.
Justification for Combining Components:
HVN (High Volume Node):
The core of this indicator is built around a custom VWAP calculation over a defined lookback period, which serves as the HVN line (High Volume Node). The HVN represents a volume-weighted average price, highlighting key levels where significant trading activity has occurred. These levels often act as areas of support or resistance, providing a reliable reference point for traders.
ATR-Based Dynamic Support and Resistance:
The Average True Range (ATR) is used to adjust the adaptive support and resistance levels around the HVN line. This ensures that the levels dynamically respond to changes in market volatility. The use of ATR helps filter out insignificant price movements and focuses on significant shifts in momentum, making the indicator adaptive to different market conditions.
EMA Trend Filter:
An Exponential Moving Average (EMA) is applied as a trend filter to distinguish between trending and range-bound market conditions. This filter helps in identifying whether the price movement is in line with the overall trend or if a potential reversal is more likely. By using the EMA crossover signals, the indicator can provide additional confirmation before generating buy or sell signals.
Adaptive Breakout and Mean Reversion Signals:
The indicator generates buy and sell signals based on the interaction between the price and the adaptive support/resistance levels. It incorporates a volatility filter to ensure that signals are only triggered when the market is sufficiently volatile, reducing the likelihood of false signals during low-volatility periods. Additionally, a cooldown period is implemented to prevent consecutive signals in quick succession, enhancing signal reliability.
Key Features:
Dynamic Range Levels: The adaptive support and resistance levels adjust based on recent price action and volatility, providing reliable areas for potential reversals or breakouts.
Volume-Weighted Analysis: The HVN line, derived from a custom VWAP calculation, highlights key price levels with significant trading activity, helping identify zones of support/resistance.
Trend Confirmation: The EMA trend filter helps differentiate between trend-following and mean-reversion signals, providing context for the generated buy and sell signals.
Volatility Filtering: The indicator uses ATR to gauge market volatility, ensuring signals are only generated during active market conditions.
Signal Cooldown: A customizable cooldown period reduces noise by spacing out signals, especially in choppy market environments.
Use Case:
The Adaptive Range Breakout (ARB) Indicator is suitable for traders looking to capitalize on both breakouts and mean-reversion opportunities. It is particularly useful in:
Range-Bound Markets: The adaptive support and resistance levels help capture reversals in range-bound conditions.
Trending Markets: The trend filter and breakout logic allow traders to follow momentum when the price breaks through key adaptive levels.
Intraday and Swing Trading: The dynamic nature of the indicator makes it applicable across different timeframes, catering to both intraday and swing traders.
Important Considerations:
This indicator does not guarantee future performance or provide an infallible prediction of price movements. It is a tool intended to support traders in their decision-making process based on historical price action and market conditions.
The effectiveness of the signals may vary depending on the asset, market conditions, and timeframe used. It is recommended to backtest the indicator and use it alongside other analysis techniques.
Always exercise caution and use appropriate risk management strategies when trading based on signals generated by this indicator.
Alerts: The indicator includes built-in alerts for:
Buy Signal Alert: Triggered when the price crosses above the adaptive support level, suggesting a potential reversal or continuation in an uptrend.
Sell Signal Alert: Triggered when the price crosses below the adaptive resistance level, indicating a potential reversal or continuation in a downtrend.
EMA Crossover Alerts: Alerts for EMA crossover signals, providing additional trend confirmation.
This script is a comprehensive tool designed to adapt to market conditions dynamically, combining multiple techniques to create a well-rounded approach to identifying trading opportunities. We encourage users to integrate it into their broader trading strategy and apply it with caution, understanding its strengths and limitations.

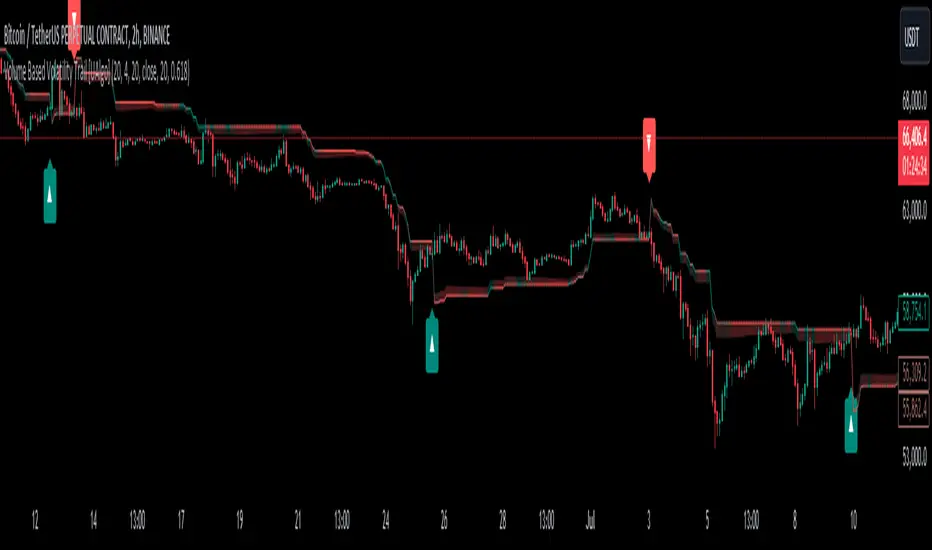
Volume Based Volatility Trail [UAlgo]"Volume Based Volatility Trail ", is designed to identify potential trading opportunities based on volatility and volume analysis. It calculates the Average True Range (ATR) to gauge market volatility and uses a volume-based multiplier to dynamically adjust a trailing stop level. The indicator also incorporates volume analysis to identify high volume periods that might signal potential breakouts.
🔶 Key Features
Volume-Based Volatility Trail: The indicator calculates a trailing stop level based on the ATR, which is then adjusted based on volume. Higher volume periods can lead to a wider trailing stop to account for increased volatility.
Price Source: Users can select the price source (e.g., close, open) for volume calculations.
Customizable Inputs: Users can adjust various parameters like the ATR period, multiplier, smoothing period, volume SMA period, ATR adjustment factor, and colors for buy/sell signals and the trailing stop area.
Buy/Sell Alerts: The indicator generates alerts for potential buy and sell opportunities based on the trailing stop crossing the price.
🔶 Usage
Look for buy signals (▲ marker) when the price crosses above the trailing stop level, potentially indicating a bullish trend.
Conversely, sell signals (▼ marker) appear when the price falls below the trailing stop, suggesting a bearish trend.
The shaded area around the trailing stop represents a buffer zone that might offer some protection against price fluctuations, but it can also indicate areas of potential pullbacks. During volatile periods or after strong price movements, the price might retrace back towards the trailing stop before continuing its trend. This shaded area can help visualize these potential retracement zones.
High volume periods (highlighted by the indicator) can be used in conjunction with other technical analysis to confirm potential breakouts. Analyze these high volume periods alongside price action and other indicators to assess the strength of the breakout and the likelihood of the price continuing its upward move.
🔶 Disclaimer:
Use with Caution: This indicator is provided for educational and informational purposes only and should not be considered as financial advice. Users should exercise caution and perform their own analysis before making trading decisions based on the indicator's signals.
Not Financial Advice: The information provided by this indicator does not constitute financial advice, and the creator (UAlgo) shall not be held responsible for any trading losses incurred as a result of using this indicator.
Backtesting Recommended: Traders are encouraged to backtest the indicator thoroughly on historical data before using it in live trading to assess its performance and suitability for their trading strategies.
Risk Management: Trading involves inherent risks, and users should implement proper risk management strategies, including but not limited to stop-loss orders and position sizing, to mitigate potential losses.
No Guarantees: The accuracy and reliability of the indicator's signals cannot be guaranteed, as they are based on historical price data and past performance may not be indicative of future results.
TrendLine Toolkit w/ Breaks (Real-Time)The TrendLine Toolkit script introduces an innovating capability by extending the conventional use of trendlines beyond price action to include oscillators and other technical indicators. This tool allows traders to automatically detect and display trendlines on any TradingView built-in oscillator or community-built script, offering a versatile approach to trend analysis. With breakout detection and real-time alerts, this script enhances the way traders interpret trends in various indicators.
🔲 Methodology
Trendlines are a fundamental tool in technical analysis used to identify and visualize the direction and strength of a price trend. They are drawn by connecting two or more significant points on a price chart, typically the highs or lows of consecutive price movements (pivots).
Drawing Trendlines:
Uptrend Line - Connects a series of higher lows. It signals an upward price trend.
Downtrend Line - Connects a series of lower highs. It indicates a downward price trend.
Support and Resistance:
Support Line - A trendline drawn under rising prices, indicating a level where buying interest is historically strong.
Resistance Line - A trendline drawn above falling prices, showing a level where selling interest historically prevails.
Identification of Trends:
Uptrend - Prices making higher highs and higher lows.
Downtrend - Prices making lower highs and lower lows.
Sideways (or Range-bound) - Prices moving within a horizontal range.
A trendline helps confirm the existence and direction of a trend, providing guidance in aligning with the prevailing market sentiment. Additionally, they are usually paired with breakout analysis, a breakout occurs when the price breaches a trendline. This signals a potential change in trend direction or an acceleration of the existing trend.
The script adapts this methodology to oscillators and other indicators. Instead of relying on price pivots, which can only be detected in retrospect, the script utilizes a trailing stop on the oscillator to identify potential swings in real-time, you may find more info about it here (SuperTrend toolkit) . We detect swings or pivots simply by testing for crosses between the indicator and its trailing stop.
type oscillator
float o = Oscillator Value
float s = Trailing Stop Value
oscillator osc = oscillator.new()
bool l = ta.crossunder(osc.o, osc.s) => Utilized as a formed high
bool h = ta.crossover (osc.o, osc.s) => Utilized as a formed low
This approach enables the algorithm to detect trendlines between consecutive pivot highs or lows on the oscillator itself, providing a dynamic and immediate representation of trend dynamics.
🔲 Breakout Detection
The script goes beyond trendline creation by incorporating breakout detection directly within the oscillator. After identifying a trendline, the algorithm continuously monitors the oscillator for potential breakouts, signaling shifts in market sentiment.
🔲 Setup Guide
A simple example on one of my public scripts, Z-Score Heikin-Ashi Transformed
🔲 Settings
Source - Choose an oscillator source of which to base the Toolkit on.
Zeroing - The Mid-Line value of the oscillator, for example RSI & MFI use 50.
Sensitivity - Calibrates the Sensitivity of which TrendLines are detected, higher values result in more detections.
🔲 Alerts
Bearish TrendLine
Bullish TrendLine
Bearish Breakout
Bullish Breakout
As well as the option to trigger 'any alert' call.
By integrating trendline analysis into oscillators, this Toolkit enhances the capabilities of technical analysis, bringing a dynamic and comprehensive approach to identifying trends, support/resistance levels, and breakout signals across various indicators.

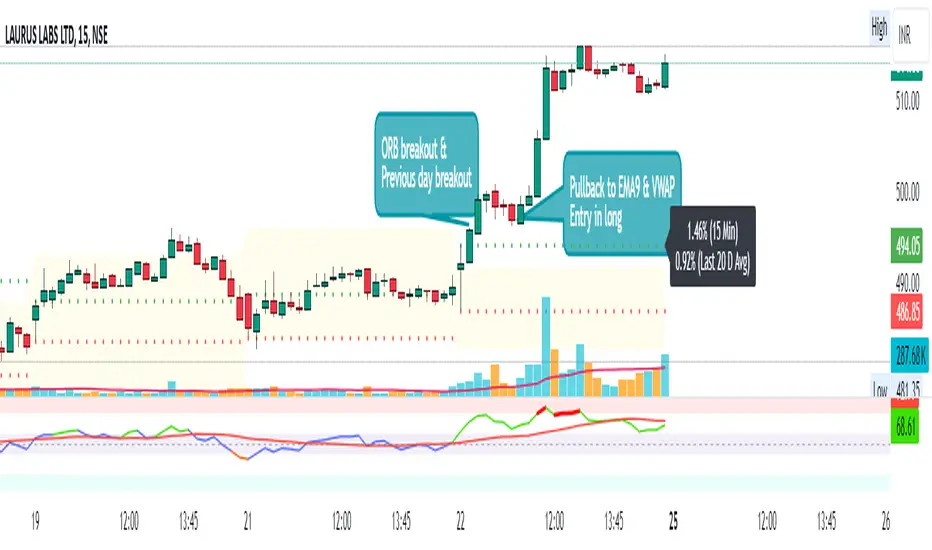
Pivot Points + Day First Candle Breakout + VWAP + Supertrend This indicator amalgamates several key indicators to provide a comprehensive analysis for trading decisions, including SuperTrend, Pivot Points, VWAP, along with the Day First Candle Breakout strategy.
Key Features:
Day First Candle Breakout: Identifies potential breakout opportunities based on the first candle of the trading day. It utilizes the high and low of the initial trading range to determine entry points.
Timeframe Selection: Allows users to select the timeframe for analyzing the first candle (e.g., 5, 15, or 60 minutes).
Previous Day and Week High/Low: Displays the high and low of the previous day and week to provide additional context for trading decisions and assess the strength of the trend.
Trend Strength Analysis: Indicates whether the current price is above or below the previous day's high or low, signaling a stronger bullish or bearish trend respectively.
SuperTrend Indicator: Visualizes the trend direction and potential reversal points based on the SuperTrend indicator. It helps traders to stay aligned with the prevailing trend and avoid premature exits.
Pivot Points: Presents key support and resistance levels derived from Pivot Points, assisting traders in identifying potential reversal or breakout zones.
VWAP (Volume Weighted Average Price): Plots VWAP to provide insight into the average price traded over a given period, aiding in determining the fair value of the asset and potential buying/selling zones.
Trading Signals:
Buy Signal: Triggered when the price exceeds the high of the initial trading range after an upward price gap.
Sell Signal: Generated when the price falls below the low of the initial trading range after a downward price gap.
Caveats for Effective Trading:
Extended Trading Ranges: Adjusts support and resistance levels if the initial trading range extends beyond the defined timeframe.
Morning Noise Consideration: Exercises caution during volatile morning sessions to avoid false breakouts and whipsaws.
Pullbacks and Narrow Range Bars: Looks for opportunities during pullbacks or when the price forms narrow range bars to enter trades, reducing the risk of sudden reversals.

Day First Candle BreakoutR-DFCB V1.5: Day First Candle Breakout
This indicator identifies potential breakout opportunities based on the first candle of the trading day. It considers the high and low of the initial trading range to determine possible entry points, along with the previous day's high and low to gauge the strength of the trend.
Key Features:
Day First Candle Breakout: Analyzes the first candle of the trading day to identify potential breakout scenarios.
Timeframe Selection: Allows users to select the timeframe for analyzing the first candle (e.g., 5, 15, or 60 minutes).
Previous Day and Week High/Low: Displays the high and low of the previous day and week to provide additional context for trading decisions.
Previous Day Trend Strength: Indicates whether the current price is above or below the previous day's high or low, signaling a stronger bullish or bearish trend respectively.
Trading Signals:
Buy Signal: Triggered when the price exceeds the high of the initial trading range after an upward price gap.
Sell Signal: Generated when the price falls below the low of the initial trading range after a downward price gap.
Trend Strength Analysis:
Strong Bullish Trend: If the current price is above the previous day's high, it indicates a stronger bullish trend.
Strong Bearish Trend: If the current price is below the previous day's low, it suggests a stronger bearish trend.
Caveats for Effective Trading:
Extended Trading Ranges: Adjusts support and resistance levels if the initial trading range extends beyond the defined timeframe.
Morning Noise Consideration: Exercises caution during volatile morning sessions to avoid false breakouts and whipsaws.
Pullbacks and Narrow Range Bars: Looks for opportunities during pullbacks or when the price forms narrow range bars to enter trades, reducing the risk of sudden reversals.
Price Percentage Breakout by Time PeriodDescription:
The Price Percentage Breakout by Time Period (P%BTP) indicator is a technical analysis tool designed to identify potential breakout signals based on the percentage change in price over a specified lookback period. It helps traders identify significant price movements that exceed a user-defined threshold, indicating potential trading opportunities.
How it Works:
The P%BTP indicator calculates the percentage change between the open and close prices of each candle. It compares this percentage change to the highest percentage change observed over the specified lookback period. When the percentage change exceeds or equals this highest value, it indicates a potential breakout signal. The indicator colors the bars on the chart based on whether it's a bullish or bearish breakout.
Usage:
To effectively utilize the Price Percentage Breakout by Time Period indicator, follow these steps:
1. Apply the P%BTP indicator to your chart by adding it from the available indicators.
2. Customize the input settings to suit your preferences. You can define the lookback period, which determines the number of bars used for calculating the percentage change, as well as choose colors for bullish and bearish breakouts.
3. Observe the bars on the chart:
- Bars highlighted in the bullish color indicate potential bullish breakout signals.
- Bars highlighted in the bearish color indicate potential bearish breakout signals.
4. Interpret the breakout signals:
- A bullish breakout signal occurs when the percentage change in price exceeds or equals the highest percentage change observed over the lookback period, indicating a potential upward movement.
- A bearish breakout signal occurs when the percentage change in price exceeds or equals the highest percentage change observed over the lookback period, indicating a potential downward movement.
5. Consider additional analysis:
- Combine the breakout signals from the P%BTP indicator with other technical analysis tools, such as support and resistance levels, trend lines, or candlestick patterns, to confirm potential trade setups.
6. Implement appropriate risk management strategies, including setting stop-loss orders and position sizing, to manage your trades effectively and protect your capital.
Note: The Price Percentage Breakout by Time Period indicator provides insights into potential breakout signals based on the percentage change in price over a specified lookback period. However, it is recommended to use this indicator in conjunction with other technical analysis tools and perform thorough analysis before making trading decisions.

Price Percentage Breakout by Chosen PercentageDescription:
The Price Percentage Breakout indicator (P%B) is a technical analysis tool designed to identify potential breakout signals based on percentage changes in price. It helps traders identify significant price movements that exceed a specified threshold, indicating potential trading opportunities.
How it Works:
The Price Percentage Breakout indicator calculates the percentage change between the open and close prices of each candle. It compares this percentage change to a user-defined threshold to determine if a breakout has occurred. When the percentage change exceeds the threshold, indicating a significant price movement, the indicator highlights the breakout on the chart. Additionally alerts can be created by the user that display the percentage of the breakout.
Usage:
To effectively utilize the Price Percentage Breakout indicator, follow these steps:
1. Apply the P%B indicator to your chart by adding it from the available indicators.
2. Customize the input settings to suit your preferences. You can choose the color for highlighting the breakout and set the percentage threshold for detecting breakouts.
3. Observe the bars on the chart:
- Bars highlighted in the chosen color indicate potential breakout signals.
4. Interpret the breakout signals:
- A breakout signal occurs when the percentage change in price exceeds the specified threshold. This suggests a significant price movement.
5. Consider additional analysis:
- Combine the breakout signals from the Price Percentage Breakout indicator with other technical analysis tools, such as support and resistance levels, trend lines, or candlestick patterns, to confirm potential trade setups.
6. Implement appropriate risk management strategies, including setting stop-loss orders and position sizing, to manage your trades effectively and protect your capital.
Note: The Price Percentage Breakout indicator provides insights into potential breakout signals based on percentage changes in price. However, it is recommended to use this indicator in conjunction with other technical analysis tools and perform thorough analysis before making trading decisions.
SBS AlgoHello traders, I am here again with a new and improved indicator.
This indicator is based on a pivot breakout algorithm which gives buy and sell signals according to the breakout of trendline. This is an advanced version of another script. It also takes price action into consideration along with some basic indicators like MACD and ADX to give good entry signals.
NOTE: This indicator is not designed to take entries completely based on signals it gives. Please use it along with your trading strategy to add more confluence to your trading system and maximize your profits.
I hope you guys will like this one too .Enjoy 👍
In case you find any bug, please do report in comment section .Thank you.

MM Chop Filter Range BoxesMatch with the MM Chop Filter
This draw Non repainting range boxes when the oscillator see a range.
-Breakout Buy/Sell Signals and Exit signals when prices enters a range just in case you did get into a trade. .
-Alarms to match the signals
How to use
Match with the oscillator and always trade the trend with your strategy confirmation and the breakout this indicator provides

Enlighten-TradeTechnical analysts use support and resistance levels to identify price points on a chart to find probabilities to trade a prevailing trend.
This indicator plots dynamic support and resistance based on price range (all time frames).
Indicator will plot S1, S2, S3, S4 - P - R1, R2, R3, R4 (S = Support, R = Resistance & P = Pivot )
Support breaks when a downtrend was started and price will go below the support level.
Resistance breaks when a uptrend was started and price will go above the support level.
Breakouts provide possible trading opportunities. A breakout to the upside signals traders to possible get long or cover short positions. A breakout to the downside signals traders to possibly get short or to sell long positions.
Breakouts can be subjective since not all traders will recognize or use support and resistance levels.
This indicator shows Dynamic Support & Resistance Levels.

Pivot Points AlgoThis is a Pivot Points Algo (PPA).
PPA uses an adaptive pivot algorithm that adapts to different market situations based on various factors.
PPA also includes depth filtering to make it more precise at its signal decision.
======= Signal Types ======
Main Signal of BUY and SELL shown by buy/sell labels.
Mini Signals of BUY and SELL shown by buy/sell arrows and shows additional breakouts after the Main Signal occurred.
Optional reversal signals show a possible reversal in trend (small triangle).
======= Alerts =======
Main Signals alerts - Alerts when a main Buy or Sell is triggered (Shown as Labels).
Combo Alerts - Alerts when main or mini signals of Buy and Sell are triggered (Shown as Arrows).
======= Assets and Time frames =======
Can be used on various assets, stocks, forex, crypto and works great for day trading as well as swing trading and long term investing.
PPA is designed to adjust to any time frame!
======= General info =======
The purpose of this indicator is to signal possible breakouts with a high rate of success.
PPA has been extensively tested and fine tuned to provide traders and investors with a valuable tool for timing long and short entries. However, no system is 100% perfect, and it is good practice to have a plan in place and use stop losses or other tools to mitigate unforeseen risk.
Also, note, I don't hide what PPA is doing as opposed to some other commercial indicators on the market. You can view pivot lines and pivot bands and so on.
The magic is the inner system itself which works for you to pinpoint the best entrance possible, I recommend confirming your own methods to make sure you want to take the trade.
To subscribe to Pivot Points Algo service see “Author's instructions” below.
For any question you can PM me.
Happy and profitable trading!

False BreakoutA false breakout is when the price temporarily moves above or below a key support or resistance level, but then later retreats back to the same side as it started.
The “False Breakout” indicator reveals false breakouts in comparison to the previous candle.
In case we're looking to trade the stock for long this would mean that the price of the stock broke the previous low (support) and then got back above that low.
In case we're looking to trade the stock for short then a false breakout would mean the stock broke the previous high (resistance) and then got back below that high.
How to use the indicator?
First choose the direction you're looking to trade, meaning either long or short.
Then choose how strict you want to be about the Falls brakes.
There are three options:
The first option named “All“ means that it's enough that the stock broke the previous level and then get back to the original side.
The second option is “Supporting Change” meaning not only that the stock broke the previous key level (support or resistance), but also the change at the end of the candle is supporting the main direction - meaning the change is positive for long or negative for short.
The third option is “Engulfing”. This is a well-known candle, but to make it clear, in our case “Engulfing” means that not only the stock broke the previous level but it also ended the day on the other side of the candle - higher than the previous high, in case of long, and lower than the previous low, in case of short.
When you choose the level of strictness you determine how many indications you're going to get on the chart.
If you choose the highest level of strictness, meaning “Engulfing”, you would only see the red flags indicating engulfing candles.
If you choose the lowest level of strictness, meaning “All”, you will get more indications on your chart, including every false breakout.
When the direction you're looking for is long, all indications would appear below the candles.
When the direction you're looking for is short, then all indications would appear above the candles.
The Engulfing candles are represented by Red flags, and the Simple breakouts candles are represented by yellow. All colors may be adjusted to your preference.
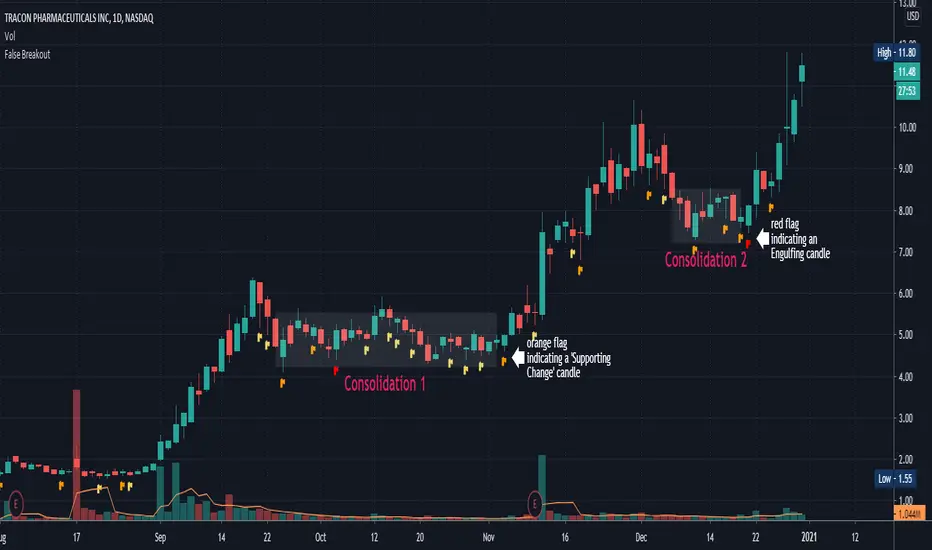
Explaining the example above:
In the chart above we can see two consolidations. At the end of each consolidation, we can see a candle with an indication from the indicator that points out that this could be the end of the consolidation and the stock might continue its move.
In “consolidation 1” we can see that there is an orange flag below the candle right before the stock began to move up again.
In “consolidation 2” we can see that there is a red flag below the candle, right before the stock began another move.
Wishing you all the best :)
TradeChartist Tracker™𝗧𝗿𝗮𝗱𝗲𝗖𝗵𝗮𝗿𝘁𝗶𝘀𝘁 𝗧𝗿𝗮𝗰𝗸𝗲𝗿 is an essential real-time multi Indicator tracking toolkit that can be plotted as a standalone Indicator plot, a multi symbol tracker/screener for upto 10 different symbols and a visual scorecard for upto 5 different symbols. The indicators included in the tracker are Stochastic Oscillator, RSI, CCI, 15 different Moving Averages, MACD, Bollinger Bands %B (including Bollinger Bands and Breakout Signals), Ichimoku Cloud (including Breakout signals), Donchian Channels Oscillator (including Donchian Channels and Breakout Signals), Net Volume and Heikin Ashi Trend.
===================================================================================================================
™𝗧𝗿𝗮𝗱𝗲𝗖𝗵𝗮𝗿𝘁𝗶𝘀𝘁 𝗧𝗿𝗮𝗰𝗸𝗲𝗿 𝗨𝘀𝗲𝗿 𝗠𝗮𝗻𝘂𝗮𝗹
=====================================
™TradeChartist Tracker Plot Types
==============================
1. Indicator plot of Chart Symbol on its own , chosen from the 𝗜𝗻𝗱𝗶𝗰𝗮𝘁𝗼𝗿 𝗧𝘆𝗽𝗲 dropdown, enabling 𝐃𝐢𝐬𝐩𝐥𝐚𝐲 𝐈𝐧𝐝𝐢𝐜𝐚𝐭𝐨𝐫 𝐏𝐥𝐨𝐭 (𝐝𝐢𝐬𝐚𝐛𝐥𝐞𝐬 𝐓𝐫𝐚𝐜𝐤𝐞𝐫/𝐒𝐜𝐨𝐫𝐞𝐜𝐚𝐫𝐝).
In this example Daily chart of XRP-USDT, 55 period Stochastic is tracked for the chart symbol XRP-USDT.
2. Indicator plot of a Symbol different from the Chart Symbol , chosen from the 𝗜𝗻𝗱𝗶𝗰𝗮𝘁𝗼𝗿 𝗧𝘆𝗽𝗲 dropdown by enabling Tʀᴀᴄᴋ ᴀɴᴏᴛʜᴇʀ Sʏᴍʙᴏʟ's Iɴᴅɪᴄᴀᴛᴏʀ and entering the symbol name in the Sʏᴍʙᴏʟ ᴛᴏ Tʀᴀᴄᴋ input box, whilst keeping 𝐃𝐢𝐬𝐩𝐥𝐚𝐲 𝐈𝐧𝐝𝐢𝐜𝐚𝐭𝐨𝐫 𝐏𝐥𝐨𝐭 (𝐝𝐢𝐬𝐚𝐛𝐥𝐞𝐬 𝐓𝐫𝐚𝐜𝐤𝐞𝐫/𝐒𝐜𝐨𝐫𝐞𝐜𝐚𝐫𝐝) enabled.
In this example Daily chart of XRP-USDT, 55 period Stochastic is tracked for the BTC-USD (different from chart symbol XRP-USDT).
3. Tracker Plot of up to 10 Multiple Symbol Trackers for the Indicator chosen from the 𝗜𝗻𝗱𝗶𝗰𝗮𝘁𝗼𝗿 𝗧𝘆𝗽𝗲 dropdown, by disabling 𝐃𝐢𝐬𝐩𝐥𝐚𝐲 𝐈𝐧𝐝𝐢𝐜𝐚𝐭𝐨𝐫 𝐏𝐥𝐨𝐭 (𝐝𝐢𝐬𝐚𝐛𝐥𝐞𝐬 𝐓𝐫𝐚𝐜𝐤𝐞𝐫/𝐒𝐜𝐨𝐫𝐞𝐜𝐚𝐫𝐝) and by entering the number of trackers required in the 𝐍𝐮𝐦𝐛𝐞𝐫 𝐨𝐟 𝐓𝐫𝐚𝐜𝐤𝐞𝐫𝐬 input box under 𝗧𝗿𝗮𝗰𝗸𝗲𝗿 𝗣𝗹𝗼𝘁𝘀 section. Upto 10 Symbols can be tracked and can be input by the user in the input boxes from Sʏᴍʙᴏʟ 1,...Sʏᴍʙᴏʟ 10 . 𝐃𝐢𝐬𝐩𝐥𝐚𝐲 𝐈𝐧𝐝𝐢𝐜𝐚𝐭𝐨𝐫 𝐏𝐥𝐨𝐭 (𝐝𝐢𝐬𝐚𝐛𝐥𝐞𝐬 𝐓𝐫𝐚𝐜𝐤𝐞𝐫/𝐒𝐜𝐨𝐫𝐞𝐜𝐚𝐫𝐝) must be disabled for this plot type.
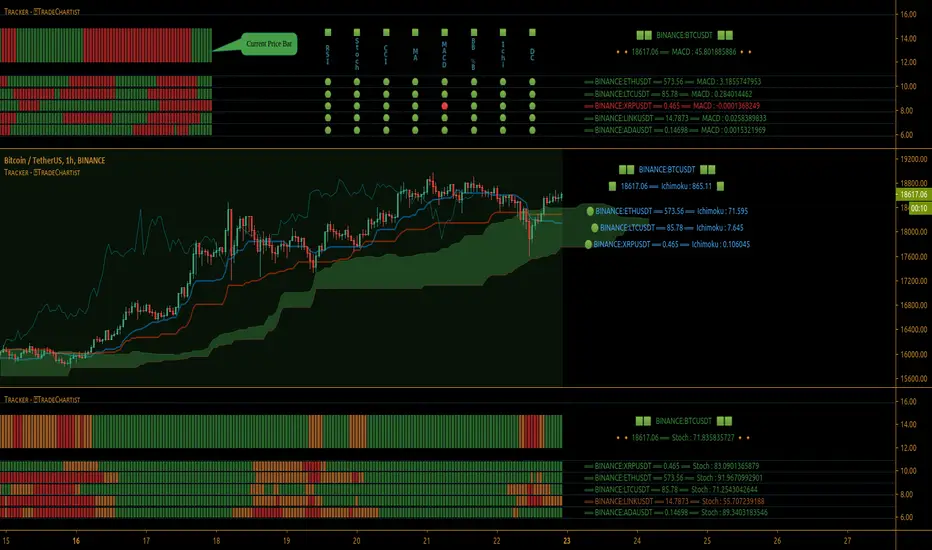
In this example Daily chart of Crypto Total Market Cap, Bollinger Bands %B is tracked for the chart symbol + 10 other Crypto symbols using Multi Symbol Trackers
4. Visual Scorecards of up to 5 Symbols for 8 indicators (all except Net Volume and HA Trend) can be plotted with real-time data by enabling 𝗗𝗶𝘀𝗽𝗹𝗮𝘆 𝗩𝗶𝘀𝘂𝗮𝗹 𝗦𝗰𝗼𝗿𝗲𝗰𝗮𝗿𝗱 - (𝟓 𝐓𝐫𝐚𝐜𝐤𝐞𝐫𝐬 𝐋𝐢𝐦𝐢𝐭). 𝐃𝐢𝐬𝐩𝐥𝐚𝐲 𝐈𝐧𝐝𝐢𝐜𝐚𝐭𝐨𝐫 𝐏𝐥𝐨𝐭 (𝐝𝐢𝐬𝐚𝐛𝐥𝐞𝐬 𝐓𝐫𝐚𝐜𝐤𝐞𝐫/𝐒𝐜𝐨𝐫𝐞𝐜𝐚𝐫𝐝) must be disabled for this plot type.
For the same example Daily chart of Crypto Total Market Cap as above, Visual Scorecard is plotted for 5 Symbols as shown.
5. Indicator Tracker labels can be plotted on Price chart by overlaying the Tracker on main chart and by switching from Separate Tracker Pane - Default to Tracker Labels only on Price Scale in the Lᴀʙᴇʟs Dɪsᴘʟᴀʏ Tʏᴘᴇ dropdown box.
In this example chart of 1hr XLM-USDT, Tracker labels of 55 EMA are plotted for 10 different symbols along with the 55 EMA plot of XLM-USDT.
Indicator plot that doesn't fit on price scale can be visualised using a second Tracker added to chart as shown in the ETH-USDT example below tracking Net Volume.
===================================================================================================================
𝗜𝗻𝗱𝗶𝗰𝗮𝘁𝗼𝗿𝘀 𝗜𝗻𝗰𝗹𝘂𝗱𝗲𝗱 𝗶𝗻 ™𝗧𝗿𝗮𝗱𝗲𝗖𝗵𝗮𝗿𝘁𝗶𝘀𝘁 𝗧𝗿𝗮𝗰𝗸𝗲𝗿
==============================================
1. Stochastic Oscillator
2. RSI
3. CCI
4. MA - (15 types included)
5. MACD
6. Bollinger Bands %B + Optional plots of Bollinger Bands and Breakout Signals
7. Ichimoku Cloud Oscillator + Optional plots of Ichimoku Cloud and Breakout Signals
8. Donchian Channels + Optional plots of Donchian Channels and Breakout Signals
9. Net Volume
10. Heikin Ashi Trend
All of the above indicators can be plotted as independent plots of the Chart Symbol or of a different symbol by enabling 𝐃𝐢𝐬𝐩𝐥𝐚𝐲 𝐈𝐧𝐝𝐢𝐜𝐚𝐭𝐨𝐫 𝐏𝐥𝐨𝐭 (𝐝𝐢𝐬𝐚𝐛𝐥𝐞𝐬 𝐓𝐫𝐚𝐜𝐤𝐞𝐫/𝐒𝐜𝐨𝐫𝐞𝐜𝐚𝐫𝐝). Some Oscillators have the option of Pʟᴏᴛ Sᴛʏʟᴇ under their relevant sections, and can be plotted as line, area or a histogram.
Oscillators 1-8 (except 4) require source price, lookback length and smoothing (where available) for the indicator plot. The colour of the tracker blocks is based on the Upper/Lower bands (where available), specified by the user in the respective sections. For example, if the RSI indicator is chosen to be plotted with Upper band at 60 and Lower band at 40, the tracker blocks and the Indicator plot paint the values between 40 and 60 in neutral colour which can be changed from the settings.
Multi Window BTC-USDT 1hr example chart below with various indicators from ™TradeChartist Tracker.
Note: The tracker colour is exactly colour of the Indicator Plot. The Visual Scorecard , however uses the mid values and doesn't take into account the bands specified by the user. For example, RSI score is green on the Visual Scorecard as long as RSI is above 50 and doesn't get affected by the user specified upper/lower band and this applies to all Oscillators. This is shown in the 1hr BTC-USDT chart below.
Moving Averages (MA) and MACD
------------------------------------------------------
Tracker plots and tracks one of 15 Moving Averages that can be chosen from the MA ᴛʏᴘᴇ and by specifying the MA Lᴇɴɢᴛʜ .
MACD uses EMA as default for calculating the MACD plots and Tracker data using Fᴀsᴛ Lᴇɴɢᴛʜ , Sʟᴏᴡ Lᴇɴɢᴛʜ and Sᴍᴏᴏᴛʜɪɴɢ . To experiment or use a different Moving Average to calculate MACD, disable 𝐔𝐬𝐞 𝐄𝐌𝐀 (Uɴᴄʜᴇᴄᴋ ᴛᴏ ᴜsᴇ MA ғʀᴏᴍ ᴀʙᴏᴠᴇ) and select the required Moving Average from MA ᴛʏᴘᴇ drop down of the 𝟰. 𝗠𝗼𝘃𝗶𝗻𝗴 𝗔𝘃𝗲𝗿𝗮𝗴𝗲 section.
Bollinger Bands %B + Optional plots of Bollinger Bands and Breakout Signals
---------------------------------------------------------------------------------------------------------------------------
Bollinger Bands %B is a companion oscillator for Bollinger Bands and helps depict where the price is, in relation to the Bollinger Bands. To plot the actual Bollinger Bands, enable Dɪsᴘʟᴀʏ Bᴏʟʟɪɴɢᴇʀ Bᴀɴᴅs and to plot the Bollinger Bands Breakout Signals, enable Sʜᴏᴡ BB Bʀᴇᴀᴋᴏᴜᴛ Sɪɢɴᴀʟs , with 𝐃𝐢𝐬𝐩𝐥𝐚𝐲 𝐈𝐧𝐝𝐢𝐜𝐚𝐭𝐨𝐫 𝐏𝐥𝐨𝐭 (𝐝𝐢𝐬𝐚𝐛𝐥𝐞𝐬 𝐓𝐫𝐚𝐜𝐤𝐞𝐫/𝐒𝐜𝐨𝐫𝐞𝐜𝐚𝐫𝐝) enabled.
Ichimoku Cloud Oscillator + Optional plots of Ichimoku Cloud and Breakout Signals
------------------------------------------------------------------------------------------------------------------------------------
Ichimoku Cloud Oscillator helps visualize the current price in relation to the breakout support/resistance of the Ichimoku Cloud using strict Ichimoku Cloud criteria (including Chikou Span agreeing with the breakout etc.). To plot the actual Ichimoku Cloud, enable Dɪsᴘʟᴀʏ Iᴄʜɪᴍᴏᴋᴜ Cʟᴏᴜᴅ and to plot the Kumo Breakout Signals, enable Sʜᴏᴡ Kᴜᴍᴏ Bʀᴇᴀᴋᴏᴜᴛ Sɪɢɴᴀʟs , with 𝐃𝐢𝐬𝐩𝐥𝐚𝐲 𝐈𝐧𝐝𝐢𝐜𝐚𝐭𝐨𝐫 𝐏𝐥𝐨𝐭 (𝐝𝐢𝐬𝐚𝐛𝐥𝐞𝐬 𝐓𝐫𝐚𝐜𝐤𝐞𝐫/𝐒𝐜𝐨𝐫𝐞𝐜𝐚𝐫𝐝) enabled.
Cloud Settings form the fundamental factor for this indicator to detect the breakouts. The settings for the Ichimoku Cloud is Automatic (detects right settings for the symbol type) by default, but this can be changed to Classic or 24/7 Crypto , based on the user preference from the settings under 𝐂𝐥𝐨𝐮𝐝 𝐓𝐲𝐩𝐞, which also includes a manual input option. Ichimoku traders can experiment different settings combinations under manual settings to suit their trading frequency and timeframe traded.
Donchian Channels + Optional plots of Donchian Channels and Breakout Signals
-------------------------------------------------------------------------------------------------------------------------------
Donchian Channels comprises of three plots - a upper band, a lower band and a mean line (or mid line of the channel). The upper band is based on highest high of N periods specified by the user and the lower band is based on the lowest low of N periods specified by the user. These channels help spot price breaching high or low of last N periods clearly, thereby aiding the trader to understand the price action of any symbol better on any given timeframe.
Donchian Channels Oscillator helps visualize the current price in relation to the Mean line of the Donchian Channels of user specified lookback period (specified in the Dᴏɴᴄʜɪᴀɴ Cʜᴀɴɴᴇʟ Lᴇɴɢᴛʜ input box). The sensitivity of the oscillator can be adjusted using smoothing factor in the Sᴍᴏᴏᴛʜɪɴɢ input box. To plot the actual Donchian Channels, enable Dɪsᴘʟᴀʏ Dᴏɴᴄʜɪᴀɴ Cʜᴀɴɴᴇʟs and to plot the Donchian Channels Breakout Signals, enable Sʜᴏᴡ DC Bʀᴇᴀᴋᴏᴜᴛ Sɪɢɴᴀʟs , with 𝐃𝐢𝐬𝐩𝐥𝐚𝐲 𝐈𝐧𝐝𝐢𝐜𝐚𝐭𝐨𝐫 𝐏𝐥𝐨𝐭 (𝐝𝐢𝐬𝐚𝐛𝐥𝐞𝐬 𝐓𝐫𝐚𝐜𝐤𝐞𝐫/𝐒𝐜𝐨𝐫𝐞𝐜𝐚𝐫𝐝) enabled.
Note: Using smoothing factor more than 1 doesn't reflect the actual Donchian Channels Mean line and also impacts the Tracker block colours.
Net Volume and Heikin Ashi Trend
-------------------------------------------------------
Net Volume and Heikin Ashi Trend can be tracked and plotted for up to 10 symbols in addition to the chart symbol, but both Net Volume and Heikin Ashi Trend are not included in the Visual Scorecard. Since the colour of the Net Volume depends on candle being bullish or bearish, it can help the user visualize if the current candle close of the symbol tracked is above or below the symbols's candle open.
Note: Bar Replay doesn't update the bar by bar indicator plot for historic bars for symbols other than the chart symbol. However, the Indicator Plot is perfectly usable for the realtime bar as data updates for both the Trackers and the Scorecard in realtime.
===================================================================================================================
𝗩𝗶𝘀𝘂𝗮𝗹 𝗦𝗰𝗼𝗿𝗲𝗰𝗮𝗿𝗱
=================
Visual Scorecard plots a green Bull or a red Bear Score colour plot for each Indicator from RSI to Donchian Channels Oscillator against every symbol tracked for up to 5 symbols max (First 5 symbols under 𝗧𝗿𝗮𝗰𝗸𝗲𝗿 𝗣𝗹𝗼𝘁𝘀 section). The gap between the scores can be adjusted using gap factor under Gᴀᴘ Fᴀᴄᴛᴏʀ ʙᴇᴛᴡᴇᴇɴ Sᴄᴏʀᴇs dropdown.
Visual Scorecard scoring method
----------------------------------------------------
RSI > 50 - 🟢
RSI < 50 - 🔴
Stoch > 50 - 🟢
Stoch < 50 - 🔴
CCI > 0 - 🟢
CCI < 0 - 🔴
Close price above MA plot - 🟢
Close price below MA plot - 🔴
MACD > 0 - 🟢
MACD < 0 - 🔴
Bollinger Bands %B > 50 - 🟢
Bollinger Bands %B < 50 - 🔴
Ichimoku Bullish Kumo Trend - 🟢
Ichimoku Bearish Kumo Trend - 🔴
Donchian Channels Oscillator > 0 (or close price above DC Mean Line) - 🟢
Donchian Channels Oscillator < 0 (or close price below DC Mean Line) - 🔴
Note: Bar Replay doesn't update the bar by bar scores/tracker data for historic bars for symbols other than the chart symbol. However, the Scorecard is perfectly usable for the realtime bar as data updates for both the Trackers and the Scorecard in realtime.
===================================================================================================================
𝗠𝘂𝗹𝘁𝗶 𝗦𝘆𝗺𝗯𝗼𝗹 𝗧𝗿𝗮𝗰𝗸𝗲𝗿𝘀/𝗟𝗮𝗯𝗲𝗹𝘀
=============================
Multi Symbol Tracker blocks continuously track the real-time indicator data of up to 10 symbols (in addition to the chart symbol) based on the number of Symbol Trackers preferred in the 𝐍𝐮𝐦𝐛𝐞𝐫 𝐨𝐟 𝐒𝐲𝐦𝐛𝐨𝐥 𝐓𝐫𝐚𝐜𝐤𝐞𝐫𝐬 (𝟎-𝟏𝟎) input box under the 𝗧𝗿𝗮𝗰𝗸𝗲𝗿 𝗣𝗹𝗼𝘁𝘀 section, and plots Bull, Bear and Neutral colour coded blocks based on both the indicator selected and settings preferred by the user under the relevant indicator section.
Multi Symbol Tracker Labels also continuously track the real-time indicator data in addition to the last close price (if 𝐒𝐡𝐨𝐰 𝐏𝐫𝐢𝐜𝐞 is enabled under 𝗧𝗿𝗮𝗰𝗸𝗲𝗿 𝗣𝗹𝗼𝘁𝘀 section), which helps user see the real-time changes in the indicator values and price changes of the symbols tracked.
The Tracker Label colours are exactly the same as the Tracker Block colours and are filtered based on the user preferred bands on the Oscillator values. This is slightly different to the Visual Scorecard Colour coding as the range between the user preferred bands is colour coded in a neutral colour, whereas the Scorecard uses only Bull and Bear Colours as explained in the 𝗩𝗶𝘀𝘂𝗮𝗹 𝗦𝗰𝗼𝗿𝗲𝗰𝗮𝗿𝗱 heading above. For example, if the user prefers RSI upper band of 60 and lower band of 40, the range between the values of 40 and 60 will be colour coded in neutral colour which can be changed from the 𝗨𝘀𝗲𝗳𝘂𝗹 𝗘𝘅𝘁𝗿𝗮𝘀 section of the indicator settings.
Note 1: Default settings are based on the Oscillator mid values and hence the Tracker Blocks match with the Visual Scorecard colour codes. Using Upper and Lower bands for oscillators help spot the oversold and overbought zones and also helps spot breakout threshold based on Indicator values specified by the user. Example chart with visual depiction below using RSI.
Note 2: Bar Replay doesn't update the bar by bar scores/tracker data for historic bars for symbols other than the chart symbol. However, the Tracker blocks/labels are perfectly usable for the realtime bar as data updates for both the Trackers and the Scorecard in realtime.
===================================================================================================================
Frequently Asked Questions
========================
Q: When I load the ™TradeChartist Tracker, why are the values in the labels blurred sometimes?
A: This happens occasionally as shown in the chart below, when the script is loaded for the first time or when a different setting is used.
To resolve this, just hide and unhide the script using the 👁 next to the Indicator title. If it is not visible, just hover the mouse/crosshair over the Indicator Title and it will be visible.
Q: Why does the indicator plot, tracker blocks and labels of Symbols being tracked, not update when I use Bar Replay?
A: As explained in the relevant sections above, historic data for bars and indicators other than chart symbol doesn't update on bar replay. But the chart symbol data does update for every bar on bar replay. This doesn't affect the real-time values and block colours for the symbols tracked.
Q: Can I track real-time values of a currently trading symbol when I'm on a symbol chart that is inactive? For example, can I see labels with real-time BTC values on a Sunday when I'm on a SPX chart when its not in session?
A: Simple answer is no. This is because, the plots are based on bar times of the chart and the symbols are tracked based on the bar time. So if the SPX session ended on Friday, the last known value of the BTC labels will be from Friday and hence it is always recommended to track symbols from a symbol chart that is in session.
Q: Does ™TradeChartist Tracker repaint?
A: This indicator doesn't repaint but it is not recommended to trade a different symbol from the chart based on the real-time data alone without checking if the current symbol chart is in session as inactive price chart will not have updated data on symbols tracked. Also, bar replay doesn't work on data pulled from external symbol data than the chart symbol, but signals confirmed at candle close and confirmed by Tracker blocks with appropriate colour code will be in agreement with the respective indicator and can be double checked for building trust and confidence on the indicator.
Q: Can ™TradeChartist Tracker be connected to other indicators as external source?
A: Yes. ™TradeChartist Tracker can be connected to another script and there are several use cases in doing so. A couple of examples are shown below.
1. ™TradeChartist Tracker 's Bollinger Bands %B 𝗜𝗻𝗱𝗶𝗰𝗮𝘁𝗼𝗿 𝗣𝗹𝗼𝘁 connected to ™TradeChartist Plotter to plot Divergences on the 4hr XAU-USD main price chart.
2. ™TradeChartist Tracker 's 𝐁𝐫𝐞𝐚𝐤𝐨𝐮𝐭 𝐓𝐫𝐞𝐧𝐝 𝐈𝐝𝐞𝐧𝐭𝐢𝐟𝐢𝐞𝐫 connected to ™TradeChartist Plug and Trade as Oscillatory Signal with 0/0 to generate trade signals with Targets and performance information on trades.
More Example Charts
==================
===================================================================================================================
Best Practice: Test with different settings first using Paper Trades before trading with real money
===================================================================================================================
This is not a free to use indicator. Get in touch with me (PM me directly if you would like trial access to test the indicator)
Premium Scripts - Trial access and Information
Trial access offered on all Premium scripts.
PM me directly to request trial access to the scripts or for more information.
===================================================================================================================
W5T BITSThe B.I.T.S (Breakout Intelligent Breakout Signals) Trading Suite is for swing and day trading instruments with Volume and price action. So Cryptocurrency, Futures , Stocks and Commodities on all time frames. We are looking at squeezes in price action with increased volume . Then the proximity to our points of control, which are different EMA´s
Developed through in our Cloud
Signal Candles Both Long & Short
Entry & Stop Loss Prices
Automated Bias Indicator
W5T Special Points of Control
Yesterday's HLC levels and labels
Automatic Risk Calculator when trading Stocks
Training Bootcamp
See our signature to learn more!

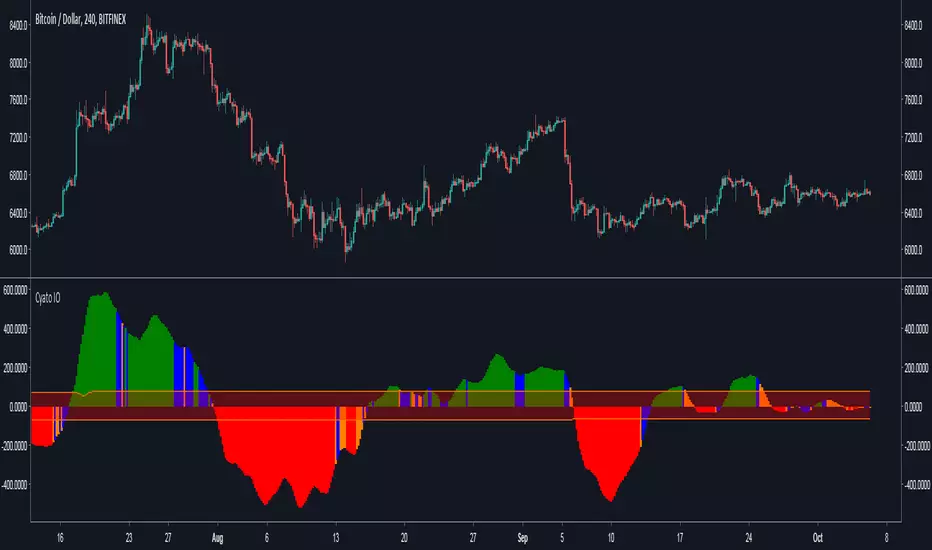
Cyatophilum Ichimoku Oscillator [ALERT SETUP]Hello, I built an oscillator based on Ichimoku trading rules. I wanted something simple to use, but powerful, with automated alerts that would help us trade breakouts and trend reversals.
The indicator can be used on all timeframes and everywhere : Crypto, Forex, Index, Stocks, Futures, CFD.
Basically, green bars equals bull market and red bars equals bear market.
Blue and Orange bars show potential breakouts and you can setup automatic alerts for receiving an email or SMS when it happens.
You can also setup alerts for new highs and new lows indicating a potential trend reversal.
The narrow channel in the middle indicates consolidating periods and unsignificant trades, because we know Ichimoku performs badly in range markets.
For more information on how to use it, I made a description page at the link below.
Sample Use Cases :
BTCUSD 4H
BTCUSD 2H with New Highs/Lows on chart (blue and red circles correspond to alert conditions)
BTCUSD 1H
ETHUSD 2H
Use divergences with price action to trade breakouts.
More information on my website
blockchainfiesta.com
Purchase this indicator today and get access to my other Cyatophilum Indicators that will help you in your trading
blockchainfiesta.com
Happy trading!
BoSThis is a customized indicator that helps to confirm and identify breakouts displayed in the form of signals:
The tool can be customised for all pivot strengths
It can be applied on all timeframes but works best on the daily and weekly
A “Buy” signal is displayed when a pivot high is broken
A “Sell” signal is displayed when a pivot low is broken
This tool also helps to identify fake breakouts

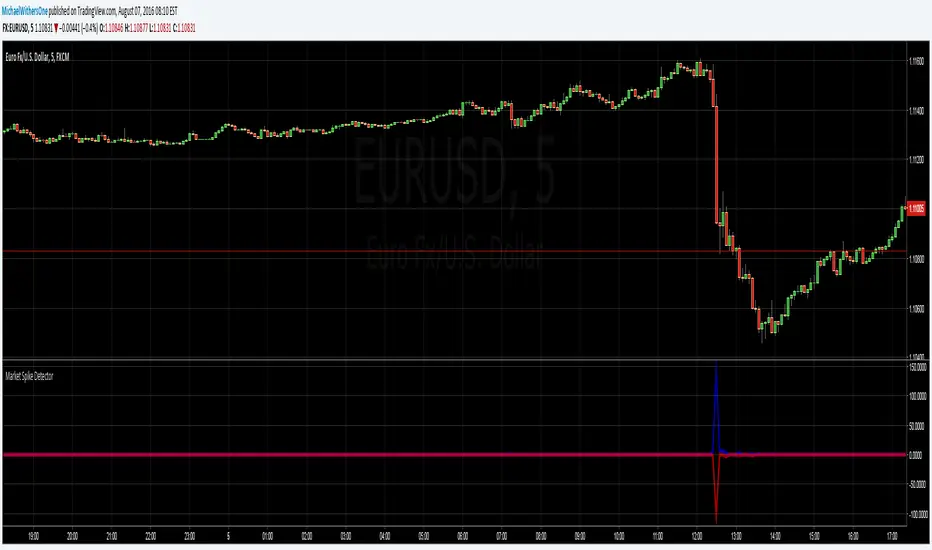
Seismic Market Spike Detector v1.0 Seismic Market Spike Detector v1.0
This indicator helps identify spikes in market activity , typified by bars with extreme open / close or high / low prices.
This indicator plots 2 lines. The Blue line simply depicts extreme price movements with in that bar regardless of the initial opening price of the closing price of the bar. This allows you to get an insight into the current volatility of the price at that time in the market. Quite often big price swings with in bars are missed as people pend to tunnel vision on the open or close price - or other indicators derived from open / close.
The Red line is similar to the blue bar as it depicts extreme price movements with in the bar , but it will show the direction the market moved in by the close of the bar - and relatively how much the market moved. This is helpful for spotting breakout price action or short term spikes. Quite often after a breakout the market will restore itself to an equilibrium in the opposite direction. Sometimes this happens with an opposing aggressive spike , some times it makes a steady return to a known price level. Either way its a great time to place entry orders if you are looking to turn a fast profit or alternatively a good warning of forth coming price volatility.
Here are some tips for analysing the red and blue lines :
1)If the red line is pointing upwards , this indicates a sharp rise in the price.
2)If the red line is pointing downwards , this indicates a sharp fall in the price.
3)If the red line is flat but the blue line is spiked in either direction - this indicates the price was volatile with in the bar , but the price closed relatively near to the surrounding price bars. Perhaps a limit / stop triggered by this kind of activity - this is an easy way to determine why and re-enter.
4)If the red and the blue lines are flat - the price is steadily moving with a trend or trading sideways in a confined range.
Trendlines with Breaks Oscillator [LuxAlgo]The Trendlines with Breaks Oscillator is an oscillator based on the Trendlines with Breaks indicator, and tracks the maximum distance on price from bullish and bearish trendline breakouts.
The oscillator features divergences and trendline breakout detection.
🔶 USAGE
This tool is based on our Trendlines with Breaks indicator, which detects bullish and bearish trendlines and highlights the breaks on the chart. Now, we bring you this tool as an oscillator.
The oscillator calculates the maximum distance between the price and the break of each trendline, for both bullish and bearish cases, then calculates the delta between both.
When the oscillator is above 0, the market is in an uptrend; when it is below 0, it is in a downtrend. An ascending slope indicates positive momentum, and a descending slope indicates negative momentum.
Trendline breaks are displayed as green and red dots on the oscillator. A green dot corresponds to a bullish break of a descending trendline, and a red dot corresponds to a bearish break of an ascending trendline.
The oscillator calculation depends on two parameters from the settings panel: short and long alpha length. These parameters are used to calculate a synthetic EMA with a variable alpha for both bullish and bearish breaks. The final result is the difference between the two averages.
As shown in the image, using the same trend detection parameters but different alphas can produce very different results. The larger the alphas, the smoother the oscillator becomes, detecting bigger trends but making it less reactive.
This tool features the same trendline detection system as the Trendlines with Breaks indicator, which is based on three main parameters: swing length, slope, and calculation method.
As we can see in the image above, the data collected for the oscillator calculation will be different when using different parameters. A larger length detects larger trends. A larger slope or a different calculation method also impacts the final result.
🔹 Signal Line
The signal line is a smoothed version of the oscillator; traders can choose the smoothing method and length used from the settings panel.
In the image, the signal line crossings are displayed as vertical lines. As we can see, the market usually corrects downward after a bearish crossing and corrects upward after a bullish crossing.
Traders can choose among 10 different smoothing methods for the signal line. In the image, we can see how different methods and lengths give different outputs.
🔹 Divergences
The tool features a divergence detector that helps traders understand the strength behind price movements. Traders can adjust the detection length from the settings panel.
As shown in the image, a bearish divergence occurs when the price prints higher highs, but the momentum on the histogram prints lower highs. A bullish divergence occurs when the price prints lower lows, but the histogram prints higher lows.
By adjusting the length of the divergence detector, traders can filter out smaller divergences, allowing the tool to only detect more significant ones.
The image above depicts divergences detected with different lengths; the larger the length, the bigger the divergences are detected.
🔶 SETTINGS
🔹 Trendlines
Swing Detection Lookback: The size of the market structure used for trendline detection.
Slope: Slope steepness, a value of 0 gives horizontal levels, values larger than 1 give a steeper slope
Slope Calculation Method: Choose how the slope is calculated
🔹 Oscillator
Short Alpha Length: Synthetic EMA short period
Long Alpha Length: Synthetic EMA long period
Smoothing Signal: Choose the smoothing method and period
Divergences: Enable or disable divergences and select the detection length.
🔹 Style
Bullish: Select bullish color.
Bearish: Select bearish color.

DEMA Flow [Alpha Extract]A sophisticated trend identification system that combines Double Exponential Moving Average methodology with advanced HL median filtering and ATR-based band detection for precise trend confirmation. Utilizing dual-layer smoothing architecture and volatility-adjusted breakout zones, this indicator delivers institutional-grade flow analysis with minimal lag while maintaining exceptional noise reduction. The system's intelligent band structure with asymmetric ATR multipliers provides clear trend state classification through price position analysis relative to dynamic threshold levels.
🔶 Advanced DEMA Calculation Engine
Implements double exponential moving average methodology using cascaded EMA calculations to significantly reduce lag compared to traditional moving averages. The system applies dual smoothing through sequential EMA processing, creating a responsive yet stable trend baseline that maintains sensitivity to genuine market structure changes while filtering short-term noise.
// Core DEMA Framework
dema(src, length) =>
EMA1 = ta.ema(src, length)
EMA2 = ta.ema(EMA1, length)
DEMA_Value = 2 * EMA1 - EMA2
DEMA_Value
// Primary Calculation
DEMA = dema(close, DEMA_Length)
2H
🔶 HL Median Filter Smoothing Architecture
Features sophisticated high-low median filtering using rolling window analysis to create ultra-smooth trend baselines with outlier resistance. The system constructs dynamic arrays of recent DEMA values, sorts them for median extraction, and handles both odd and even window lengths for optimal smoothing consistency across all market conditions.
// HL Median Filter Logic
hlMedian(src, length) =>
window = array.new_float()
for i = 0 to length - 1
array.push(window, src)
array.sort(window)
// Median Extraction
lenW = array.size(window)
median = lenW % 2 == 1 ?
array.get(window, lenW / 2) :
(array.get(window, lenW/2 - 1) + array.get(window, lenW/2)) / 2
// Smooth DEMA Calculation
Smooth_DEMA = hlMedian(DEMA_Value, HL_Filter_Length)
🔶 ATR Band Construction Framework
Implements volatility-adaptive band structure using Average True Range calculations with asymmetric multiplier configuration for optimal trend identification. The system creates upper and lower threshold bands around the smoothed DEMA baseline with configurable ATR multipliers, enabling precise trend state determination through price breakout analysis.
// ATR Band Calculation
atrBands(src, atr_length, upper_mult, lower_mult) =>
ATR = ta.atr(atr_length)
Upper_Band = src + upper_mult * ATR
Lower_Band = src - lower_mult * ATR
// Band Generation
= atrBands(Smooth_DEMA, ATR_Length, Upper_ATR_Mult, Lower_ATR_Mult)
15min
🔶 Intelligent Flow Signal Engine
Generates binary trend states through band breakout detection, transitioning to bullish flow when price exceeds upper band and bearish flow when price breaches lower band. The system maintains flow state persistence until opposing band breakout occurs, providing clear trend classification without whipsaw signals during normal volatility fluctuations.
🔶 Comprehensive Visual Architecture
Provides multi-dimensional flow visualization through color-coded DEMA line, trend-synchronized candle coloring, and bar color overlay for complete chart integration. The system uses institutional color scheme with neon green for bullish flow, neon red for bearish flow, and neutral gray for undefined states with configurable band visibility.
🔶 Asymmetric Band Configuration
Features intelligent asymmetric ATR multiplier system with default upper multiplier of 2.1 and lower multiplier of 1.5, optimizing for market dynamics where upside breakouts often require stronger momentum confirmation than downside breaks. This configuration reduces false signals while maintaining sensitivity to genuine flow changes.
🔶 Dual-Layer Smoothing Methodology
Combines DEMA's inherent lag reduction with HL median filtering to create exceptional smoothing without sacrificing responsiveness. The system first applies double exponential smoothing for initial noise reduction, then applies median filtering to eliminate outliers and create ultra-clean flow baseline suitable for high-frequency and institutional trading applications.
🔶 Alert Integration System
Features comprehensive alert framework for flow state transitions with customizable notifications for bullish and bearish flow confirmations. The system provides real-time alerts on crossover events with clear directional indicators and exchange/ticker integration for multi-symbol monitoring capabilities.
🔶 Performance Optimization Framework
Utilizes efficient array management with optimized median calculation algorithms and minimal variable overhead for smooth operation across all timeframes. The system includes intelligent bar indexing for median filter initialization and streamlined flow state tracking for consistent performance during extended analysis periods.
🔶 Why Choose DEMA Flow ?
This indicator delivers sophisticated flow identification through dual-layer smoothing architecture and volatility-adaptive band methodology. By combining DEMA's reduced-lag characteristics with HL median filtering and ATR-based breakout zones, it provides institutional-grade flow analysis with exceptional noise reduction and minimal false signals. The system's asymmetric band structure and comprehensive visual integration make it essential for traders seeking systematic trend-following approaches across cryptocurrency, forex, and equity markets with clear entry/exit signals and comprehensive alert capabilities for automated trading strategies.
