CSPDMost Advanced & Accurate CandleStick Pattern Detector
Looking All Over of All Markets for All Important Powerful Reversal | Corrective Patterns (25 type)
Filtering the Results with Optional Features like Oscillator, Bollinger Bands, Volume Confirmation, Prior and Following Candles Confirmation which are Fully Customizable.
With this you can detect:
Hammer | Shooting star
Inverted Hammer | Hanging
Long legged Doji | Dragonfly Doji | Gravestone Doji
Bullish tweezers | Bearish tweezers
Bullish inside bar | Bearish inside bar
Bullish three line strike | Bearish three line strike
Bullish engulfing | Bearish engulfing
Piercing line | Dark cloud cover
Bullish abandoned baby | Bearish abandoned baby
Morning star | Evening star
Three white soldiers | Three black crows
*Bullish kayo | *Bearish kayo
Features:
Prior and Following candles Confirmation
You can set prior and following candle as basic prerequisites for marking candles as pattern to make sure you are at the top or bottom of the trend.
Volume confirmation
You can active volume increasing confirmation for some of pattern with adjustable increase % relative to prior candle | candles.
Oscillator Confirmation
Active oscillator confirmation. Select your approved oscillator from list (Stochastic, RSI, StochRSI, MFI, StochMFI) then enter desired value for marking candles as bullish | bearish pattern.
Bollinger Bands Confirmation
Active BB confirmation. Configure your Bollinger Bands. Now only see the patterns which reached or crossed from Bands. Also you can enable BB clod to have your BB indicator at the same time.
Adjustable Flexibility and Precision
You can set tolerance% for Osc and BB Confirmation - each one separately - for more control.
Self-adaptability
The properties of markets change over time, for example the amplitude of fluctuations and the intensity of movements. The script is designed in such a way that you can examine the price history as a benchmark for changes in market properties to adopt determinants. Also you can control those manually.
Self-regulatory
The user has the ability to change input factors depending on their point of view.
Behind the pattern recognition algorithms, there are relationships and similarities in their appearance that cause them to be influenced by each other. Simultaneously with changing the determining factors of each pattern by you, script automatically adjusts other details in accordance with your changes.
Alerts
You can set for type of pattern or each one of pattern have been detected.
Fully Costumizable
All of these options can be change and adjust.
Note 1.
The patterns are based on extensive study of reference and famous sources and the experience of me and my friends in trading and analysis with price action methods.
Note 2.
Due to the Pine limitations in the number of outputs | plots for each script, our attempt has been made to select the best and most important patterns.
Note 3.
So far, many scripts have been written in this field, but our experience with all of them and even the build in version was not satisfactory, and this was the initial motivation for making the script.
We strive to improve progress and elimination of shortcomings and we will continue to make this better.
Note 4.
Through personal experience and based on the principles of market and candlestick psychology, we discovered a new type of pattern and named it as Kayo.
kayo is a two candle pattern which formed when:
1.We have a pivot point with prior candles as left bars and following candles as right bar. Pivot candle called as second candle.
2.In a bullish kayo, first candle must closed descending and second candle must closed as ascending. For bearish kayo vise versa.
3.In a bullish kayo, second candle's lower wick must be longer then upper wick.
4. A pattern marked as kayo when its conditions do not correspond to any of the other patterns(include the confirmation that user added), ie it has the last naming priority over the other patterns.
Note 5.
When you active confirmation options for patterns like hammer, engulf and etc which they conditions are like kayo in some extent, if they can't pass the confirmation steps, they can be marked as kayo pattern.
Note 6.
If you active volume confirmation for Three white soldiers | Three black crows, the confirmation get passed if the volume of forth or third candle increased as value as entered relative to volume EMA3 of 3 candles.
Note 7.
In a bullish pattern all highs of following candles MUST be higher than prior highs and all lows of following candles MUST be higher than prior lows. For bearish patterns vise versa.
This type of confirmation depends on High and Low NOT close!
Gift to price action lovers!
Support us with your like and comments. let us know your experience, points and idea to make this better together.
ค้นหาในสคริปต์สำหรับ "bollingerband"

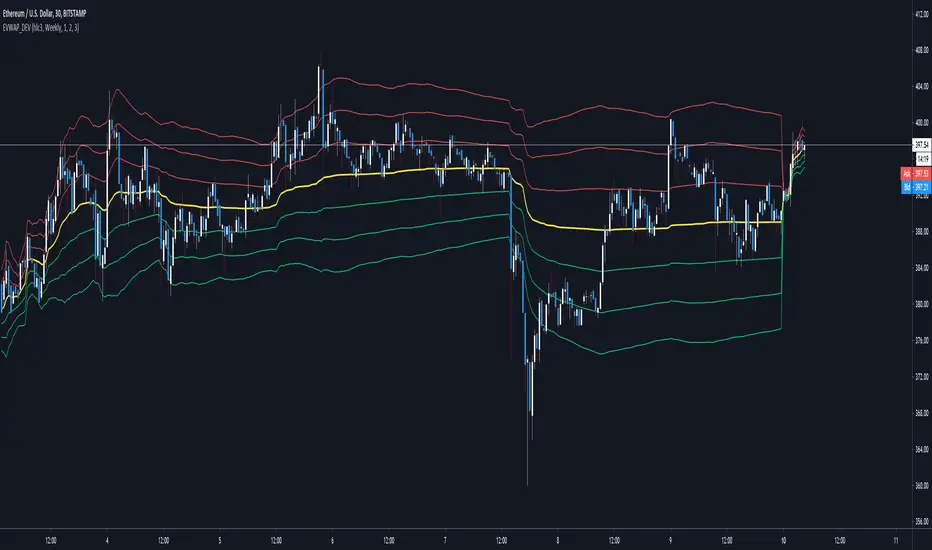
G-RSI&EMA channel v.1This my 2nd indicator : It's just a Strenghtening of trend channal
If price can come up on the green line it's mean price is side way or maybe bullish
and if price can come up on RSI (14)50 and EMA50 it have problaby to bullish trend
If the price have blue ball it's mean crazy strong bullish trend
If the price have red ball it's mean crazy strong bearish trend
you can use my 1st script together : 1st is " G-Bollingerbands Volatility breakout "
My 1st script detect the price begin to have volatility
My 2nd scrit detect the trend
Goodluck :D
PS: My 2nd script develop from someone in tradingview RSI script i'm sorry I can't remember but thank you very much.
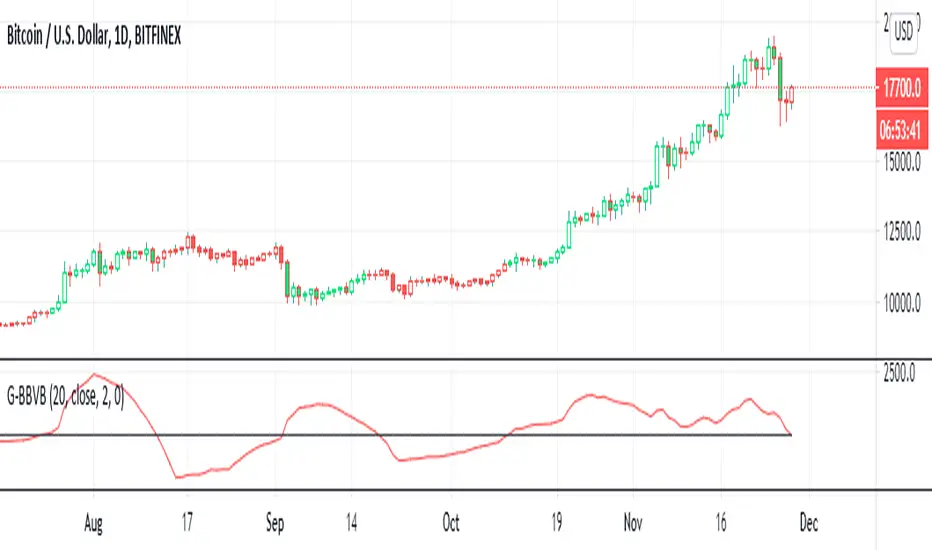
G-Bollinger bands volatility breakout v.1This is my frist publish scrpit. I developed this indicator origin is BB. It make from easy idea but powerful for sideway to breakout
1. I findout volatility by upper band of BB - lower band of BB (I called "Aline")
2. I created SMA of Aline (I called Bline)
3. I created the special line is "Cline" from Aline - Bline
4. I created 0 line " Baseline "
G-BBvB is the very good indicator to detect low volatility to begin the volatility = Buy signal
Now I can't find the sell signal form indicator. I try backtest sell at Cline cross zeroline but it not work.
I'll develop "G" indicator for free .
Goodluck :D
Mulitple Bollinger Bands with MAsIn this indicator, I used Bollinger Bands and many standard deviation values together. These values are: 0.618 (Yellow), 1, 1.618 (Yellow), 2, 2.618 (Yellow), 3, 3.618 (Yellow), 4, 4.618 (Yellow). Like the indicator I just published, I also added multiple moving average options for the Bollinger Bands calculation. You can create your own strategies for where it bounces in ups and downs.
Türkçe:
Bu indikatörde Bollinger Bantları ile birçok standart sapma değerini birlikte kullandım. Bu değerler: 0.618 (Sarı), 1, 1.618 (Sarı), 2, 2.618 (Sarı), 3, 3.618 (Sarı), 4, 4.618 (Sarı). Daha yayınladığım indikatör gibi burada da Bollinger Bantları hesaplaması için birden çok hareketli ortalama seçeneği de ekledim. Yükseliş ve düşüşlerde sektiği yerler için kendi stratejileriniz oluşturabilirsiniz.

BBofVWAP with entry at Pivot PointThis strategy uses BB of VWAP and Pivot point to enter and exit the Long position.
settings
BB length 50
BB Source VWAP
Entry
When VWAP crossing up BB midline and price/close is above weekly PivotPoint ( you can also use Daily pivot point )
Exit
When VWAP is crossing down BB lower band
Stop Loss
Stop loss defaulted to 5%
Note : Long will position will be exited on either VWAP crossing down BB lower band or stop loss is hit - whichever comes first . Being said that some time your stop loss exit is less than 5% which saves from more losses.
Entry is based on weekly Pivot point , so any time frame below weekly will work perfect. I have tested t on 30 min , 1 HR , 4 Hr , Daily charts. Even weekly setting shows good results , that will work for long term investing style.
if you change Pivot period to Daily , chose time frames below Daily.
I also noticed this strategy mostly do not enter Long position in a down trend. Even it finds one , it will be exited with minimal loss.
Warning
For the use of educational purposes only

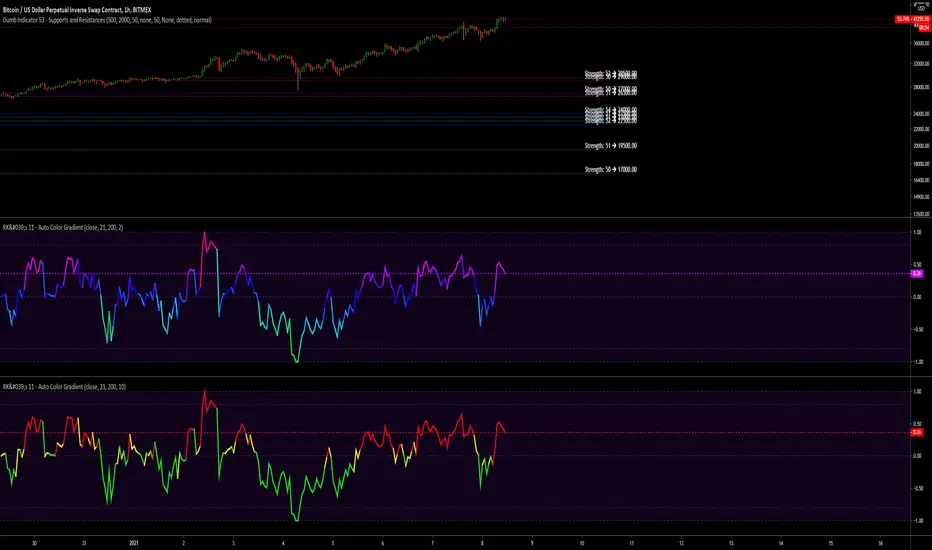
RK's Framework 01 - Auto Color GradientThis started as a personal arrays study, but after a few tests I decided to made a framework to get my own scripts simplest, lighter and faster.
And now I'm sharing with you guys.
Is very simple to use:
Copy evething inside "RK's Auto Color Gradient Framework" block;
Paste anywhere before the plotting;
Declare the color variable name calling the function "f_autocolor(___, ___)" with the source you gonna plot and the size of the scale do you want to use to compare the data.
Feel free to use.
Hope brings some profits for you guys!!
Spread Entry StrengthThis is an overlay indicator showing a strong potential for entry into an option spread trade.
2 background shadings will occur:
The background will shade blue if the ticker is prime for a Bullish Call spread.
The background will shade purple if the the ticker is prime for a Bearish Put spread.
In theory, if the SE Strength is at one of the extremes of the Bear or Bull side, then a spread is prime for entry.
To calculate this, 8 conditions receive a 1 or zero dependent on whether the condition is true (1) or false (0), and then all of those are summed. The primary gist of the strength comes from Nishant's book, or my interpretation thereof, with some additives that limits what I need to review (such as condition 8 below.)
The 8 Bull Conditions are:
1) Bollinger Bands are outside of the Keltner Channels
2) ADX is trending up
3) RSI is trending up
4) -DI is trending down
5) RSI is under 30
6) Price is below the lower Keltner Channel
7) Price is between the lower Bollinger Band and the Bollinger basis.
8) Price at one point within the last 5 bars was below the lower Bollinger Band
The 8 Bear Conditions are the inverse conditions (except the first):
1) Bollinger Bands are outside of the Keltner Channels
2) ADX is trending down
3) RSI is trending down
4) +DI is trending up
5) RSI is over 70
6) Price is above the upper Keltner Channel
7) Price is between the upper Bollinger Band and the Bollinger basis.
8) Price at one point within the last 5 bars was above the upper Bollinger Band
There is a "market noise" filter that will filter out shading when another market move is considered, i.e. if you don't want to see the potential trade when QQQ moves more than 1% then do the following in the settings:
Check "Market Filter"
Enter QQQ in the "Market Ticker To Use"
Enter 1 in the "Market Too Hot Level"
Press Ok
Obviously, the same holds true for the "Market Too Cool Filter."

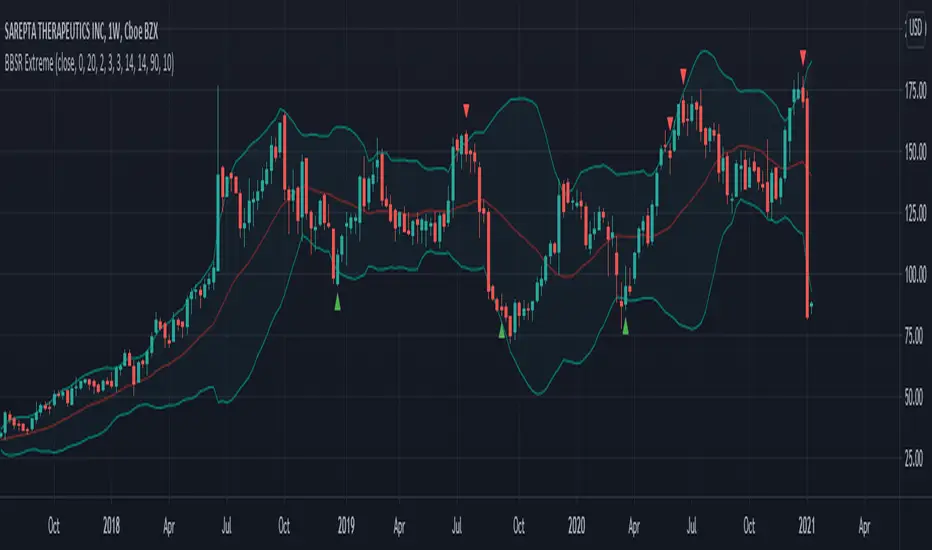
Bollinger Bands Stochastic RSI Extreme SignalThis is the finalized code released to the public that I created in a video linked here.
This indicators combines a Bollinger Band and Stochastic RSI to produce signals for possible price reversal. The signals are displayed by default as green arrows for bullish and red arrows for bearish.
To trigger a signal the indicator checks for the following:
(Bullish)
A candle closes above the upper Bollinger Band
The following candle closes within the upper Bollinger Band
The RSI Stochastic is below the set threshold (10 by default)
(Bearish)
A candle closes below the lower Bollinger Band
The following candle closes within the lower Bollinger Band
The RSI Stochastic is above the set threshold (90 by default)
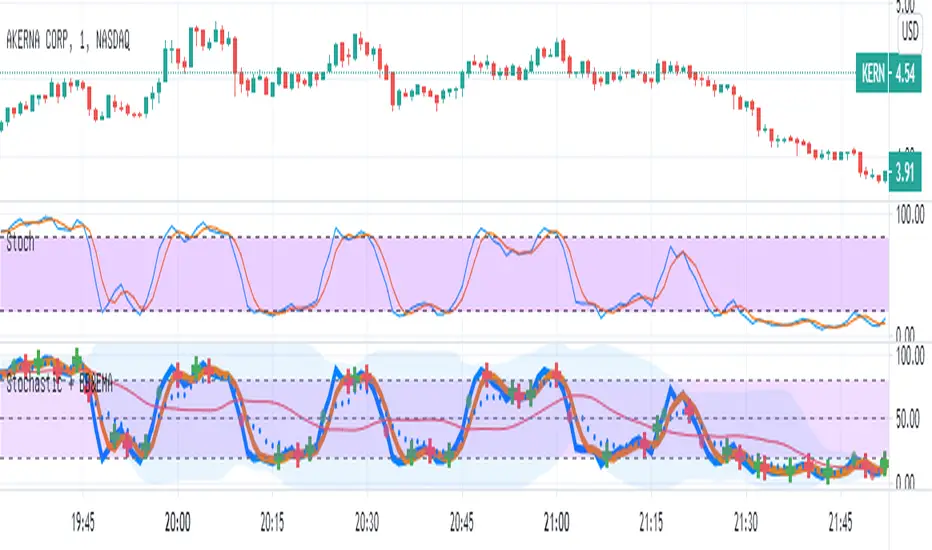
Stochastic with Bollinger & EMAIn this script
I combined the various of the oscillator
Stochastic (STOCH) with BB (Bollinger Bands).
Each cut of K and D creates a mark (+) Red / green - accordingly.
As the Stochastic (K) crosses the BB base, a green / red point is formed accordingly.
As a sign it is possible to continue up / down.
I added EMA8 to K (style circles)
When the oscillator is above the EMA - it is possible that this is a clear sign of an increase.
Band 50 was also added to facilitate the calculations.
MFI & EMA & Bollinger BandsIn this script
I combined the various of the oscillator
MFI ( Money Flow Index ) with BB ( Bollinger Bands ).
As the MFI crosses the BB base, a green / red point is formed accordingly.
As a sign it is possible to continue up / down.
I added EMA8 to MFI (style circles)
When the oscillator is above the EMA - it is possible that this is a clear sign of an increase.
Band 50 was also added to facilitate the calculations.

Horcrux OscilatorDoes your oscilator give exit signal on time? Mine does. However worst the idea is, I had to come up with a horcrux plan :P
Concept is as below:
I use 7 standard deviation Bollinger bands to identify which level current price is in. Standard deviations used are from 0.5 (lowest level) to 3.5(highest level) with 0.5 step . This creates overall 16 levels ranging from 0 to 15 with 0 being the highest level and 15 being the lowest.
LookbackPeriod is used to calculate max and min values of these threshold over certain bars. Average of max and min constitutes threshold.
Horcrux value is difference between max state and current state in LookbackPeriod.
Lower the horcrux much closer the current state to the highest state. Hence, horcrux higher than threshold is considered as green region where prices are moving up. Decrease in number of horcruxes means price state moving closer to highest state (which is the lower level). Hence, indicates reduced momentum or reversal.
Use higher LookbackPeriod for increased accuracy. Increase BBLength for long term trades. Adjustment is used to adjust threshold line by up to + or - 20%

Stock Market Strategy : VWAP, MACD, EMA, Breakout, BBHello there,
Today I bring you a stock market strategy, specialized in NASDAQ stocks.
Its a daytrading strategy, that can only do a max of 1 trade per day. In this case it only trades the first 2 opening hours of the market.
The rules are simple :
We follow the trend based on a big EMA, in this case 200, after that, we check for VWAP direction , then, we check histogram from MACD. This is the simple logic of the strategy.
Inside there is another strategy, that not just do the above, but also uses Bollinger bands, and checks for breakout of bottom or top line. Also it uses Average directional Index, for even a bigger criteria .
So for example a long condition it would be : candle is above the ema, and candle is above vwap, and histogram is positive, and candle break the top bb level and ADI < 40 -> long signal . The opposite works for short(ADI > 20).
In this case all this criterias are between the first 2 hours of market. So we enter between the first hour, and exit in the next hour. For this we need to use very short time frames.
Hope you enjoy it.
Let me know if you have any questions

Bollinger Bands and RSI mix with DCAThis strategy uses a mix of Bollinger Bands and RSI to enter long positions. It impliments DCA.

Moving Average, T3 and Bollinger StrategyThis strategy uses a SMA much like an the faster EMA in many oscillators and the T3 average of the same period as the intermediate trend. Exits are defined by encounters with the Bollinger Band. The long term trend is defined by T3 moving averages of an even longer period.

Ultimate VWAP Bands- Ultimate VWAP Bands is a script that helps to decide and further clarify areas of oversold and overbought conditions.
- For example, when the price is in the lowest band it is extremely oversold relative to the VWAP . Hence it should be considered a good place to buy with a high risk to reward payoff.
- Each band is set at a fixed offset away from the VWAP . The "VWAP Band Multiplier" adjusts this and is a key part of the script. This allows the indicator to be adjusted based on the assets volatility . For example, with Crypto. A multiplier of 1 would be strongly advised. Whilst a multiplier of 0.1-0.25 would be useful for currency pairs.
- This indicator can be used for all manners of trading. However, it is most effective when used for scalping and swing trading.

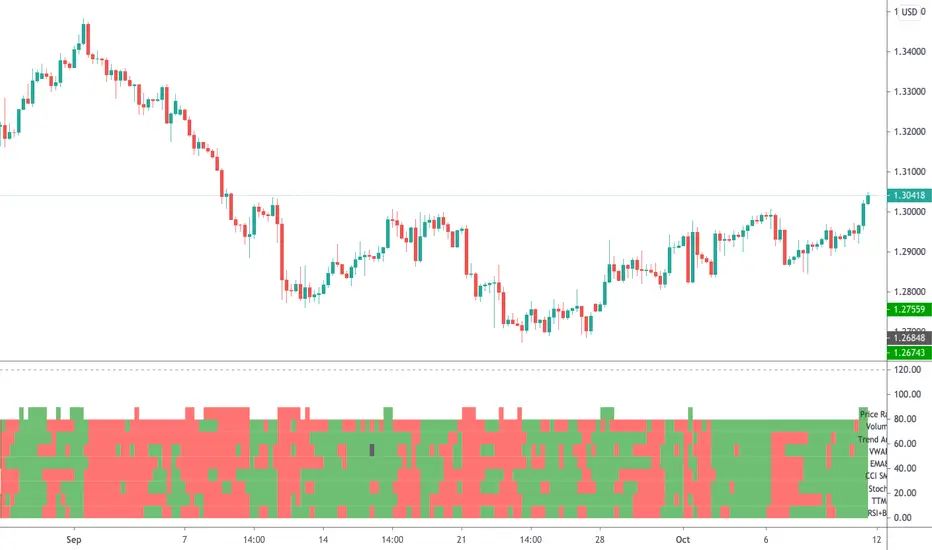
Radar Screen v3This is a combination of various indicators that very rarely conflict, thus giving us a good understanding:
- "Price Rally" detecting whether price is rallying, giving us confidence it will continue.
- Volume - knowing volume is going with the trend is a good confidence check.
- Trend Angle - This will go red or green depending on whether the price angle is going up or down, taken over three bars.
- VWAP for all of these stock traders.
- EMA8 is a very sensitive moving average, good for short term trades.
- CCI SMA is a strategy I commonly use, please check out my other indicators for a functional description.
- Stochastics is used throughout many systems.
- RSI BB shows where price is rebounding of the bollinger band and then moving up or down.
As per all of my indicators, the system is simple - The more green lines you see, the stronger the buy signal. The more red lines you see, the stronger the sell. If its a 50/50 mix of red and green, then don't trade.
I can customise this further or add other strategies, please message me.
Volatility Bands by DGTVolatility represents how large an asset's prices swing around the mean price, the degree of variation of a trading price over time, and is commonly measured with beta (β) coefficients, standard deviations (σ) of returns where tools such as Average True Range, Bollinger Bands, Keltner Channel, Squeeze Indicator, etc presents volatility concept
Volatility often refers to the amount of uncertainty or risk related to the size of changes in a security's value. The higher the volatility, the riskier the security - the price of the security can change dramatically over a short time period in either direction. A lower volatility - security's value does not fluctuate dramatically, and tends to be more steady
This study, Volatility Bands , attempts to present a way to measure and visualize volatility , using standard deviations (σ) and average true range indicator, and aims to point out areas that might indicate potential trading opportunities
I will try to explain the usage with examples,
same setup with different option selected
as you may observe from the examples different setting may have advantages and disadvantages over one another, it is recommended to verify a trading setup with different available options.
Additionally, It is recommended to use this indicator in conjunction with other technical indicators, or verify using chart/candle patterns. Below is an usage example using in conjunction with other indicator, in the given example “Neglected Volume by DGT” is selected
Similarities and Differences
Bollinger Bands depicts two standard deviations above and below a simple moving average, and Keltner Channel depicts two times average true range (ATR) above and below an exponential moving average
Volatility Bands study combines the approach of both Bollinger Bands and Keltner Channel, with different settings and different visualization
Default settings are one standard deviations and one time average true range (ATR) above and below 13 period exponential moving average. Setting can be adjusted by users but let me remind all testes are performed with the default settings.
Mathematically expressed as
Upper band area between “ema + stdev” and “ema + atr”
Lower band area between “ema – stdev” and “ema – atr”
A different display is added with the inspiration I get from one of the @quantgym ‘s study, many thanks @quantgym 😉
When difference band display is selected the study will reflect the area between “ema + stdev – atr” and “ema – stdev + atr”. As shown in the examples above
Note: standard deviation calculation can be adjusted based on price action or its moving average.
Other differentiation between BB and KC is with V-BANDS mostly we look for trade opportunities when price action move out of the bands and in most cases we assume market is consolidating when the price action is within the bands
The other indicator that presents similarities to Volatility Bands is Squeeze Indicator, which measures the relationship between Bollinger Bands and Keltner's Channels to help identify consolidations and signal when prices are likely to break out. Mainly Volatility Bands is different version of Squeeze indicator, in fact the purpose is almost same but visualization is completely different. Additionally Volatility Bands Offers trading opportunities whereas Squeeze indicator only presents market states unless a momentum indicator is adapted to Squeeze indicator.
Disclaimer:
Trading success is all about following your trading strategy and the indicators should fit within your trading strategy, and not to be traded upon solely
The script is for informational and educational purposes only. Use of the script does not constitute professional and/or financial advice. You alone have the sole responsibility of evaluating the script output and risks associated with the use of the script. In exchange for using the script, you agree not to hold dgtrd TradingView user liable for any possible claim for damages arising from any decision you make based on use of the script

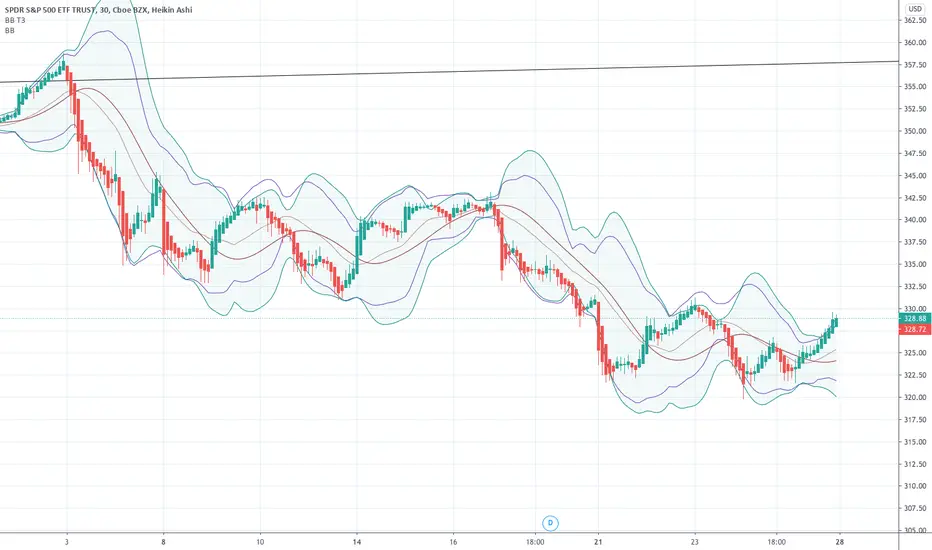
A smoother Bollinger BandThe Bollinger Band is a popular indicator due to it's ability to accurately predict future ranges based on prior volatility. However the bands can fluctuate wildly as a result of acute changes to the price. This results in a channel that is sensitive though replete with sharp angles. Replacing the simple moving average basis line with a Tillson T3 moving average results in a smoother albeit slower basis line. Deriving the bands from partially smoothed data results in more continuous bands than those of the original equation.
GLANTALL AT A DEEP GLANCE
Monitor the whole market at a glance
Give your analysis double-dimensional depth
With the help of this assistant , you can quickly aware about the various dimensions of the market and improve the quality of your trading experience.
Everything is clear in the picture so I will avoid further explanation.
All functions are controllable and highly customizable
Get instantly and accurate report of
Volume
Volume changes
Volume is higher or lower than average
Volume significant increase
2 oscillators of your choice, each one at 4 time frame of your choice, at the same time (Stoch, RSI, StochRSI, MFI, StochMFI)
Selected oscillators changes and direction
Selected oscillators divergences with full coordinate
Bollinger bands
Bollinger bands middle line changes
Bollinger bands width changes and direction
Amount of volatility
4 moving averages as type as your choice at a same time (SMA, EMA, WMA, HMA)
Mark up the moving averages as dynamic support or resistance
Crosses of the 4 averages as type as your choice at a same time (SMA, EMA, WMA, HMA) (completely separately than above mentined MAs) with full coordinate
More than 500 line code.. but Clean and Clear !
Gifts to all of you dear ones.

EMA ICHI BB [Rogulabo]3 indicators in 1.
Included Indicators are:
- EMA 8,13,21,55,100,200,450
- Ichimoku
- Bollinger Band
These can be used to determine changes in trends when:
- EMA's collide, trajectories shift, or certain levels are reached.
- Ichimoku cloud is above or below the candles.
- Bollinger Band's width changes, or range is broken.
Reasons for 3 in 1 assembly:
This indicator is intended to be used by students, and followers of Dan Takahashi
(a prominent educator of investing in Japan who is also a user of TradingView) .
Those who wants to use and learn with the same setup as Dan, would greatly benefit from this since,
the complex setting up process which can be a pain for beginners can be skipped with a simple click.
Every stylistic choice of color and placement were made to make it similar to the chart used by Dan.
Simple customizations are available such as:
- Changing color
- Changing the values
- Hide/show controls
Notes:
This is intended to be used alongside “STOCH RSI ” for the complete the setup.
Any questions, please refer to:
@rogulabo
==
高橋ダンさんが使用されてるチャートと同様のセットアップの為にご活用ください。
複数のインジケータをグループにしておりますので、無料版を使われてる方は効率よく使っていただけると思います。
また、“STOCH RSI ”どいうタイトルのインジケータも同時に公開しておりますので、セットアップを完成させたい方はこちらもご活用ください。
以下のインジケータを含みます。
・EMA線
・一目均等表
・ボリンジャーバンド
カスタマイズされたい方はご自由に値を変更ください。
ご質問は @rogulabo までよろしくお願いいたします。

Configurable BB+RSI+Aroon strategy backtest for binary optionsI wanted to share this strategy that I use myself for binary options trading. After trading binary options for several years I have learned that every single day is unique... assets behave differently every single day. So, when I start the day I want to know which is the optimum combination of parameters in my indicators that will give me the signals I want during the day and I get that by doing a quick backtest of the parameters combination in a specific asset that same day. When trading Binary Options I usually do 3 or 4 trades max per day and, yes, there are moments in which even with the right backtest data the signals fail (I strongly believe that there is no strategy that guarantees 100% success in any type of trade, and this one here is not an exception - but has worked well with some assets). So, here is my contribution to improve your productivity by automating a bit that backtesting part.
How this script works?
It is a simple price crossunder / crossover Bollinger Bands (BB) with a confirmation from RSI overbought / oversold signals and a fast Aroon. You will see the BB plotted with its confirmations:
(1) a blue circle that plots in the chart when the price is coming back inside the channel (within the Bollinger Bands)
(2) an orange square that plots in the chart when the RSI is coming back from the overbought or oversold areas
(3) a triangle that could be red or green depending on the Aroon confirmation: Red if Aroon Down is crossing down Aroon Up or green if vice versa.
The strategy will call for long (Call) if:
(1) the price is crossing over the lower band of the Bollinger Bands, coming back inside the channel
(2) Aroon Up is crossing or has crossed above Aroon Down
(3) RSI is crossing over the oversold limit
Consequently, the strategy will call for a short (Put) if:
(1) the price is crossing down the upper band of the Bollinger Bands, coming back inside the channel
(2) Aroon Down is crossing or has crossed below Aroon Up
(3) RSI is crossing under the overbought limit
You can configure:
1. Aroon length (keep it as fast as possible: 3, 4 or 5 are recommended values)
2. The point where Aroon Up and Aroon Down cross to make the signal valid (50 is by default. It could also be 25 or 75)
3. The RSI length
4. RSI Overbought and Oversold limits (they do not need to be symmetric: you can use 29 and 93, for example)
5. Bollinger Bands length and standard deviation
6. Number of bars to keep your option open. Depending on the timeframe used, this will determine the time you will keep your binary option open. If you are in a 1 min chart and keep this parameter in 3, then you will need to configure your binary option to expire in 3 minutes.
How to evaluate your backtest?
In Binary Options you only need the success rate, so what I do is that when I am manually updating the parameters I keep my strategy tester window open checking the winning trades vs losing trades ratio ("Percent Profitable"). I personally will only keep an asset monitored looking for signals that day if the Percent Profitable on the backtest of the same day is above 80%.
Regarding the code: it is open, public and free. No need to ask for permission if you want to copy+paste and use it in whole or parts.
Happy pip hunting!
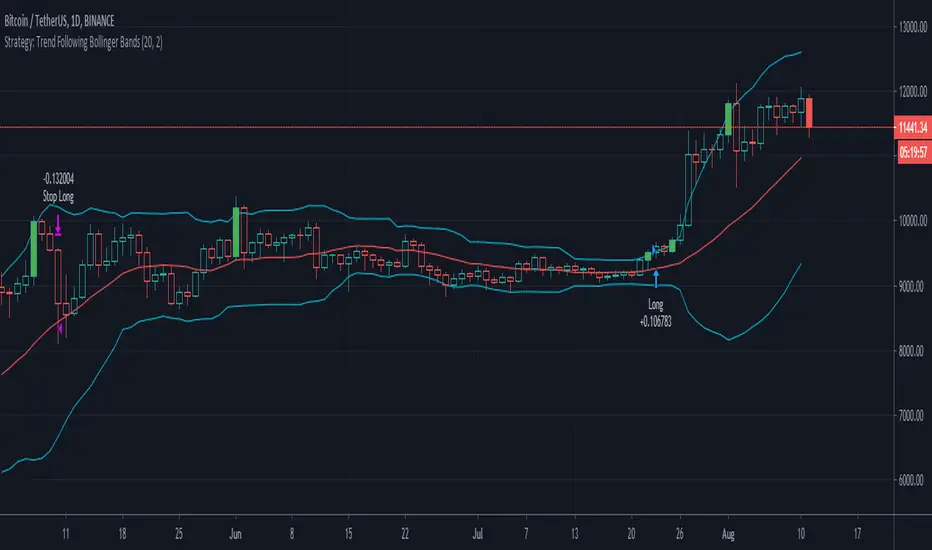
-marco

Setup Trend Following Bollinger Bands - ValenteBuy when the candle closes above upper BB
Sell when the candle closes bellow lower BB
Stop always on base line
Exponential VWAP & DeviationsExponential Volume Weighted Average Price and Deviations.
Selectable intervals (daily/weekly/monthly/yearly vwap). Options to change deviation multipliers and display interval closing values for the previous interval.
Uses volume weighted EMA for the interval as the basis/vwap & exponential deviations calculated using the exponential vwap as the mean.