ค้นหาในสคริปต์สำหรับ "bitcoin"
Bitcoin/DGD CorrelationDoes exactly what it says, shows the correlation between DGDBTC on Binance, with the ticker. Notably has been fairly consistently inverse for quite some time now.

Bitcoin Price CompareDumb, simple script to just toss up BTC's price. I use it to quickly make sure a trend is real or not.

Bitcoin Exchanges Premium FinalIncludes shape alerts for when exchanges have sudden changes vs bitfinex.

Bitcoin Exchanges Premium (Incl Int & GBTC) vs GdaxShows the exchange premiums internationally (Hong Kong, Luxembourg, Korea, Japan, China) vs Gdax. Also includes GBTC Trust price (adjusted).
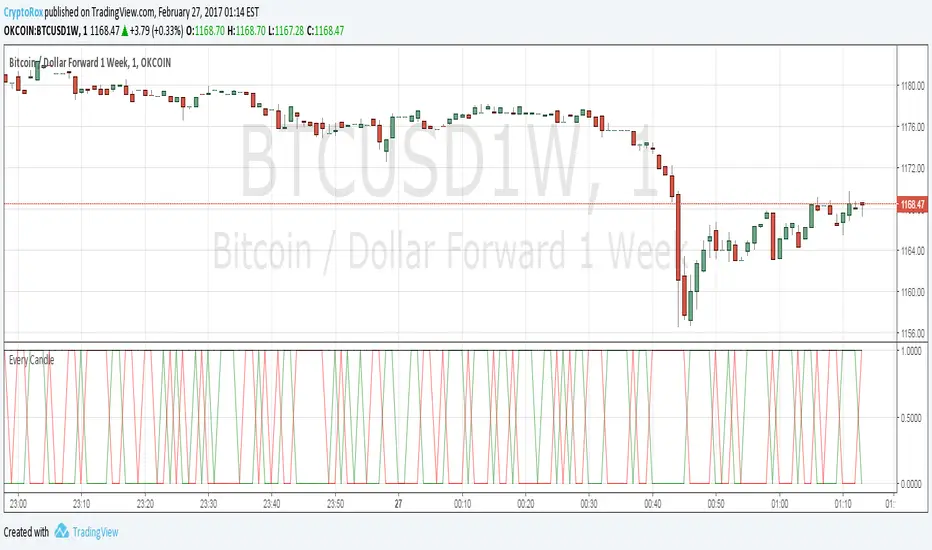
[Autoview] Every Candle Alert ScriptThis script is designed specifically for firing an alert every candle. It can also be used to just fire an alert on a green candle, or a red candle to slow it down a bit.
This is a script we use to close all of our orders or positions on any of the integrated exchanges.
You can use a fire once alert with greater than on condition and the alert will typically fire within seconds. You can also use this to place orders for you without having to navigate away from TradingView to your exchange/brokerage site.
If you would like a better understanding of how to create an alert for automation, please visit the article this strategy is being published for.
use.autoview.with.pink
Tops/BottomsUsing Modified code from Lazybear's CVI 0.17% indicator and some logic, this script can help identify value buy and sell opportunities at a very early phase. Best used as a confirmation tool. This is a beta, so use it as such. Enjoy.
Sometimes "top" indications in an uptrend mean to look for an opportunity to add to position while "bottom" indications during a downtrend can represent the same thing. The trend is your friend, use it to your advantage!
Red star above bar == potential top
Green star below bar == potential bottom


Volume Weighted Market Mean [Dia]Calculate a volume weighted market mean price across various exchanges.
Indicator shows mean values of high, low and ohcl/4, weighted by corresponding volume.
- Optional: display of simple arithmetic mean of prices
- Optional: additional price lines for single exchanges.
- EMA smoothing of results

3BBands (3 Spirolinas)The script combines 3 single Bollinger bands into one script for easy plotting and range modification. It can be used for analyzing a market with multiple time frames and ranges using Fibonacci series as the range.

KK_Price Action Channel (TDI BH)Hey guys,
this little script is an addition to another one I will release right after this.
This is the Price Action Channel. The bands are calculated using a smoothed moving average of the highs/lows. I have taken the smoothed moving average script from the public library in order to create this, so all props to whoever created that one.
I am fairly new to creating scripts so use it with caution and let me know what you think!
EDIT: Here is the script I have written this one for:

Bitcoin Index vs. Futures OKCoin WeeklySimple adaptation to lastbattles script to add calculation for index price: calculation can be seen here: www.okcoin.com
I recommend setting it to columns, and setting price at 0, 0 to see divergence of sell/buy.


S3-ZMACDHere's a modified MACD which uses ZL calculation for the emas, phi adjustment to the fast signal and an optimized period set. It useful because it will give predictive signals for many setups.

BTC - Sentiment (Posts weighted) LSMABTC - Sentiment (Posts Weighted) LSMA | RM
Concept
In the current 2026 market regime, Bitcoin has transitioned into a mature institutional asset. However, retail "Social Liquidity" remains the primary driver of local volatility and blow-off tops. This script serves as a deterministic proxy for crowd conviction, utilizing the LUNARCRUSH:BTC_SENTIMENT feed to identify when social hype has decoupled from fundamental value.
Data Source: LunarCrush Integration
This model utilizes the native LunarCrush data prefix. Unlike simple "mention counts," the BTC_SENTIMENT metric is a percentage-based value (0-100%) representing the "Sentiment of positive posts weighted by interactions."
• Interactions vs. Volume: By weighting sentiment by interactions (likes, shares, comments), the data filters out bot-driven "spam" and focuses on what real participants are actually engaging with.
• Meaning of the Value: 100% indicates that every single interaction-weighted post is positive; 0% indicates total negativity. Historically, BTC sentiment rarely drops below 60% or stays above 90% for long, creating a predictable mean-reverting corridor.
Technical Architecture
• The LSMA Denoising Engine Raw social data is inherently "jittery." To extract a tradable signal, we apply a Least Squares Moving Average (LSMA) with a 28-day lookback.
• Mathematical Advantage: Unlike a Simple Moving Average (SMA), the LSMA calculates a linear regression line for each period to find the "best fit." This allows the indicator to track the velocity of sentiment shifts with significantly less lag, which is critical for identifying "Social Exhaustion" before a price reversal occurs.
• The Social Heat Index (SHI) Calculation: To align this data with the broader Rob Maths ecosystem, we normalize the LSMA output into a standardized 0–10 score using a Linear Feature Scaling (Min-Max) formula: SHI = ((Current LSMA - 65) / 25) * 10 ; This formula treats 65% as the "Floor" (Apathy) and 90% as the "Ceiling" (Hysteria). This 0–10 scale allows for immediate comparison against other institutional risk metrics.
Regime Audits & Usage
• Accumulation (Blue Zone / <72.5%): Social Despair. Retail interest is at a mathematical minimum. Historically, these periods of "Social Apathy" coincide with major local bottoms as institutional "Smart Money" absorbs the lack of retail demand.
• Neutral Zone (Grey): Sustainable growth. Sentiment is within the normal distribution.
• Distribution (Red Zone / >82.5%): Overheated. The crowd is in a state of maximum FOMO. When the SHI exceeds 8.5/10, the risk of a "Liquidity Flush" increases significantly.
Visual Scaling
To ensure the curve is readable, the indicator pane is hard-locked to a 65–90 scale. This prevents the "flat line" effect often seen in 0-100 oscillators and highlights the subtle divergences that occur at cycle peaks.
Disclaimer
Past performance does not guarantee future results. Social metrics are alternative data points and should be used in conjunction with price action and risk management. This is a mathematical model, not financial advice.
Tags
Rob Maths, Rob_Maths, robmaths, Bitcoin, Sentiment, LunarCrush, Quant, LSMA, OnChain, Social Liquidity

BTC Cycle Halving Thirds NicoThe bold black vertical lines are the INDEX:BTCUSD halvings.
The background speak for itself.
Time to be bearish?

BTC Fibonacci DMA350 TrendlinesAdapted from Tim Graham's Code.
See Original Inspiring Article from Phillip Swift at: @positivecrypto
When looking into BITSTAMP:BTCUSD 1D data in spreadsheet. Historically, BTC Highs Hit (Simple Daily Moving Average 350 Days) DMA350 in reverse Fibonacci Sequence Order
2013 Hit DMA350*8 before All Time High (ATH)
2017 Hit DMA350*5 before ATH
I expect 2021 to hit DMA350*3 ATH. When BTC hits DMA350*3 ATH, I suggest selling!
