[STRATEGY] MA Cross ElevenThis script is a crossing of eleven different MA, with alerts and SL and TP.
The simplest is what works best...
SMA --> Simple
EMA --> Exponential
WMA --> Weighted
VWMA --> Volume Weighted
SMMA --> Smoothed
DEMA --> Double Exponential
TEMA --> Triple Exponential
HMA --> Hull
TMA --> Triangular
SSMA --> SuperSmoother filter
ZEMA --> Zero Lag Exponential
Using "once per bar close" repaint is 0%, but if you like risk can choose "once per bar", better profit.
Thanks to JustUncleL and his amazing sripts.
Enjoy!
www.tradingview.com
"Note: When using non-standard (Renko, Kagi, Line Break, Point and Figure, Heikin Ashi, Spread Charts) types of chart as a basis for strategy, you need to realize that the result will be different. The orders will be executed at the prices of this chart (e.g.for Heikin Ashi it’ll take Heikin Ashi prices (the average ones) not the real market prices). Therefore we highly recommend you to use standard chart type for strategies."
ค้นหาในสคริปต์สำหรับ "bar"

BTC Precognition - Mtrl_ScientistHello Everyone,
I have been interested in algorithmic trading for a while now, and have picked up coding in Python/C++ 2 years ago, which made it possible for me to understand Pine Script (Trading View's proprietary language) fairly easily. I got interested in Bitcoin in 2013, but have only started actually investing in mid 2017. Making money during a bull run is easy but it's really the bear market that teaches you a lesson. So I went about and tried to avoid losses in future bear markets by digging into the analysis of financial time series. I looked around and found useful books, examples of pine script code, technical analyses from fellow chartists and sought out to combine it all into algorithms that can help prevent losses during the next bear market.
I came up with several profitable scripts, but let this be the first one I'm actually sharing with you guys. It draws data from all major Bitcoin exchanges (Hence this script will ONLY work for BTCUSD ) and is based on CVI, Fractal Adaptive Moving Avergage ( FRAMA ), and some calculus operations to make sense of their relationship.
I tried to tidy the final version up as much as possible, so that it becomes straightforward to use. All you need to look at is when the bar becomes green/red, the bar height is just the integrated area since it's crossed the 0-line and can serve as a threshold on lower time frames to avoid noise.
I've got a degree in Chemistry, so don't take this as financial advice, but please do let me know what you think!
Note:
- This is a re-upload because the first version got pulled due to linking to Twitter
- Script works best with Hekin Ashi candles
Planned features:
- Reduce amount of signals on lower time frames
- Make it work better with normal candles
Suggestions?

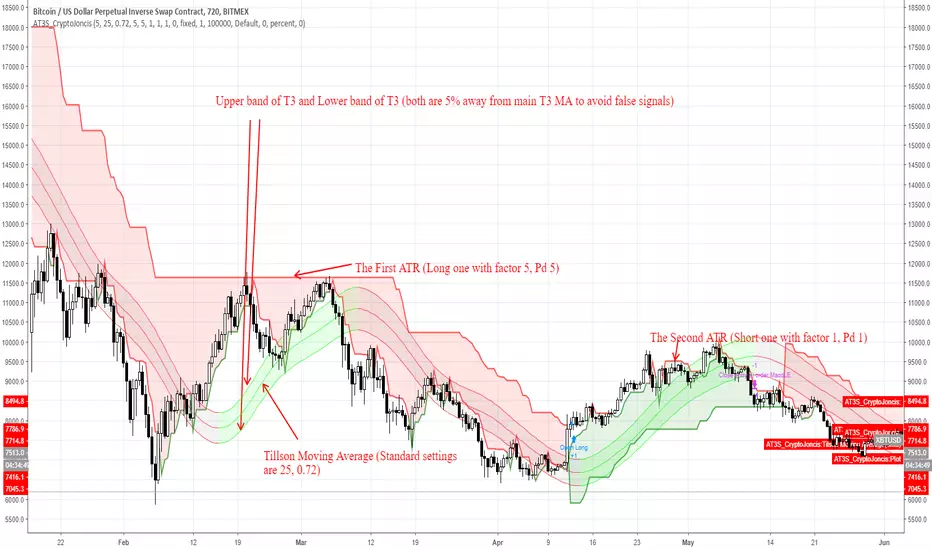
ATR and T3 strategyT3 Moving Average indicator was originally developed by Tim Tillson in 1998/99.
T3 Moving Average is considered as improved and better to traditional moving averages as it is smoother and performs better in trending market conditions.
It offers multiple opportunities when the price is in the state of retracement and therefore allows to minimize your exposed risk and allowing your profits run.
This strategy is for trend followers who are patient enough to have 6-10 trades per year.
What's included in strategy?
Two ATR (Code was taken from J.Dow and modified)
Tillson Moving average
Enter long signal:
When both ATR (Long and Short) are in uptrend and the bar closes above Upper Tillson's moving average band: Enter Long
Exit Long signal:
When hl2 is lower than Lower Tillson Moving Average band
Enter short signal:
When both ATR (Long and Short) are in downtrend and the bar closes below Lower Tillson's moving average band: Enter Short
Exit Shortsignal:
When hl2 is higher than Upper Tillson's Moving Average band
Best to use with Bitcoin on 12H TF
Can be used for different time frames as well but the settings must be adjusted accordingly
Remember, overtrading can be harmful to your trading account.
If this is helpful for you, consider a tip
BTC: 3FiBnveHo3YW6DSiPEmoCFCyCnsrWS3JBR
ETH: 0xac290B4A721f5ef75b0971F1102e01E1942A4578
Created by CryptoJoncis
Coding lesson 1In the strategy of only 6 lines of a program code. It is less just not to make. This script is necessary for training, but not for trade. It isn't recommended to trade using this strategy.
If the price is higher than SMA with the period of 7 bars - to open a long position
If the price is lower than SMA with the period of 7 bars - to open a short position

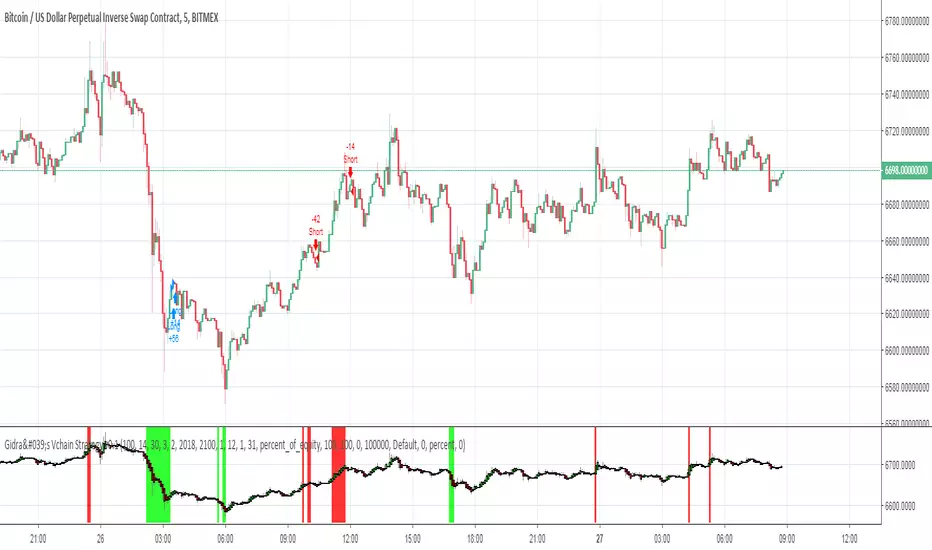
Gidra's Vchain Strategy v0.1Tested on "BTC/USD", this is a reversible strategy
If the RSI is lower than "RSI Limit" (for last "RSI Signals" candles) and there were "Open Color, Bars" green Heiken Ashi candles - close short, open long
If the RSI is higher than 100-"RSI Limit" (for last "RSI Signals" candles) and there were "Open Color, Bars" red Heiken Ashi candles - close long, open short
- timeframe: 5m (the best)
RSI Period = 14
RSI Limit = 30
RSI Signals = 3
Open Color = 2
Piramiding = 100
Lot = 100 %
- timeframe: 1h
RSI Period = 2
RSI Limit = 30
RSI Signals = 3
Open Color = 2
Piramiding = 100
Lot = 100 %
Volatility Backtest The Volatility function measures the market volatility by plotting a
smoothed average of the True Range. It returns an average of the TrueRange
over a specific number of bars, giving higher weight to the TrueRange of
the most recent bar.
You can change long to short in the Input Settings
WARNING:
- For purpose educate only
- This script to change bars colors.

[XBTUSD] - BandTrader - v1A band trading strategy for XBTUSD - not sure how it performs on other symbols.
I tested this strategy with a pyramiding of 5, each consisting of 20000 USD - so total invested is 100,000 USD. Furthermore, I ensured that strategy could not buy more than 2.5% of the volume in previous bar - so as to keep this a bit realistic. So, bye bye to buying 1000 BTC in one bar and reporting wrong results than real. :)
Net profit made is 6200% really, but the equity curve is really smooth. Profits made is still huge, which can be further inflated using leverage.
NOTE: I am available for work on hire. If required, PM me for this. I, also, provide real trading bots for my strategies.

Noro's Hundred Strategy v1.0Strategy uses:
1) Fast RSI (period = 7 bars)
2) Color of bars
Strategy
If RSI less than 30 is also 4 red candles in a row - to open long-position
If RSI more than 70 is also 4 green candles in a row - to open short-position
If long-position is open and there is 1 green candle - to close a position
If short-position is open and there is 1 red candle - to close a position
Only profit
Very dangerous thing! Strategy will close a position only if a position profitable. Most likely you will lose all money if you use this function.

TTM scalper indicator Backtest TTM scalper indicator of John Carter’s Scalper Buys and Sells. The methodology
is a close approximation of the one described in his book Mastering the Trade.
The book is highly recommended. Note the squares are not real-time but will
show up once the third bar has confirmed a reversal.
You can change long to short in the Input Settings
WARNING:
- For purpose educate only
- This script to change bars colors.

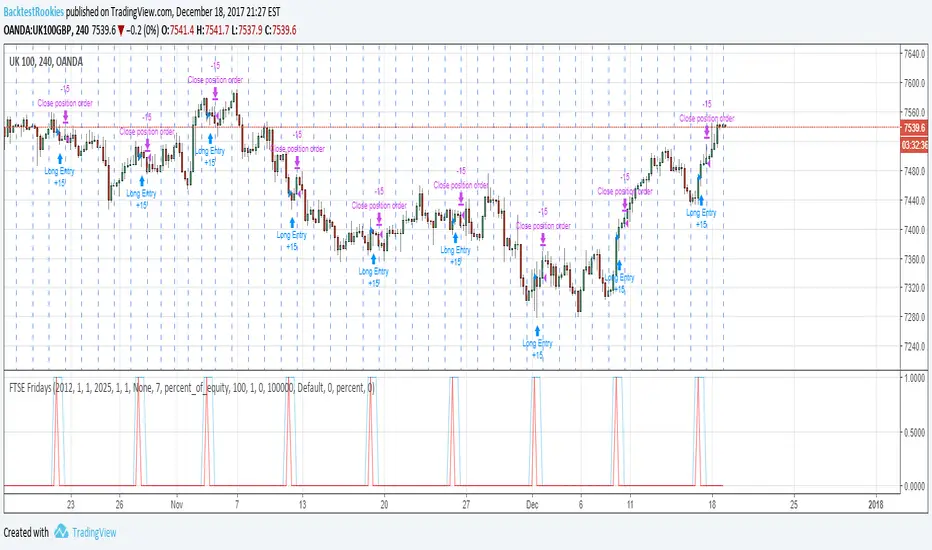
FTSE FridaysThis code snippet below is a quick and dirty follow up to some statistical analysis performed on the FTSE 100. It showed that over the long run, (since 1995) going long on a Friday appeared to have a statistical edge (53%). As a bit of fun, I wanted to create a quick pine script backtest to test this and see if it is possible to profit from it. After all, the index might finish up 53% of the time, but that doesn't mean one can profit from it.
A full commentary to the script and FTSE analysis post can be found on the Backtest-Rookies website. To comply with house rules, I cannot post a direct link here.
Important Note
The script must run on the 4H time frame…..Why? It is a quick and dirty implementation and it relies on entering a long position on the 4H bar before the market opens. This way the position will enter at the open of the market. (Since positions are always opening on the bar following an entry signal).
ema200ct-strategyDeveloper: Andrew Palladino
Date: 9/26/2017
Description: Takes counter trend trades back to the 200 EMA when bars since an EMA 200 touch exceeds a predefined bar count and vertical distance to EMA is large. The trade is closed at the 200 EMA.

Money Flow Indicator (Chaikin Oscillator) Indicator plots Money Flow Indicator (Chaikin). This indicator looks
to improve on Larry William's Accumulation Distribution formula that
compared the closing price with the opening price. In the early 1970's,
opening prices for stocks stopped being transmitted by the exchanges.
This made it difficult to calculate Williams' formula. The Chaikin
Oscillator uses the average price of the bar calculated as follows
(High + Low) /2 instead of the Open.
The indicator subtracts a 10 period exponential moving average of the
AccumDist function from a 3 period exponential moving average of the
AccumDist function.
You can change long to short in the Input Settings
WARNING:
- For purpose educate only
- This script to change bars colors.
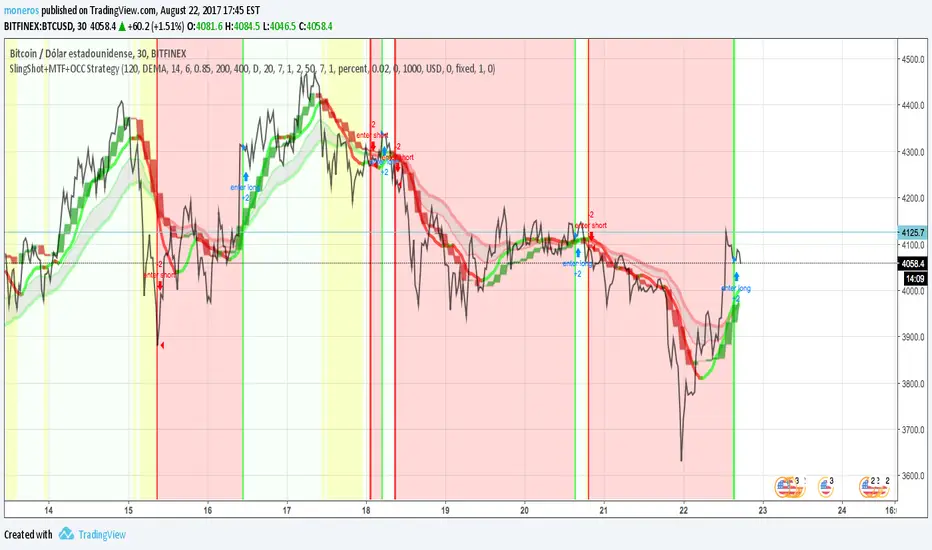
SlingShot + MTF + Open Close Cross StrategyIt's a merge of three really good scripts CM sling shot, CM MTC and Open Close Cross
Indicates open and close with Sling shot and shots after peaks by MTC and OCC.
Yellow zones before drop prices, green bar, red bar for open and close.
imgur.com
HL2 - 22 EMA Cross for RenkoEURUSD
This is a simple strategy to use for those who like Renko bars. I ONLY use it on Renko.
Basic idea is that when the Renko bar closes above or below the 22 EMA, you go long or short.
However, some of the frustrations I've had with any strategy shared in Tradingview is so few folks put in the ability to set a stop or a profit target or the ability to set a specific time to trade. I have added those to this strategy. (And I for the life of me can not remember where I got the code for the the time, I need to find you!).
Special note: If you have never used the Renko bars in Tradingview, make sure you click the Format option next to whatever pair you are looking at and change it from Traditional to ATR. You can set it for a static pip amount if you want. But ATR at first will help you decide which amount of pips you should throw in.
This is my first published strategy so if I screwed up on anything or didn't explain it very well, please let me know!!

B3 Edge Trail-TraderAnswer to the locked strategy... Formerly "High-Low Trader" .. Changed the name to Edge Trail Trader to delineate from the locked version, which is no different. You can add this one to your favorites now.
Similar to SuperTrend or the ATR trailing stop lines that are common-place in chart indicator circles, the B3 High-Low Trail-Trader works as a back-break line to flip binary long and short biasing. Here is the strategy set to 7 bars back. You can find this style of trading system in several books, and there are many ways to come to the trailing stop line, so I imagine the bars back length can be slid around to suit certain charts. This happens to be my favorite trailing line.

Strategy Stochastic Crossover Backtest This back testing strategy generates a long trade at the Open of the following
bar when the %K line crosses below the %D line and both are above the Overbought level.
It generates a short trade at the Open of the following bar when the %K line
crosses above the %D line and both values are below the Oversold level.
You can change long to short in the Input Settings
Please, use it only for learning or paper trading. Do not for real trading.

B3 High-Low Trail-TraderSimilar to SuperTrend or the ATR trailing stop lines that are common-place in chart indicator circles, the B3 High-Low Trail-Trader works as a back-break line to flip binary long and short biasing. Here is the strategy set to 7 bars back. You can find this style of trading system in several books, and there are many ways to come to the trailing stop line, so I imagine the bars back length can be slid around to suit certain charts. This happens to be my favorite trailing line.

8ma34 EURUSD 1h 480tp 950slCrossing 8 sma and 34 sma on the 1h chart (close) of EURUSD.
If sma (8) crossing up sma (34) then open a long on closed bar with +480 pips for the take profit and -950 pips for the stop loss.
If sma (8) crossing down sma (34) then open a short on closed bar with -480 pips for the take profit and +950 pips for the stop loss.

Bullish and Bearish Engulfing StrategyI've been trying to put a stop loss in the High or Low of the last second bar after I open a position but in this example the only way to close it, is with the opposite action. Does anyone know how to put a stop loss and order with just stop loss and close when there is a bullish or bearish engulfing bar?

The Always Winning Holy Grail Strategy - Not (by ChartArt)How to win all the time if 1+1 = 2
The most upvoted strategies on Tradingview are those which seemingly work 100%, but they actually don't at all because they are repainting and would not work in live trading reality. They are using the multi-time-frame strategy testing bug and thereby trade during the backtest on close prices before the bar has closed in reality.
Top list of these cheating repainting strategies:
1569 upvotes ANN Strategy
877 upvotes Vdub FX SniperVX3 Strategy
481 upvotes Get Trend Strategy
I guess there are much more strategies among the top upvoted strategies on Tradingview which cheat with a multi-time-frame close price, but three examples are enough. The ANN Strategy uses the daily close price as multi-time-frame and cheats with that. The Vdub FX SniperVX3 Strategy uses the half-day (720 minute) close price to cheat and the Get Trend Strategy uses the 160 minute bar close for repaint cheating (at least here the author of this strategy explains that his strategy is only demo and would not work, which might be the reason why it has 1000 less upvotes than the ANN Strategy. I already wrote months ago a comment underneat these strategies to explain this issue but it hasn't stopped these strategies from getting more and more upvotes and staying in the top list.
I thought this way of cheating is lame, so I invented a new way to cheat my way to seemingly reach 100% profitable trades all the time by going long if 1+1 is equal to 2. Welcome to super wide stop losses. Simply use a extreme unrealistic large stop loss and take profit after a realistic amount of pips and according to Tradingview's current backtest module you win 100% all the time. Yay! :)
My recommendation for the Tradingview team is to add a function to let the user define a stop out and margin call level and maybe set a realistic setting as default, like 100%.
Please don't trade with this strategy!

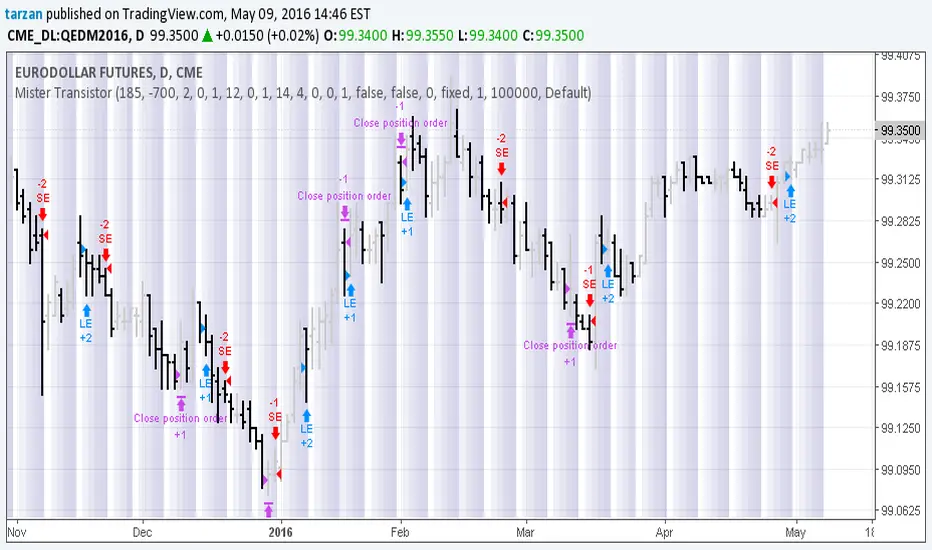
Mister Transistor 3.0This is a general purpose very flexible program to test the effectiveness of HA bars.
Please note that if you are charting at tradingview using Heikin-Ashi charting, your system will be trading fictitious prices even if you check the "use real prices" box. Thought you might like to know that before you lose all your money.
This program performs the HA calcs internally thus allowing you to use HA bars on a standard bar chart and obtaining real prices for your trades.
Courtesy of Boffin Hollow Lab
Author: Tarzan the Ape Man
MACD, backtest 2015+ only, cut in half and doubledThis is only a slight modification to the existing "MACD Strategy" strategy plugin!
found the default MACD strategy to be lacking, although impressive for its simplicity. I added "year>2014" to the IF buy/sell conditions so it will only backtest from 2015 and beyond ** .
I also had a problem with the standard MACD trading late, per se. To that end I modified the inputs for fast/slow/signal to double. Example: my defaults are 10, 21, 10 so I put 20, 42, 20 in. This has the effect of making a 30min interval the same as 1 hour at 10,21,10. So if you want to backtest at 4hr, you would set your time interval to 2hr on the main chart. This is a handy way to make shorter time periods more useful even regardless of strategy/testing, since you can view 15min with alot less noise but a better response.
Used on BTCCNY OKcoin, with the chart set at 45 min (so really 90min in the strategy) this gave me a percent profitable of 42% and a profit factor of 1.998 on 189 trades.
Personally, I like to set the length/signals to 30,63,30. Meaning you need to triple the time, it allows for much better use of shorter time periods and the backtests are remarkably profitable. (i.e. 15min chart view = 45min on script, 30min= 1.5hr on script)
** If you want more specific time periods you need to try plugging in different bar values: replace "year" with "n" and "2014" with "5500". The bars are based on unix time I believe so you will need to play around with the number for n, with n being the numbers of bars.

Mystic Pulse V2.0 Optimized Long [CHE]credits to youtuber : youtu.be
Key Insights
Strategy outperforms buy & hold BTC by 245%
Only 1 losing year (2022 bear market: -18.45%)
Average win (+19.24%) is 4.2× larger than average loss (-4.57%)
No repainting - all signals confirmed at bar close
The strategy file is ready to copy into TradingView. Apply it to BTCUSD 1D with the settings specified (100% equity, 0.1% commission, 1 tick slippag
